Disturbance functions as an essential element for increasing temporal and spatial heterogeneity and maintaining species diversity in the ecosystem (Lee and Cho 1999, Tierney and Cushman 2006). Herbaceous plants distributed in a forest show the quickest response to micro-environmental differences caused by disturbance in the ecosystem, and disturbance exerts a direct influence on the growth and biomass of these plants (Kim 1997).
In Korea, tigers and leopards are extinct due to population growth and industrialization following Japanese imperialistic rule, and bears, goats and musk deer distributed in some areas are now facing extinction (Kim et al. 1998). The wild boar (
In the forest ecosystem the ground disturbance by the wild boar's foraging activity forms pits, mounds, and plains. It also changes micro-environments including the thickness and amount of fallen leaves, soil temperature, and water content (Lee and Cho 1999, Pinna et al. 2007). The changes of micro-environments on the ground will cause differences of the dominance among plants which thrive in those environments. It is predicted that the different temporal and spatial changes on the herbaceous vegetation are triggered by many factors, including the structure of vegetation before disturbance, the period of wild boar's disturbance, the position of slope, and wild boar's population movement. The following must be investigated to understand the how increasing wild boar populations will effect Korea's forest ecosystem: (1) wild boar's behavior, (2) the environmental condition of wild boar's habitat, (3) wild boar's diet, and (4) the interaction of wild boar and other living things.
In order to understand the influence of the wild boar on the herbaceous layers in the forest ecosystem, this research identified a disturbance regime by wild boar that changes temporally and spatially, influences of wild boar's disturbance to the micro-environment, and the response of the herbaceous community in a mature
>
Description of the study site
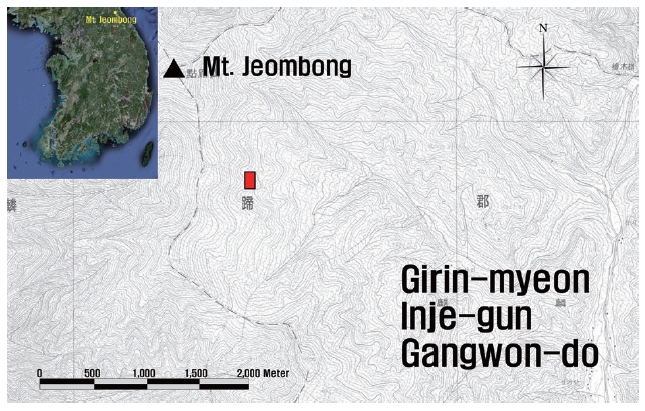
Mt. Jeombong is located at the southern end of Soraksan National Park, the administrative boundary line of Jindong-ri and Gwidoon-ri of Girin-myeon, and Oga-ri of Seo-myeon, of Inje-gun, Gangwon-do (E 128o25'-30', N 38o0'-5') (Fig. 1). In 1982 Mt. Jeombong was designated as part of the Sorak Biosphere Reserve by the UNESCO' Man and Biosphere Project together with Mt. Sorak. In addition, Mt. Jeombong is designated as a reserved forest for the protection of genetic resources (Kim et al. 1998). In Mt. Jeombong a mature
We extended the permanent plot (1 ha) previously built for the long-term ecological monitoring in 2004 and installed a permanent plot for the investigation which has a total area of 1.6 ha. The permanent plot is divided into sub-quadrat (20 m × 20 m) and micro-quadrat (10 m × 10 m). In order to characterize the wild boar's in the permanent plot, we investigated the size and depth of disturbance traces by wild boar at 7 times (April 20, June 12, August 31 and October 30 in 2008; April 9, June 11 and August 28 in 2009) and prepared a disturbance map using CAD (AutoCAD 2008; Autodesk, Inc., San Rafael, CA, USA). We calculated the distribution by size of disturbance traces and the area of disturbance using the map. Proportion (%) of disturbed area by wild boar according to the micro-topography was calculated by comparing the percentage of disturbed area to the south-facing slope, the mountain ridge, the north-facing slope and total plot areas. To compare local environmental factors among micro-topographic sites formed by wild boar, we divided the sites into pit, mound, and flat, corresponding to the south-facing slope, the mountain ridge and the north-facing slope respectively. We measured the temperature of the surface and -5 cm underground, the thickness and coverage of the litter layer, and soil moisture content based on the wet soil on April 22 in 2009. The litter index was calculated by multiplying their thickness to coverage of the litter layer. To understand the influence of the wild boar's disturbance on the herbaceous community, we identified a non-disturbed site to serve as a control (CON), an old wild boar disturbed site (OW) and a new wild boar disturbed site (NW). CON refers to an established quadrat which was not disturbed on June 27 in 2008. OW stands for a site disturbed before April 2008. NW refers to a site disturbed between April and June in 2008. We investigated the herbaceous community in each of established quadrats in 5 times (June 27 and September 3 in 2008; May 18, June 27 and September 3 in 2009). We calculated Shannon-Weaver's diversity index (H'), and Pielou's (1969) evenness index (J') and species richness by using vegetation data obtained from the field. The program SYSTAT 12.0 (SPSS Inc., Chicago, IL, USA) was used for correlation analysis and analysis of variance. The Turkey test was used for the post-hoc test of the analysis of variance. We analyzed detrended correspondence analysis (DCA) ordination by using CANOCO 4.0 (GLW-Cp.; Wageningen, The Netherlands). We prepared a spatial distribution map with GS+ (Gamma Design SoftWare, Plainwell, MI, USA).

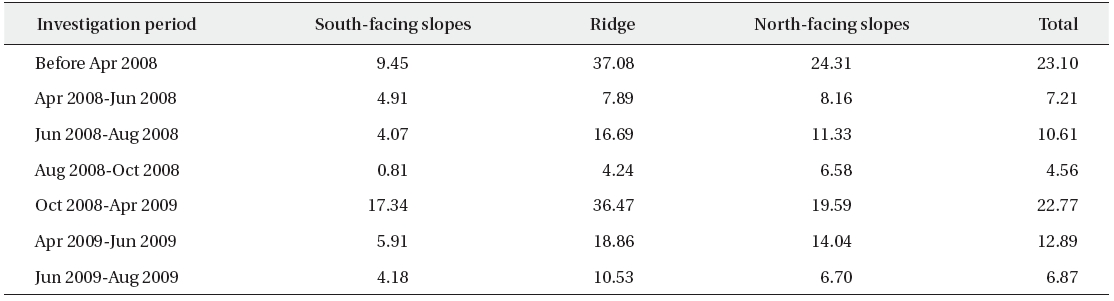
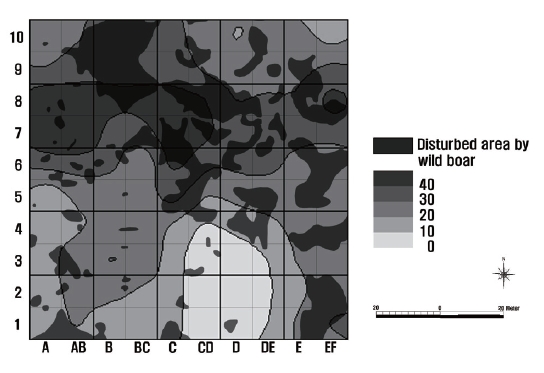
Proportion (%) of disturbed area by wild boar according to the micro-topographies in a 1.6 ha plot from April 2008 to June 2009 at Mt. Jeombong
>
Wild boar's disturbance regime
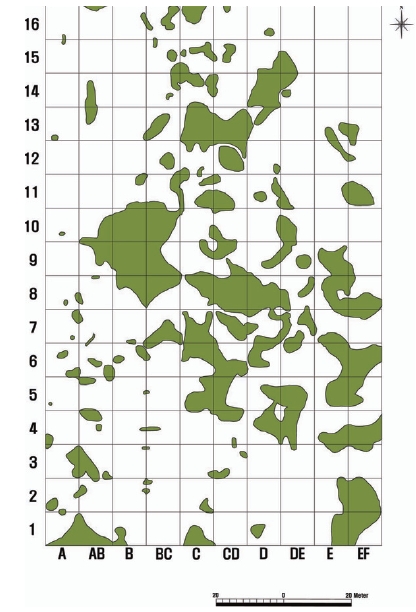
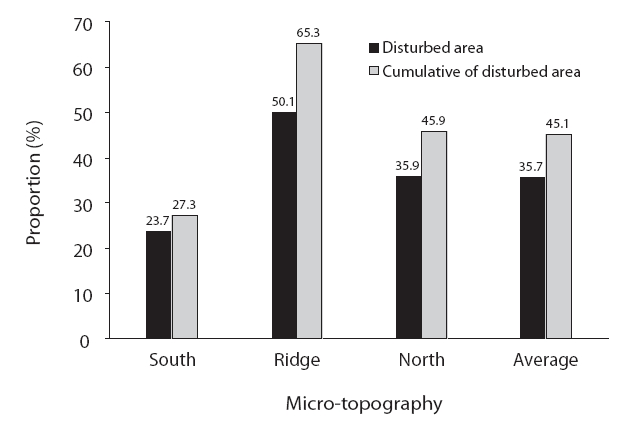
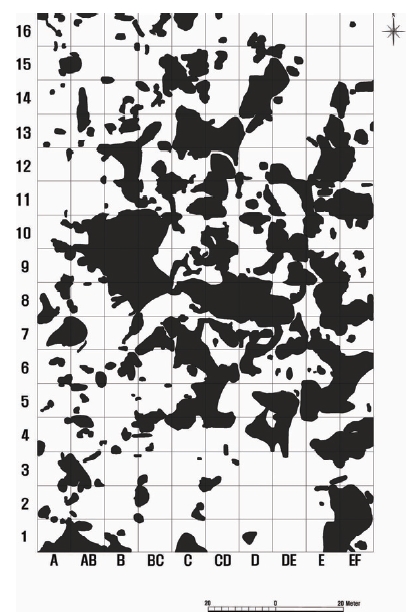
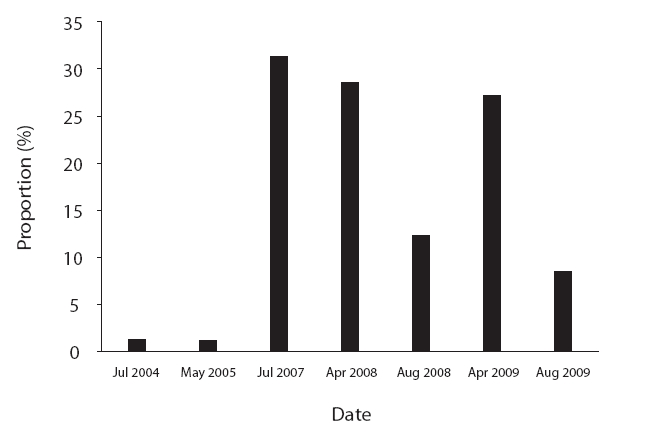
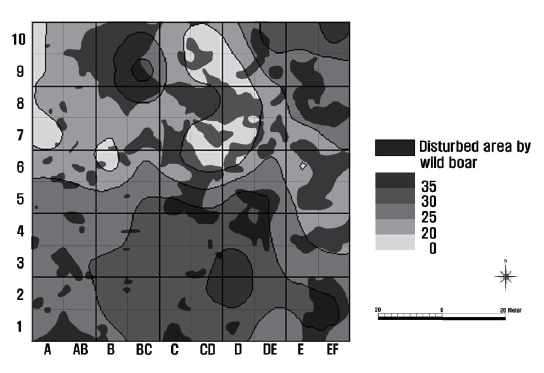
The season in which disturbance by wild boars was most severe in the investigation site was the period from late autumn to early spring when they have enough food on the ground. While disturbances occurred at all seasons of the year, the frequency of disturbance varied from season to season. In addition, the mountain ridge and the north-facing slope were disturbed more frequently than the south-facing slope area (Table 1). Fig. 2 indicates the total annual disturbed area between April 2008 and April 2009. Fig. 3 shows the disturbed area from October 2008 to April 2009. The ratio of disturbed area in the south-facing slope, the mountain ridge, the north-facing slope and the whole plot following this one-year investigation was 23.7%, 50.1%, 35.9% and 35.7%, respectively (Fig. 4). The disturbance cycle by wild boar in the south-facing slope, the mountain ridge, the north-facing slope and the whole plot was 3.7 years, 2.0 years, 2.8 years and 2.8 years, respectively, based on the above ratio. This calculation did not consider overlapping disturbances to one area. When overlapping disturbances are considered, the wild boar's disturbance occurs more frequently (Fig. 4). If we consider overlapping disturbances, the area ratio of disturbed area in the south-facing slope, the mountain ridge, the north-facing slope and the whole plot will be 27.3%, 65.3%, 45.9% and 45.1%, respectively (Fig. 4). Fig. 5 shows the changes of the disturbed area ratio in the investigated site from 2004 to 2009. The cycle of wild boar's disturbance might be longer than 2.8 years because wild boar's activity in this area remarkably increased from 2007.
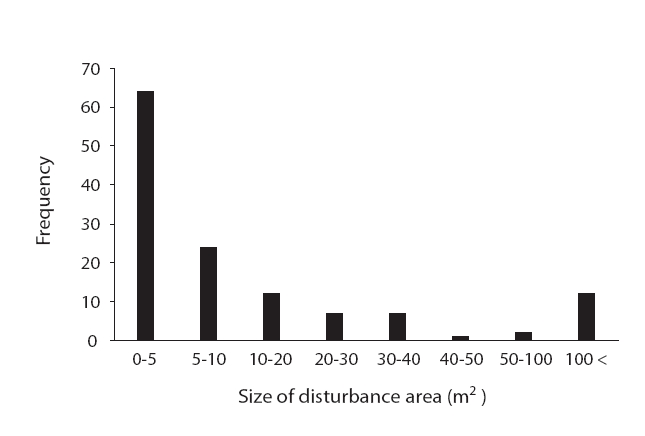
Fig. 6 indicates frequency of the size (area) class disturbed by wild boar for one year from April 2008 to April 2009. The most frequent size class which shows over 60 times was 0-5 m2. The second most frequent size class was 5-10 m2. The size class greater than 100 m2 showed more frequency than 10 times (Fig. 6). The largest disturbed areas during the periods from April to June in 2008, June to August in 2008, August to October in 2008, October in 2008 to April in 2009, April to June in 2009 and June to August in 2009 were 89 m2, 183 m2, 147 m2, 564 m2, 412 m2, and 160 m2, respectively. The period from October in 2008 to April in 2009 showed the largest disturbed area of the above periods. If we consider overlapping disturbances, the largest size of disturbed area during investigation period was 2,258 m2 (Lyang 2010).
>
Comparison of environmental factors among micro-topographies formed by wild boar

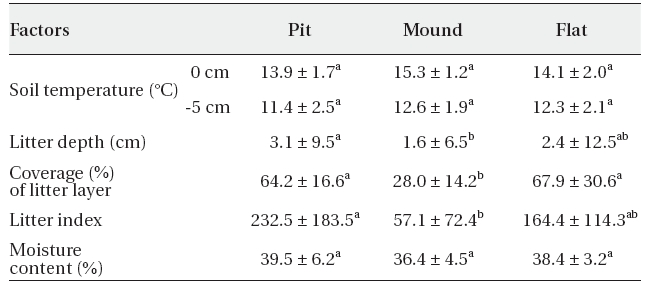
Comparison of the micro-environmental factors (mean ± standard deviation) on the ground layer among pit, flat and mound areas, micro-topographies created by wild boar in Mt. Jeombong (N = 12, P < 0.05)
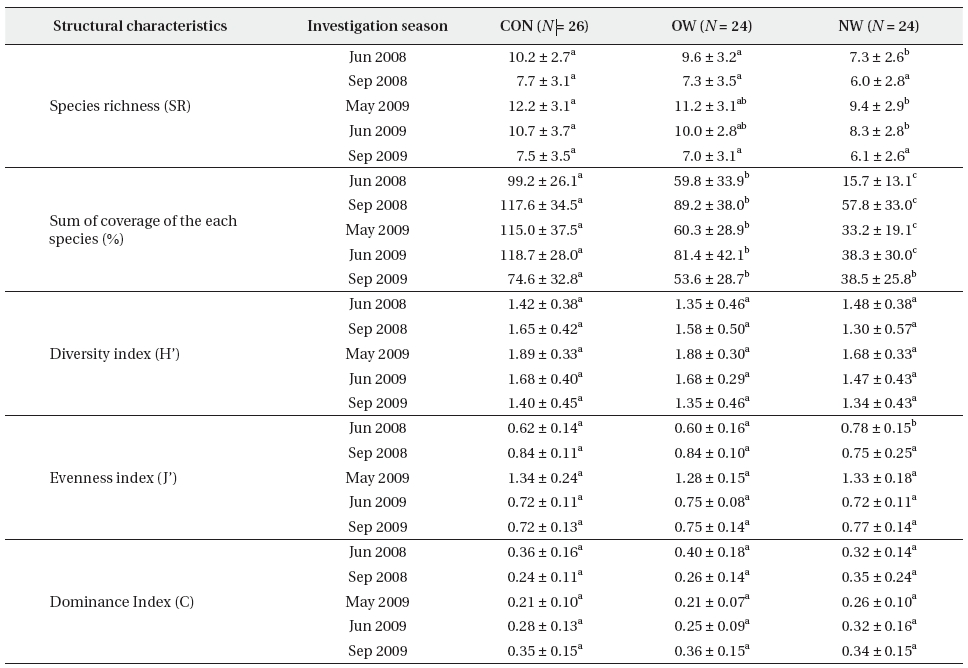
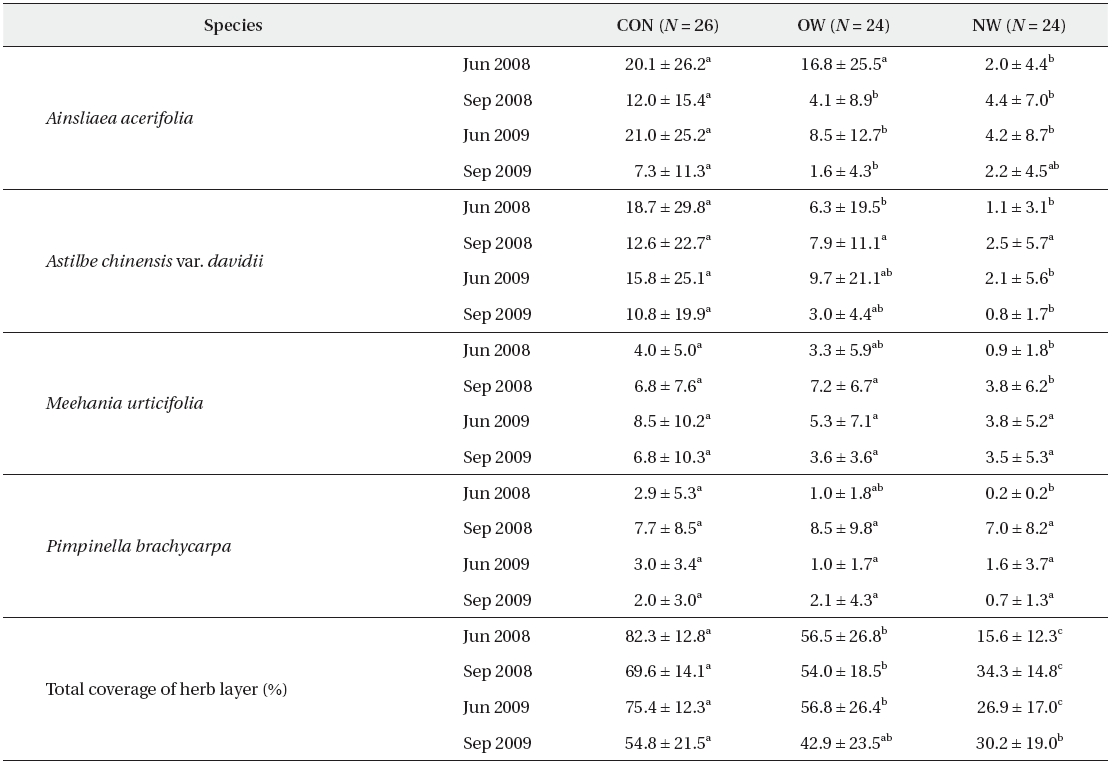
Comparison of the structural characteristics (mean ± standard deviation) of the herbaceous community in each investigation season (P < 0.05)
Ground soil temperature pit, flat, and mound, the micro-topographies generated by wild boar, 13.9℃, 14.1℃, and 15.3℃. The temperatures -5 cm underground were 11.4℃, 12.3℃, and 12.6℃, respectively; this was similar to that of the temperature of the surface (Table 2). The soil moisture content of pit, flat and mound were 39.5%, 38.4% and 36.4%, respectively (Table 2). The litter depth on pit, flat and mound were 3.1 cm, 2.4 cm, and 1.6 cm, respectively. The coverage of litter layer on pit, flat and mound were 64%, 68% and 28%. Here, it was notable that coverage of litter layer on mound was significantly lower than the other micro topographies. The litter indices on pit, flat and mound were 233, 164, and 57, respectively. The litter index on pit was significantly different compared to mound (Table 2).
>
Responses of herbaceous community by wild boar
The species richness and sum of coverage of each species at the initial time of study (June 2008) had a tendency to become decrease in the order of CON, OW and NW. Evenness had decreased in the order of NW, CON and OW. The sum of coverage of the each species becomes remarkably decreased in the order of CON, OW and NW. Species richness of NW was significantly decreased compared to CON and OW. Evenness index of NW was significantly higher compared to CON and OW. There were no significant differences in species diversity (H') or dominance index (C) among CON, OW and NW. There was no significant difference in the structural characteristics of communities between CON and OW except sum of coverage of the each species. These results suggest that new disturbances by wild boar have affected the sum of coverage of each species, species richness and evenness index of the herbaceous community. However, the structural characteristics of the NW community were similar to those of the OW community according to the time elapsed after disturbance (Table 3).
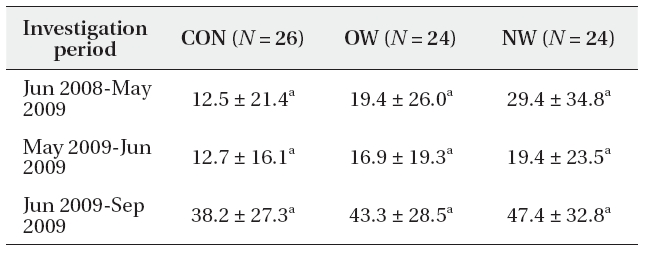
New disturbance by wild boar occurred in all locations from June 2008 to September 2009. The newly disturbed areas had a tendency decrease in the order of NW, OW

Comparison of the newly disturbed area (%, mean ± standard deviation) by wild boar during each investigation period (Jun 2008-Sep 2009) (P < 0.05)
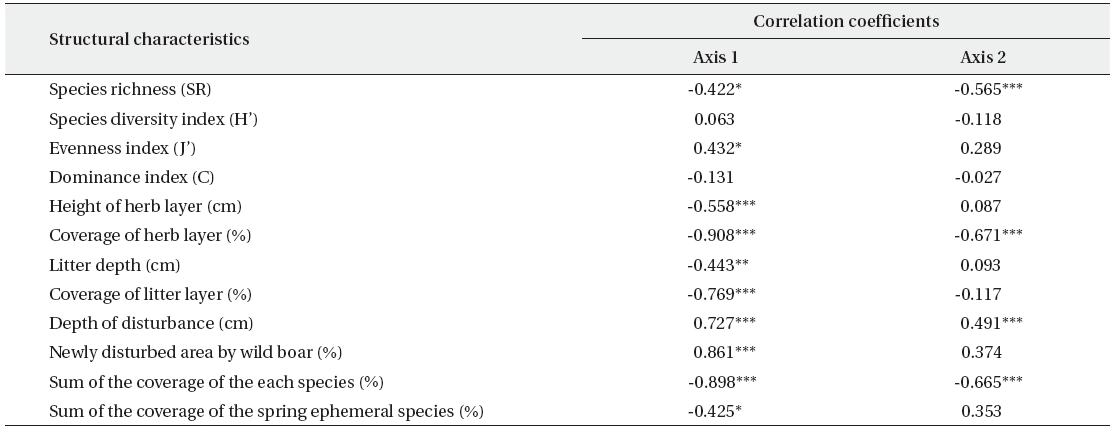
Correlation coefficients between the structural characteristics of the herbaceous community and stand scores of detrended correspondence analysis ordination axis 1 and 2 on June in 2008
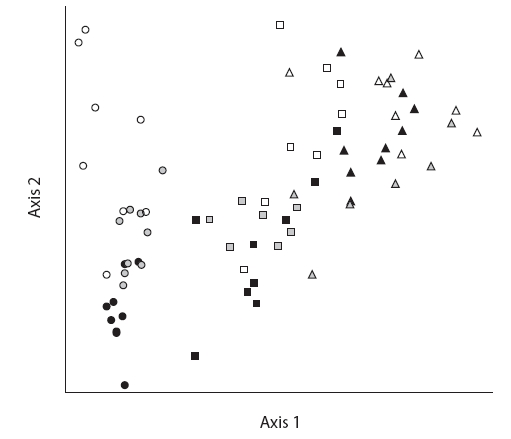
To comprehensively understand the influence of wild boar's disturbance on the structural characteristics of the herbaceous community, we conducted a DCA ordination based on the data matrix of 12 characteristics of community obtained from three measurements on June 27 in 2008. As a result, an eigenvalues of axis 1 and 2 were 0.31 (82% of whole variance) and 0.039 (10% of whole variance), respectively. The quadrats belonging to NW had a tendency to locate on the right side and those belong to CON on the left side of DCA axis 1. Quadrats belong to OW and NW showed the most widely distribution according to DCA axis 1. Quadrats belong to CON showed the widest distribution according to DCA axis 2. The quadrats located in the north-facing slope areas had a tendency to distribute on the upper side of DCA axis 2 (Fig. 7). Correlation coefficients between the 12 structural characteristics of the herbaceous community and stand scores of DCA axis 1 and 2 were put together in Table 5. The structural characteristics of herbaceous community demonstrating a negative correlation with stand scores on DCA axis 1 were the species richness, height and coverage of herb layer, sum of coverage of the each species and spring ephemeral species, and depth and coverage of litter layer. The structural characteristics of the herbaceous community indicating a positive correlation with stand scores on DCA axis 1 were the evenness, depth of disturbed site and areas which were newly disturbed during the investigation period. The characteristics of the community indicating a close negative correlation with stand scores on axis 2 were the species richness, coverage of herb layer, and the sum of coverage of herbaceous plant species. The only characteristic of the community showing a close positive correlation with these scores was the depth of disturbed site (Table 5). Therefore, we conclude that wild boar's disturbance affected most of structural characteristics of the community.
>
Response of major herbaceous plants Early spring herbaceous plants (Spring ephemeral)
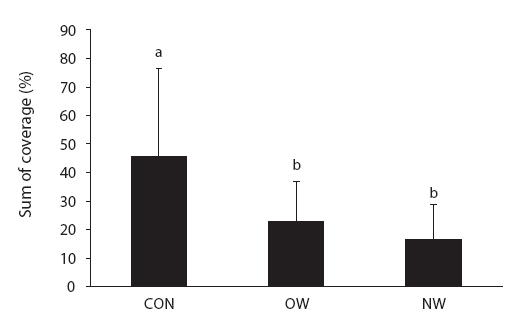
The sum of coverage of the spring ephemeral species in CON, OW and NW in May 2009 was 45.7%, 20.9% and 16.7%, respectively. The sum of coverage measured in OW and NW was significantly lower than CON (Fig. 8). Coverage of

Comparison of the coverage (%, mean ± standard deviation) of the each spring ephemeral species among treatments (P < 0.05)
>
Summer green herbaceous plants
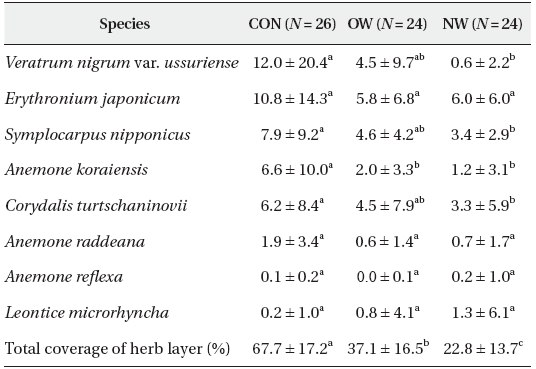
The sum of coverage of summer green herbaceous plant species during the period of investigation decreased in the order of CON, OW and NW (Table 7). In particular, there were distinct differences of coverage among dominant
The percent of the ground disturbed by wild boar during the year from April 2008 to April 2009 was 35.7% of the whole plot. It was inferred from this that the cycle of wild boar's disturbance in this area was approximately 2.8 years (Table 1). The largest area disturbed by wild boar in this study site was 564 m2. The relative frequency of the disturbed areas belong to 0-5 m2, 5-100 m2, and larger than 100 m2 in these areas was 39%, 59% and 2%, respectively (Fig. 8). Disturbance by wild boar did not occur frequently from summer to fall (Table 1). This is because wild boars prefer the evergreen needle-leaf forest which had a much more food resources such as Hymenoptera and Centipeda than deciduous broad-leaf forest in summer (Park et al. 1996, Kim et al. 1998, Pinna et al. 2007). The reasons why disturbance of the ground by wild boar occurs frequently from winter to early spring are that acorns are primarily produced in the fall, and that wild boar digs up the bulbs of

Comparison of the coverage (%, mean ± standard deviation) of the each herbaceous species showing the peak performance in summer among treatments (P < 0.05)
Relatively light disturbances by wild boar occurred in the central part of the south-facing steep slope of a permanent plot where the population density of
The physical disturbance of the ground by wild boar creates micro-topographies such as pit and mounds. It was shown that the wild boar's disturbance affects the development of the litter layer by causing differences in the thickness and coverage of the litter layer according to the micro-topography (Table 2). The litter layer of pits is the most developed and mounds are the least developed (Lee and Cho 1999). The thickness of litter layer is one of the most important environmental factors affecting species richness, species diversity, and species distribution of the herb layer in a mature oak forest at Mt. Jeombong (Lee and Cho 2000a). It was observed that the wild boar greatly contributes to the rearrangement of litter layer. Soil temperature, moisture content, organic content and nutrient content are affected by the litter layer, which is itself spatially rearranged according many factors including wind, micro-topography and concentration of shrub and trees. This irregular distribution of litter layer exerts the greatest influence on the spatial distribution of herbaceous plants in a forest (Lee and Cho 2000b).
The followings are some factors causing spatial heterogeneity of the local environment in a mature
In particular, wild boar's disturbance exerts a great influence on many characteristics such as the whole coverage, species richness and evenness of the herb layer (Table 3). Milton et al. (1997) reported that in Germany wild boar's disturbance reduces species richness. Characteristics of the community are greatly affected immediately after the wild boar's disturbance occurred, but these characteristics are recovered to different extents over time, reflecting the heterogeneity of the vegetation structure (Fig. 7). Each quadrat for this study was additionally disturbed by wild boar over time, and the additionally-disturbed area of OW and NW has a tendency to be bigger than that of CON (Table 3). This means these additionally-disturbed sites may have wild boar's preferred specific elements (e.g. the abundant distribution of wild boar's preferred plants for food) more than CON. In addition, this is related to the observation that once a place is disturbed by wild boar the place is disturbed many times (Fig. 4) (Groot Buinderink and Hazebroek 1996).
The sum of coverage of spring ephemeral on CON was significantly higher than that on OW and NW (Fig. 8). In particular, coverage of
The correlation analysis between disturbance of wild boar and herbaceous plants is essential to understanding the structure and function of the forest ecosystem. This is because wild boar's physical disturbance has been shown to directly affect herbaceous plants in forest. This research observed that wild boar's food source in early spring is the herbaceous plant