Nowadays, climate change has become an everyday word from the local to the regional and global levels. At the United Nations Conference on Environment and Development (UNCED), informally known as the Earth Summit, in Rio de Janeiro in June 1992, the United Nations Framework Convention on Climate Change (UNFCCC) was produced as an international environmental treaty. Currently, the convention includes 192 members and 4 observer countries. The objective of the treaty was "to stabilize greenhouse gas concentrations in the atmosphere at a level that would prevent dangerous anthropogenic interference with the climate system (http://unfccc.int/2860.php)." The 10th International Congress of Ecology was held in Brisbane, Australia in August 2009 with the theme: "Ecology in a Changing Climate - two hemispheres, one globe (http://www.intecol10.org/)." Climate is generally defined as "the composite or generally prevailing weather conditions of a region, such as temperature, air pressure, humidity, precipitation, sunshine, cloudiness, and winds (Random House Inc. 1987)" or the average weather over the course of the year, where weather is defined as "the result of the combined action of various meteorological factors at a given moment (Walter 1979)."
The weather conditions that have the strongest effects on human lifestyles as well as biotas are temperature and hydrature (the state of hydration). Precipitation is an indirect indicator of the hydrature in soil that affects the growth of trees and herbaceous plants locally as well as regionally (Kim 1988, 1993, Kimmins 2004). The Surface Synoptic Station in Seoul began monitoring the local weather in October 1907, but weather monitoring was interrupted from September 1950 to November 1953 during the Korean War; therefore, they have collected a total of more than 98 years of weather data.
My main objective is to analyze the patterns of change in daily temperature and precipitation in Seoul, Korea to better understand climate change in the region and its ecological implications through statistical analyses examining changes in temperature, the lengths of seasons, and the amount of precipitation in the Seoul area over the last 98 years. Information from these analyses could provide important baseline information not only for the further evaluation of ecological patterns and processes in natural systems but also for sustainable management of ecosystems and environment.
The climatic data used in this study were collected initially at the Central Meteorological Station in Seoul located at Woonni-dong, Chongno-gu, Seoul, Korea from 1 October 1907 to 18 January 1933 and subsequently at the Surface Synoptic Meteorological Station located at 1 Songwol-dong, Chongno-gu, Seoul, Korea from 18 January 1933 to the present. Although there are Automatic Weather Stations (AWS) in Seoul, weather monitoring at the stations was only initiated from 1988. As the Surface Synoptic Meteorological Station is the only meteorological station that has long-term climate records representing the Seoul area, climatic data from this station have been used in many studies (Min et al. 2003, Choi Y 2004, Ha and Ha 2006). The Korean War interrupted the collection of weather data from 1 September 1950 to 30 November 1953. Information about the location of the Surface Synoptic Station is summarized in Table 1.
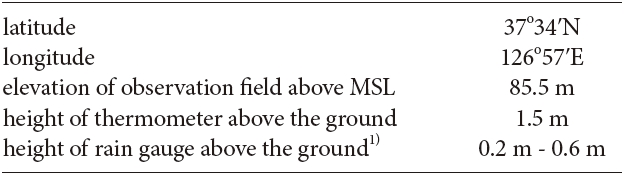
Information about the Surface Synoptic Station in Seoul (Korea Meteorological Administration, 2008)
I used daily meteorological data to calculate mean daily temperature, mean annual temperature, and changes in the lengths of seasons over the course of 98 years. I then applied statistical analyses to the data to determine the significance of the temporal changes observed during the period and estimated the changes per year (regression coefficients), the statistical significance levels, and the coefficients of determination (r2) to better detect and interpret the observed changes.
In determining the length of the four seasons each year, I used the threshold criteria for temperatures suggested by Lee (1979) and Kwon et al. (2008) to determine the lengths of the four seasons each year. Using this definition, spring begins on the first day with minimum temperature above 0℃ and mean temperature above 5℃summer starts on the first day with maximum temperature above 25℃ and mean temperature above 20℃ autumn is initiated on the first day with maximum temperature below 25℃ and mean temperature below 20℃ and winter is initiated on the first day with minimum temperature below 0℃ and mean temperature below 5℃. In this paper, for the sake of convenience, the season for each day was determined from the mean daily temperature of each day using these guidelines.
Growing degree-days (GDD), a measurement of heat, are frequently used to describe the timing of biological processes (Kim 1988, McMaster and Wilhelm 1997). The basic equation used for the calculation is GDD = ∑ [(TMAX + TMIN)/2 - TBASE], where TMAX and TMIN are daily maximum and minimum air temperature, respectively, and TBASE is the base temperature, and when (TMAX + TMIN)/2 >; TBASE. In this study, mean daily temperature was used as the values for (TMAX + TMIN)/2 and TBASE was set as 5℃. For each day of the year, GDD was determined by adding all the sums of differences of the mean daily temperature minus 5<℃ for the days when mean daily temperature goes over 5℃. Using the daily data for GDD, mean daily GDD, mean annual GDD, and monthly GDD were calculated. Statistical analyses were applied to test the significance of the annual changes in the different sets of GDD over the period.
From the daily precipitation data for the last 98 years, I calculated the mean daily precipitation and total annual precipitation, and conducted statistical analyses to determine the significance of the changes observed during the period from 1908 to 2009.
In order to detect climate change occurring during the period, I compared climate regimes during three intervals: the first interval included the 30 years from the initiation of weather monitoring in 1908 until 1937, the second interval spanned the period from 1938-1979 (this period was longer than the other intervals and included the Korean War years when climate data were not collected), and the third interval included the 30 years from 1980 to 2009. I conducted analyses of the daily temperature and precipitation, and GDD data sets for each interval and then made comparisons among the intervals.
The climate data were processed using an IBM-PC compatible personal computer and statistical analyses were carried out using the SAS (Statistical Analysis System) package. The data were also processed and plotted using Microsoft Office Excel 2007
>
Changing patterns in temperature
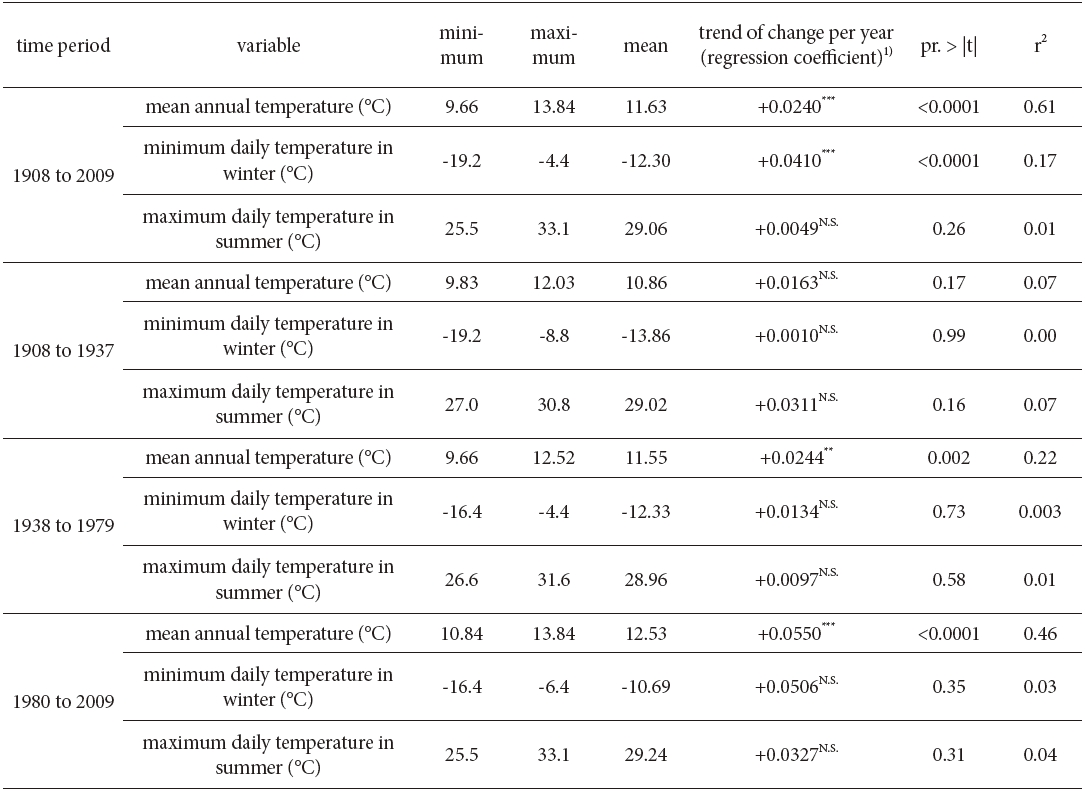
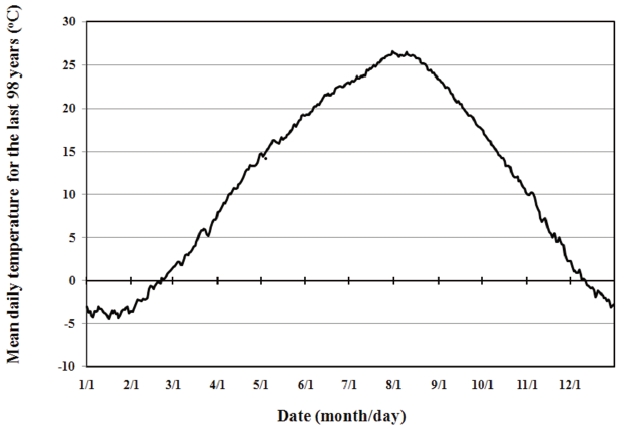
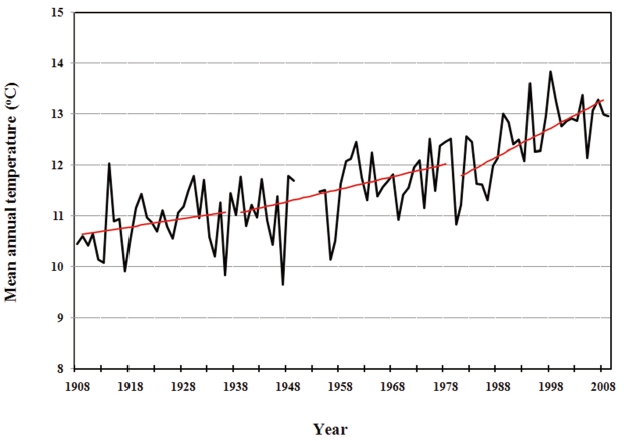
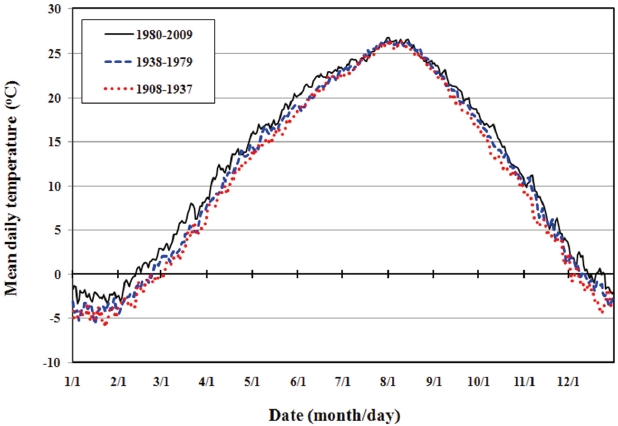
Seoul is located in a temperate zone. The highest mean temperature was observed on 31 July (26.6℃) and the lowest on 16 January (-4.43℃). The mean temperature from 1908 to 2009 was 11.63℃. Fig. 1 shows the daily mean temperatures in Seoul from 1908 to 2009. Fig. 2 shows changes in the mean annual temperatures during the study period. Mean annual temperatures in Seoul increased significantly at a rate of 2.40℃ for 100 years, which is three times faster than the global temperature increase of 0.74℃ for 100 years (UN IPCC 2007). It is also striking that mean annual temperatures in Seoul in the last 30 years increased at a rate of 5.50℃ per hundred years, which is an extremely fast rate of warming, and is remarkably high compared with the intervals from 1908 to 1937 and from 1938 to 1979, during which the rates of increase were 1.63℃/100 y and 2.44℃/100 y, respectively (Table 2).
Because the Surface Synoptic Station in Seoul is located in central Seoul, which is the capital city of Korea which with surrounding suburban areas has a population of 25 million people, the rapid increases in temperature can be ascribed to the heat island effect resulting from urbanization (Kim and Baik 2002, Choi et al. 2003, Oh et al. 2004). Further studies will be needed to clarify the effects of urbanization in the Seoul area on the climate, but the results of this study clearly point out the existence of the heat island phenomenon in the Seoul area.
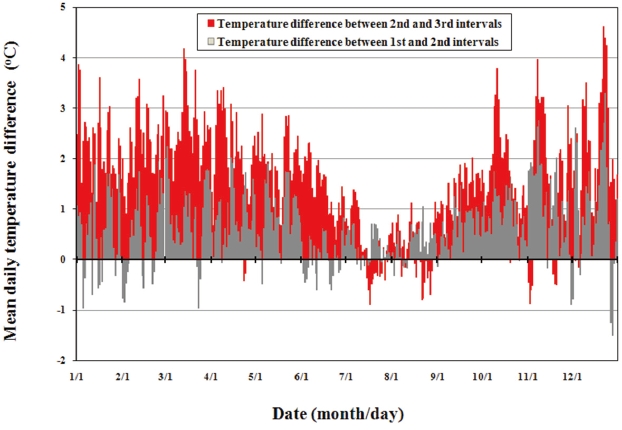
Summary statistics for the temperature-related variables for the 98 years and those for each 30-to-38-year interval are presented in Table 2. For the last 98 years, the minimum daily temperature in winter increased significantly at a rate of 4.10℃ per 100 years over the 98-year data set. In contrast, the maximum daily temperature in summer did not increase. Fig. 3 shows the mean daily temperature for the three diff erent intervals. Generally, mean daily temperatures tended to increase across the three intervals. The mean temperatures for the three intervals were 10.86℃, 11.55℃, and 12.53℃, respectively (Table 2).
The changes in the lengths of seasons in summer and winter across the 100-year period were remarkable. Using the threshold temperature and mean daily temperature to define seasons, as suggested by Lee (1979) and Kwon et al. (2008), my study results viewed from the trend of change per year in regression coefficient show that the mean number of days in summer significantly increased while the mean number of days in winter decreased from 27 to 28 days over the last 100 years (Table 3). In contrast, the numbers of days in spring and autumn did not change signifi cantly during the study period (Table 3). Th is study statistically confi rms the observation of Ho et al. (2006) suggesting early initiation of spring and late arrival of autumn in Seoul, however.
[Table 2.] Statistics for the temperature-related variables from 1908 to 2009

Statistics for the temperature-related variables from 1908 to 2009
My comparisons of the means of mean daily temperatures for the three intervals showed quite different patterns for different seasons (Fig. 3). Because it was rather complex to define the differences among the means of three intervals, I compared the differences in mean daily temperatures between subsequent intervals for the three interval periods from 1908 to 2009, and defined the temperature difference between the 1st and 3rd intervals as the sum of the values of two differences. It was quite clear that the peak temperature in summer did not increase. From mid July to late August, the mean temperature difference among the intervals in the period was less than 0.22℃ and some days had decreasing mean temperatures in mid-July. In contrast, from December to February next year, mean temperatures increased by 2.14℃ and some days in late December and mid-March had temperature increases of >4℃ (Fig. 4).
>
Changes in growing degree-days
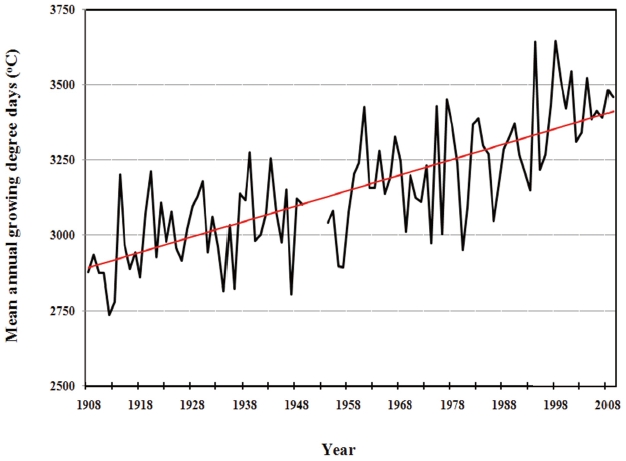
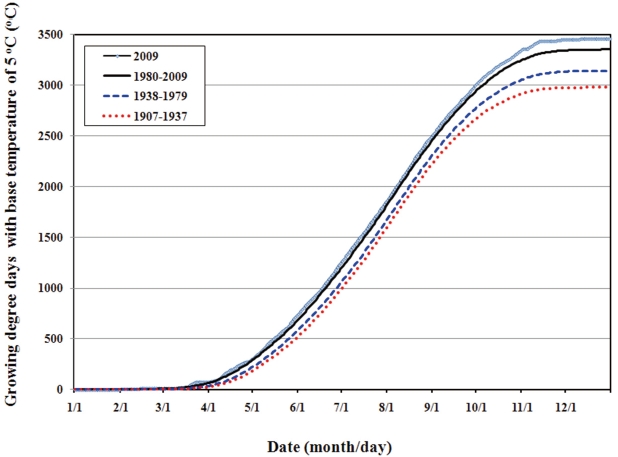
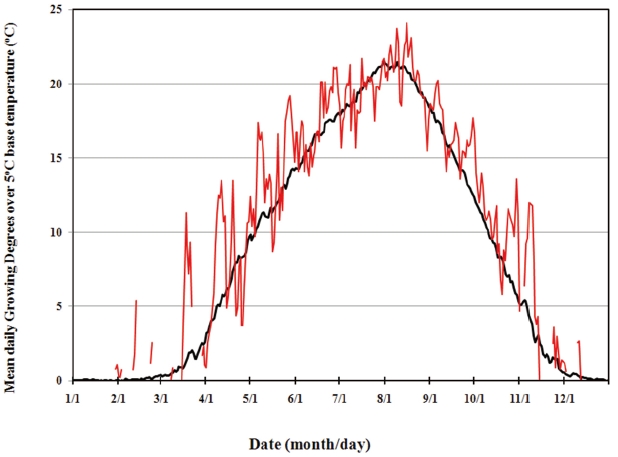
Annual patterns of GDD with base temperature of 5℃ in Seoul during the three interval periods from 1908 to 2009 and patterns of daily growing degrees are presented in Figs. 5 and 6. The patterns of changes in GDD and daily growing degrees reflected changes in daily cumulative temperature and daily temperature, respectively.
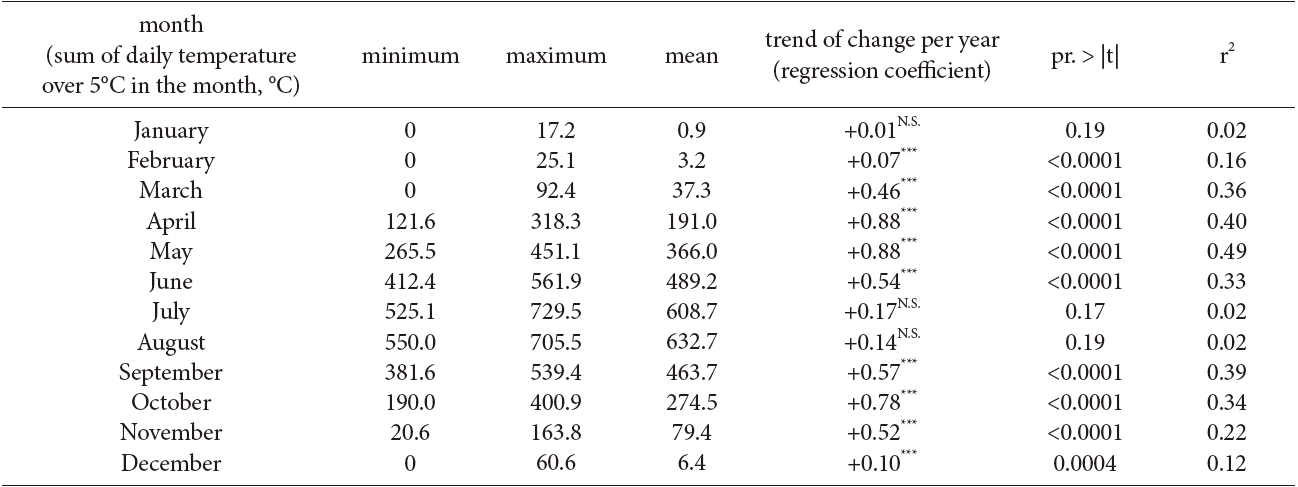
Statistics for the monthly GDD related variables and those on monthly basis for the last 98 years are summarized in Tables 4 and 5. Generally, monthly GDD tended to increase significantly over the study period for all months except January (Table 4). No significant changes were observed in GDD of summer months of July and August and in those of winter month of January (Table 5). Changes in GDD were observed in the months of spring and autumn for the last 98 years.
Due to increases in GDD during most months, the mean annual GDD in Seoul increased significantly during the period from 1908 to 2009 (Fig. 7). As the GDD was calculated based upon the base temperature above 5℃, the changes in mean annual GDD were quite similar to those in mean annual temperature. Information about monthly trends in GDD provides us with further information for interpreting natural phenomena including phenological changes in ecosystems (Ho et al. 2006).
[Table 3.] Number of days in each season during the period from 1908 to 2009
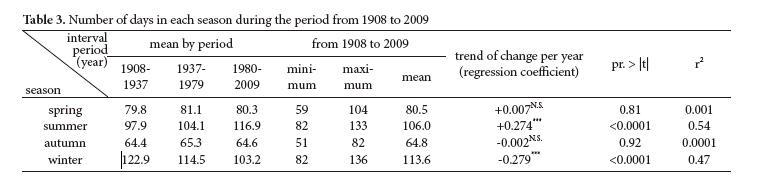
Number of days in each season during the period from 1908 to 2009
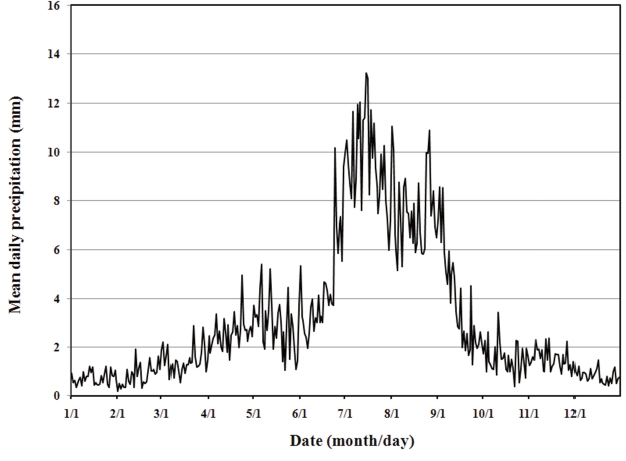
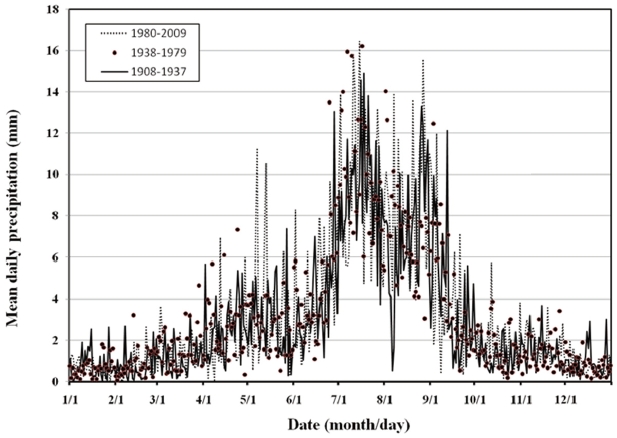
The rainfall regime on the Korean Peninsula is characterized by a monsoonal pattern of precipitation. In Seoul, the monsoon season begins in late June, peaks in early-to-mid-July, and ends in late July. About 90 typhoons also affected the Seoul area in the last century, which means that about one typhoon per year has affected Seoul (Korea Meteorological Administration 1996). Although typhoons can occur from late May to late October, about 90% of typhoons in the area occur from mid-July to mid-September. After late September, mean daily precipitation decreases to 2 mm per day. Mean daily precipitation during the study period was highest on 16 July (13.2 mm) and the lowest on 1 February (0.2 mm) (Fig. 8).
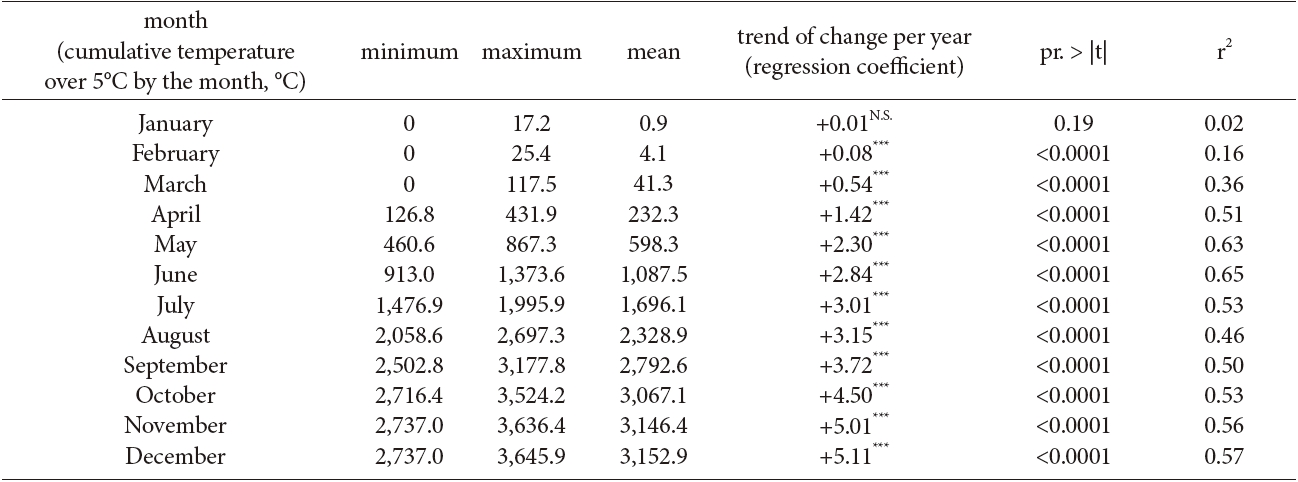
Statistics for monthly growing degree-days related variables for the last 98 years from 1908 to 2009

Statistics for the growing degrees related variables on monthly basis for the last 98 years from 1908 to 2009
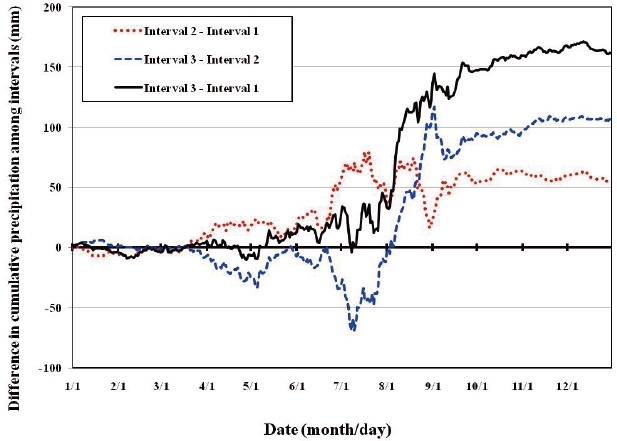
Quite large fluctuations in mean daily precipitation occurred during the study period (Fig. 8). Mean daily precipitation in Seoul also varied during three interval periods from 1908 to 2009 as shown in Fig. 9. As it was quite difficult to quantify this variation, I used a two-step process to describe the differences: firstly, I described the trends in cumulative precipitation (Fig. 10); and secondly, I examined the differences in trends among intervals (Fig. 11). The results show clear differences in mean daily precipitation during the intervals.
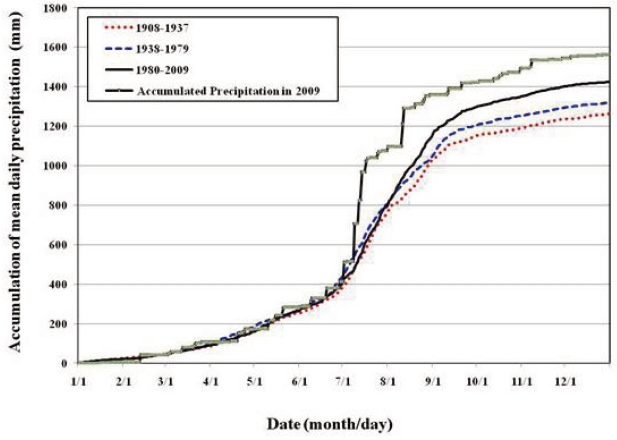
When cumulative precipitation to date in Seoul was plotted for the three intervals from 1908 to 2009 and for 2009, the diff erences are clear (Fig. 10). In 2009, it rained much more than average from early-to-mid-July to earlyto-mid-August and did not rain much after mid-August because no typhoon affected the Korean peninsula during this period, all of which resulted in an increase in the total amount of precipitation in 2009. When cumulative precipitation for the three intervals was plotted on daily basis, the amount of precipitation in the first interval (from 1908 to 1937) was quite low compared with those in the two other intervals. Means of annual precipitation for the three intervals were 1,262.5 mm, 1,317.4 mm, and 1,423.6 mm, respectively.
The difference in mean annual precipitation between the first and the second intervals was 55.0 mm and that between the second and the third was 106.2 mm. Consequently, the difference in mean precipitation between the first and the third intervals was 161.2 mm (Fig. 11). The daily dynamics of the differences are shown in Fig. 11. The change in total precipitation could be mainly ascribed to increases in precipitation during August in the third interval compared to the second interval. It was very interesting to observe the sharp contrasts in precipitation during the period from March to July between the difference of interval 3 (1979-2009) and interval 2 (1938-1979) and that of interval 2 (1938-1979) and interval 1 (1908-1937). Little change in precipitation was observed in autumn and winter, which emphasizes the importance of seasonal approaches to understanding the dynamics of annual variation in precipitation.
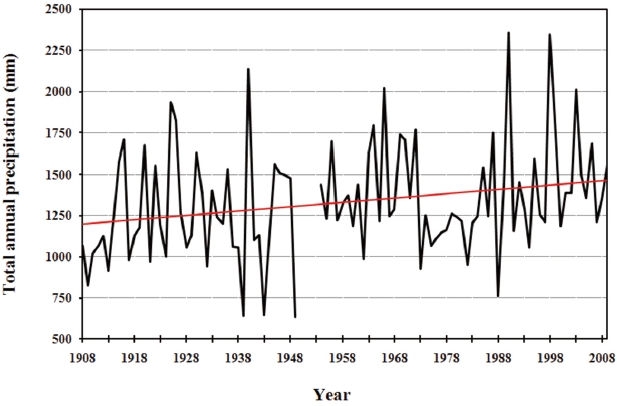
Variation in total annual precipitation across the study period is shown in Fig. 12. The mean annual precipitation for the whole study period was 1,333.1 mm, but total annual precipitation increased at an average rate of 2.67 mm per year, which resulted in a 267 mm increase over the 100-year period. This increasing trend was not clearly detected if separate analyses were conducted for each of the three 30-to-40-year interval periods (Table 6).
[Table 6.] Statistics for precipitation-related variables from 1908 to 2009
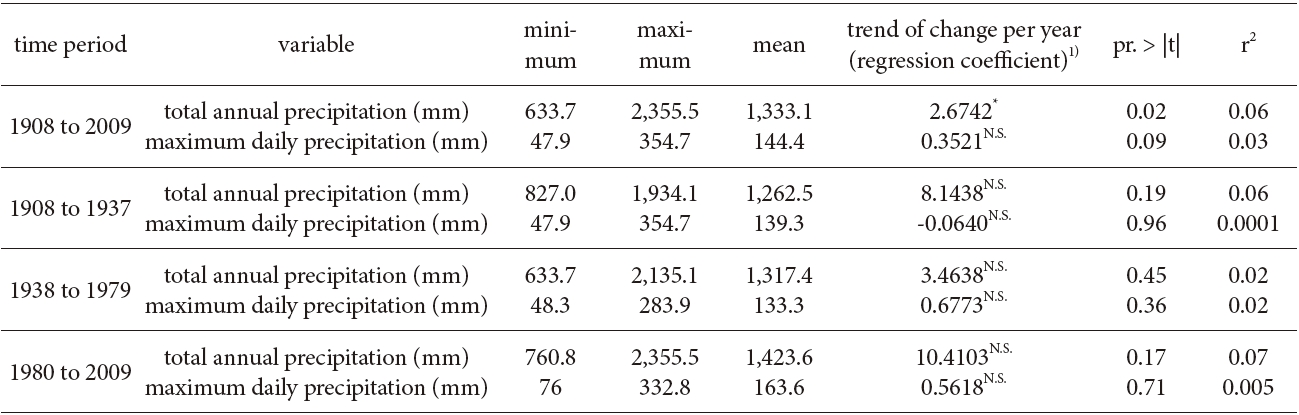
Statistics for precipitation-related variables from 1908 to 2009
[Table 7.] Statistics for monthly precipitation related variables for 98 years from 1908 to 2009

Statistics for monthly precipitation related variables for 98 years from 1908 to 2009
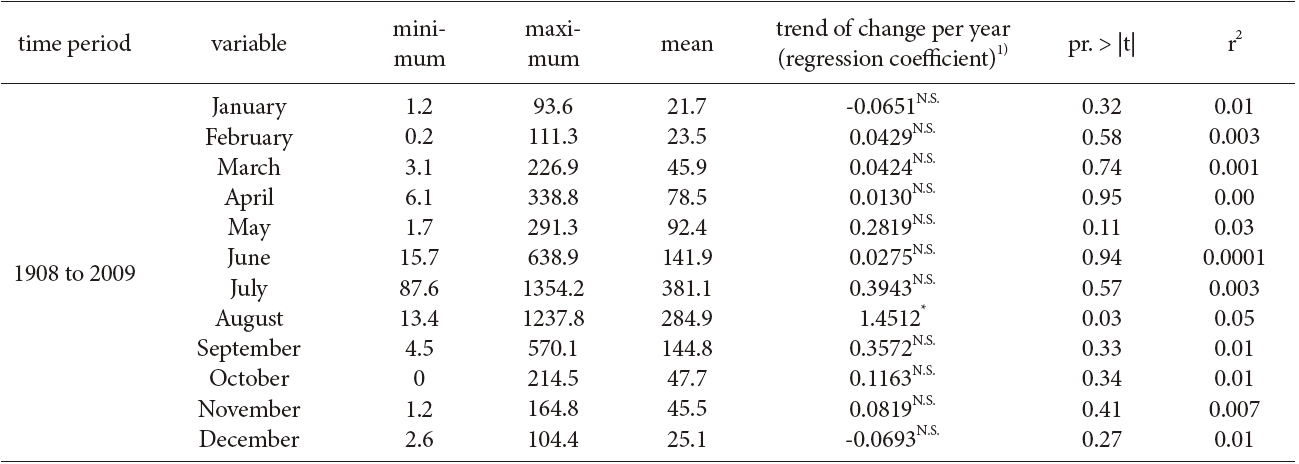
To determine in which months the increases in precipitation occurred, I further analyzed variation in total monthly precipitation. It is quite interesting to note that monthly precipitation did not significantly increase from 1908 to 2009 except in the month of August (Table 7). When the same statistical analyses were conducted for the three 30-to-40-year intervals, increases occurred in only a few months: in December from 1908 to 1937 and in April and August from 1938 to 1979. In the period from 1980 to 2009, there was no month that showed a significant increase in precipitation.
Climate change, represented by increases in mean temperatures at the local, regional and global levels, has become a common concern for many people, and more information is required about many aspects of this problem, including such issues as the effects of urbanization (Oh et al. 2004), the potential impacts on ecosystems (Kim and Kil 1996, Kong 1999, Kim and Kim 2000, Kim and Pang 2009, Kim et al. 2009), and the development of adaptation strategies (Choi 2008). UN IPCC (2007) suggested that efforts should be made in the following areas: the establishment of the physical science basis for climate change; assessment of the impacts of climate change as well as the potential for adaptation and vulnerability; and mitigation of climate change to prevent or avoid abrupt or irreversible effects. In this study, I used statistical analyses to demonstrate that the recent warming trend was much faster in Seoul than in other areas and that precipitation also increased over the 98-year period, although this trend was not detected in separate analyses conducted for each 30-to-40 year interval within the study period. The results of this study can provide a basis for further studies simulating the soil moisture content in forests utilizing daily temperature and precipitation data (e.g., Kim 2010) and for further evaluation of ecological patterns and processes in natural systems, such as the decline of some tree species in Korea.