Home range variation in mammals is influenced by a number of natural factors including sex, body mass, intra- and interspecific competition, population density, mating system, and prey abundance and distribution (Delany 1982, Sandell 1989, Benson et al. 2006). Recently, human activities such as agriculture, forestry, industry, urbanization and recreation have severely affected natural ecosystems (Vitousek et al. 1997). Various anthropogenic factors affect the home ranges of wild mammals. For example, paved roads are effective barriers to the mobility of small mammals (Mader 1984), and paved roads have been shown to prevent dispersal by badgers (Clarke et al. 1998). Urbanization also affects the movement of mammals. Home range sizes of raccoons are smaller in urban areas than in rural areas (Prange et al. 2004). Introduced or invasive species have also extended their home ranges into new habitats (Delany 1982).
The leopard cat,
Previous studies of ranging in the Tsushima leopard cat have revealed that natural factors affect home range size variation. For example, male leopard cats have larger home range than females, and the male leopard cats tend to expand their home ranges during the rutting season (Izawa et al. 2009). Conversely, female home range sizes shrink during the period when they nurse their kittens (Doi et al. 2005). Home ranges of same-sex adults do not overlap, male and female ranges may overlap (Maekawa 1998, Ueno 2004).
About 90% of the land in the Tsushima Islands is forested. However, urbanization and land development are increasing, placing pressure on wild animals in the Tsushima islands.
However, no studies of ranging in the leopard cat to date have evaluated the effects of anthropogenic factors on cat movement and space use. In this study, we quantified home range variation and habitat use in a Tsushima leopard cat living in a suburban area.
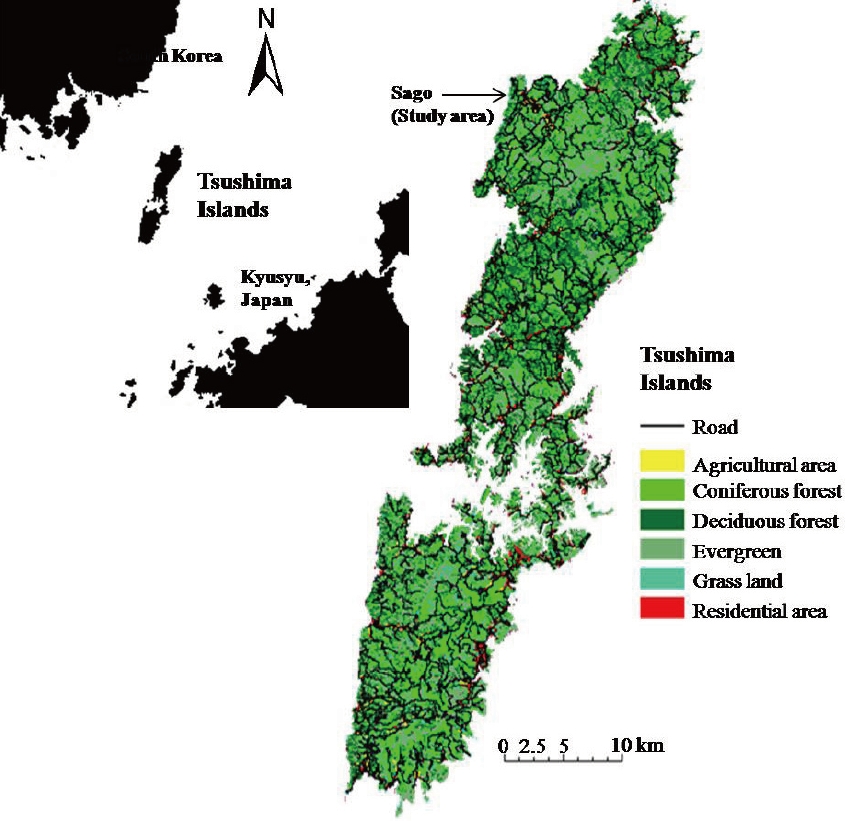
The Tsushima Islands (708.3 km2, N 34℃05´-34℃42´, E 120℃10´-129℃30´) are located between Kyushu (Japan) and the Korean Peninsula (Fig. 1). The human population of the islands was reported as 38,481 in 2005 (Tsushima population database 2005, Tsushima city hall). The Tsushima Islands are in the Temperate Zone, with mean annual precipitation of 1,198 mm and mean annual temperature of 15.4℃ (Maximum 32.4℃ in August and Minimum -6.2℃ in December) in 2005 (Weather statistical information 2005, Japan Meteorological Agency). The forests on the islands are mostly secondary forests (genus
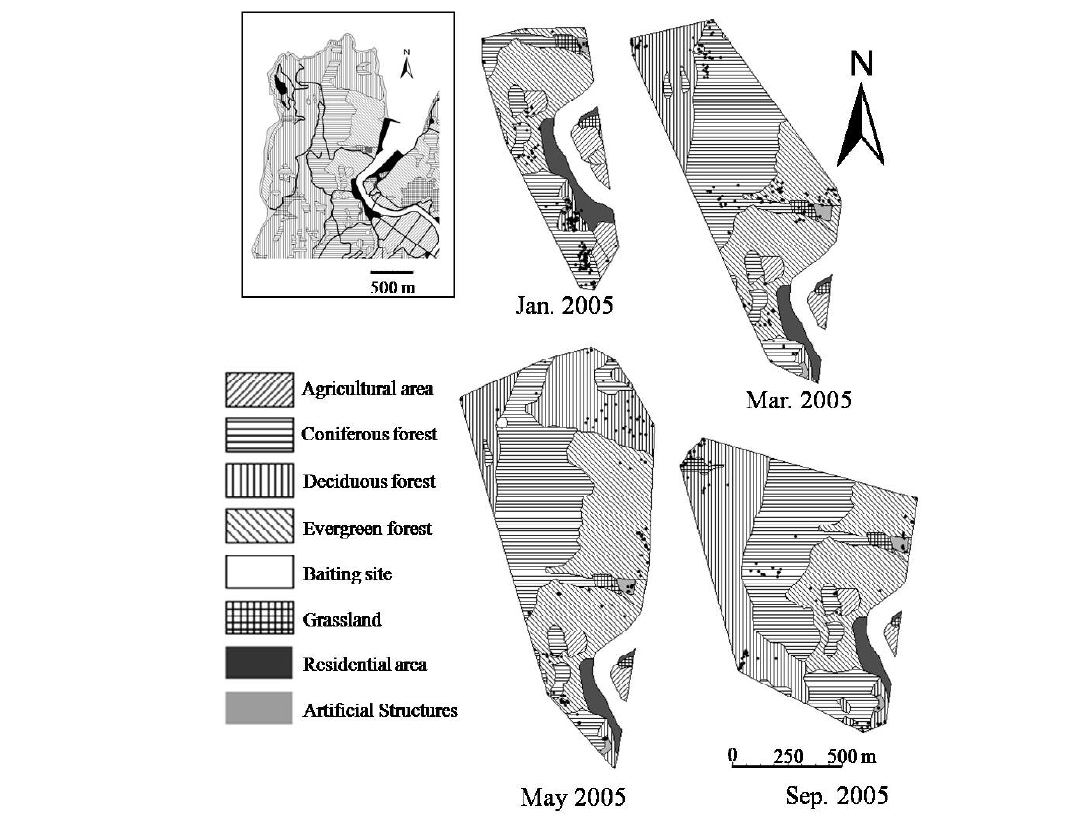
This study was conducted in the Sago area on the northwestern part of the islands (Fig. 1). The Sago area consists of a village, agricultural areas (mainly rice paddy fields), grasslands, rivers, and deciduous, evergreen and coniferous forests. The population of the Sago area was 206 in September, 2005 (Tsushima population database 2005, Tsushima city hall). Local residents work in agriculture, forestry, fisheries and tourism. There are free-ranging domestic cats and dogs in the area, and domesticated fowl are kept in coops in villages. Most human activities and traffic increases in the morning and decreases at night. The Tsushima Wildlife Conservation Center (TWCC) was established in Saozaki Park near the study area in 1997. Many tourists visiting TWCC and Saozaki Park drive through the study area during the daytime. Bait for the Tsushima leopard cat is provided five times/week by NPO at two sites in the southern and northern parts of study area.
>
Radio-collared Tsushima leopard cat
An adult male Tsushima leopard cat attacked domesticated chickens and was captured by a farmer on 22 November, 2004. The captured cat was anesthetized with an intramuscular injection of a ketaminemedetomidine mixture by the staff veterinarian of the Tsushima Wildlife Conservation Center. Subsequently, the cat was weighed, its external features were measured, its age was estimated, its sex was determined and the cat was fitted with radio-collar (weight 48 g, Advanced Telemetry Systems, Minnesota, USA). After a brief period in captivity at the Tsushima Wildlife Conservation Center, the cat was released near the capture point on 13 December, 2004. At the time of capture, the leopard cat had a body mass of 2,960 g, a head and body length of 535 mm, and a tail length of 255 mm.
Radio-tracking was carried out at intervals of 1 hour for 7-10 consecutive days from 13 to 20 January, from19 to 26 March, from 17 to 25 May and from 11 to 19 September 2005. The location of the radio-collared cat was fixed using a Yagi-type antenna (Arukitek Co. Ltd. Japan) and a portable receiver (FT-290mkII, Yaesu Musen Co. Ltd. Japan). The location of the cat during each sampling interval was estimated by two or more directional bearings obtained from known sites (White and Garrot 1990a) and recorded using a handheld GPS (Garmin Ltd. USA). Tracking of the cat was continued until its recorded home range did not expand any more. The status of the cat was determined by a change in radio signal strength as being "Active" or "Resting". Home range size (HRS) was analyzed using the 100% Minimum Convex Polygon method (MCP, Mohr 1947). The daily movement range (DMR) was calculated for each 24-hour tracking period using the 100% MCP. In addition, the total daily movement distance (DMD) was calculated as the cumulative distance between consecutive locations obtained within one hour during each 24-hour tracking period. DMRs and DMDs were calculated only when more than 12 locations were obtained in a day.
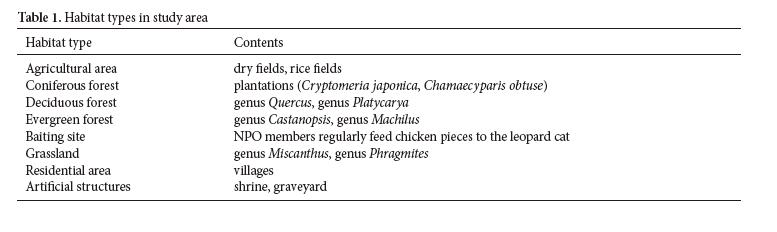
The habitat was categorized into eight types: agriculture areas, coniferous forests, deciduous forests, evergreen forests, baiting sites, grassland, residential
[Table 1.] Habitat types in study area

Habitat types in study area
areas and artificial structures using a digitized vegetation map (1:25,000, Japan Wildlife Research Center 1998) and the Loas and Biotas (Ecological Software Solutions, Switzerland) (Table 1). "Artificial structures" include constructions outside of village areas, including shrines and graveyards. As we assume that the cat was attracted to the bait when the cat was within 25 m of the baiting site, we considered the baiting site as being comprised of a circular area of 25 m radius.
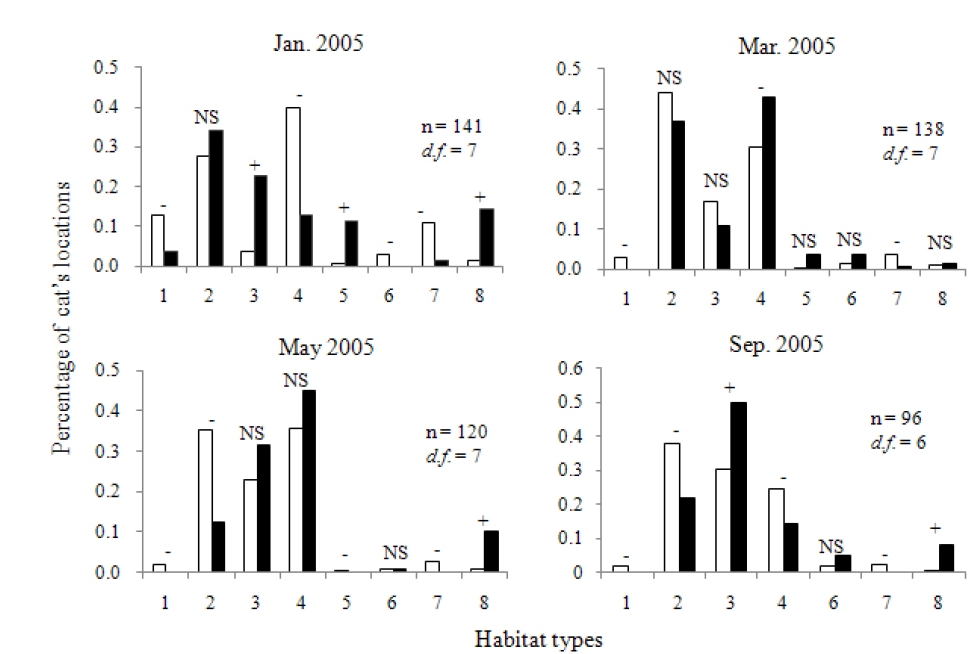
Habitat use was analyzed by the chi-square test for goodness-of-fit of utilized to available habitat types (Neu et al. 1974, Byers et al. 1984, White and Garrot 1990b, Kiyota et al. 2004, 2005). If a significant difference was recognized between expected and observed utilization frequencies, we calculated Bonferroni confidence intervals to determine which habitat types were preferred or avoided (Byers et al 1984, Kiyota et al. 2005). To estimate the magnitude of the habitat preference, we calculated the Ivlev’s electivity index (Ivlev 1961; Steinheim 2005).
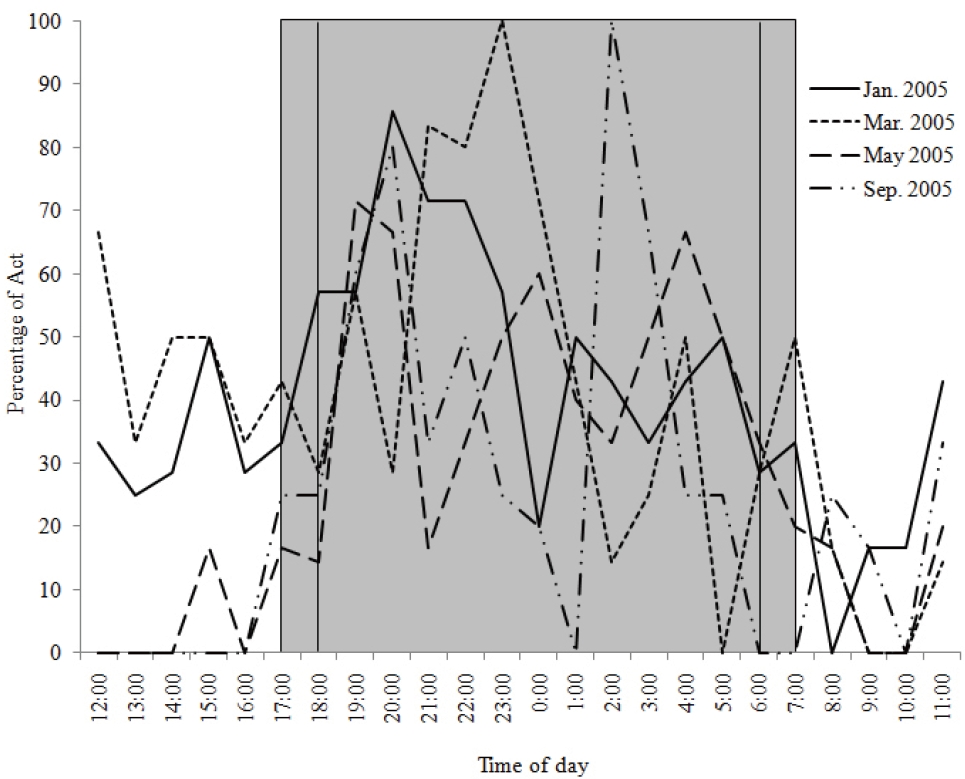
We obtained a total of 495 radio-locations (68.8% of 720 trials) during a total of 720 hours of tracking time, including 141 radio-locations (83.9% of trials) in January, 138 (82.1% of trials) in March, 120 (62.5% of trials) in May and 96 (50.0% of trials) in September. The cat’s activity was recorded as “Active” at 172 locations (34.7%) and “Resting” at 323 (65.3%) locations. The radio-tracked cat was active mostly at night, which comprised 77.0% of “Active” locations in January, 73.0% in March, 85.3% in May and 80.0% in September (Fig. 2). Nighttime was defined as the period from sunset to sunrise, or from 17:00 to 07:00 in January and March and from 18:00 to 0600 in May and September. The proportion of “Active” locations increased after 17:00 and decreased after 08:00 in January and March. In May and September, it increased after 18:00 and began to decrease between 6:00 and 7:00. There were two or three peaks of activity during the night on each tracking-session.
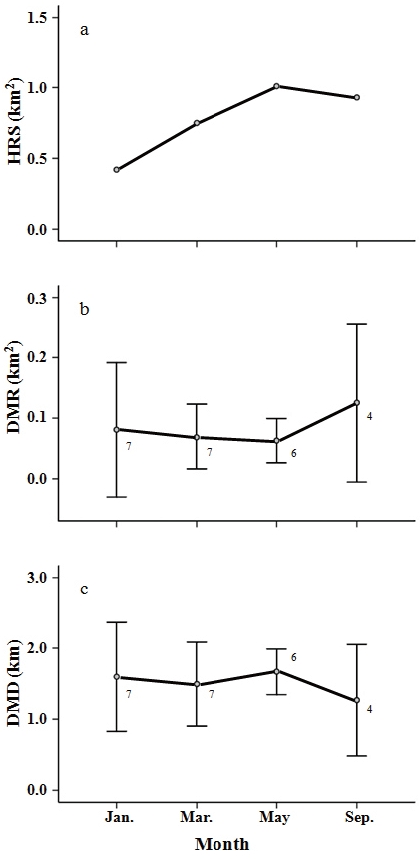
The HRS of the cat averaged 0.78 ± 0.26 km2 (mean ± SD, n = 4 tracking sessions) during the study period. HRS varied among tracking-sessions with the smallest HRS in January (0.42 km2) and the largest HRS in May (1.01 km2) (Fig. 3a). The cat’s HRS was over twice as large in May and September (2.4 times in May, 2.2 times in September) as it was in January. The DMR was 0.08 ±0.11 km2 (mean ± SD, n = 7) in January, 0.07 ± 0.05 km2 (n = 7) in March, 0.06 ± 0.03 km2 (n = 6) in May and 0.13 ± 0.13 km2 (n = 4) in September, and the DMD was 1.60 ± 0.8 km (n = 7) in January, 1.49 ± 0.6 km (n = 7) in March, 1.67 ± 0.3 km (n = 6) in May and 1.27 ± 0.8 km (n = 4) in September. The mean DMR and DMD across all tracking-sessions were 0.08 ± 0.08 km2 (n = 24) and 1.53 ± 0.61 km (n = 24), respectively. Figure 3b and 3c show seasonal variation in DMR and DMD. No significant differences were found among the tracking-sessions for DMR or DMD (Kruskal-Wallis test,
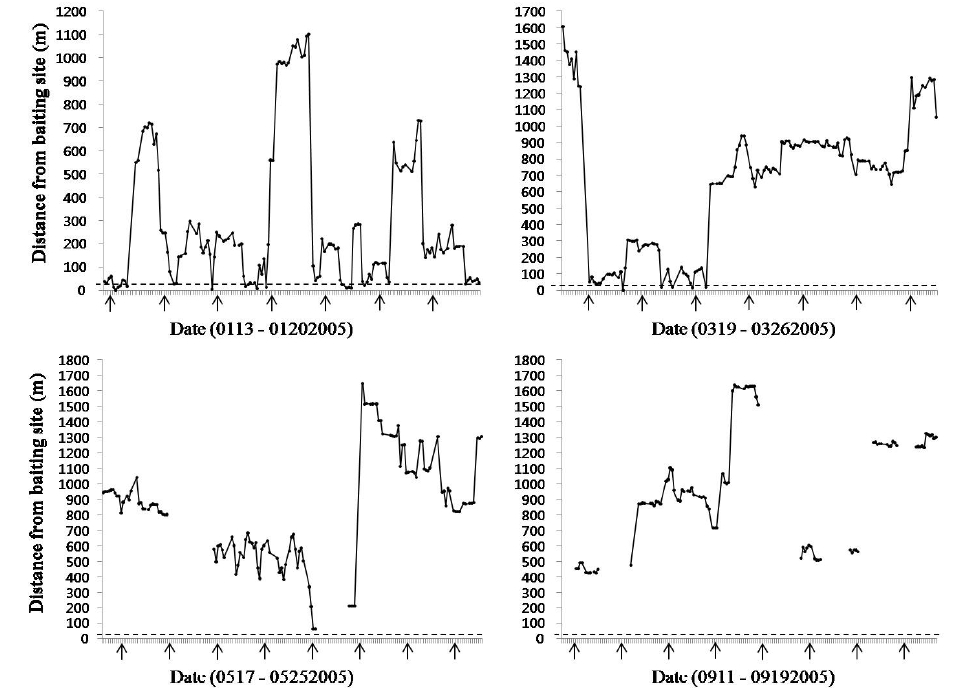
As baiting is expected to heavily influence the cat’s activity, we calculated the distance from the baiting sites to the cat’s location for each tracking session (Fig. 4). There were two baiting sites in the study area: one in the northern part and the other in the southern part. In January, we calculated the distance from the cat’s locations to the southern baiting site, because the cat used only the southern baiting site. On a daily basis, the cat only visited the southern baiting site and usually stayed for a few days near the baiting site. In January, 11% of the cat’s locations were included at the southern baiting site. Ten (66.6%) of the cat’s 15 visits to the baiting site were recorded in the nighttime (17:00-07:00). In March and May, we calculated the distance from the cat’s location to the northern baiting site because the cat only used or passed the northern baiting site during these months. In March, the cat was located in the area of the baiting site during the first four days of the telemetry survey (3.6% of cat’s locations were within the baiting site). After that it did not visit the baiting site during the radio-tracking period. In May, It just passed near to the baiting site at midnight, but the baiting site was never used. In September, neither baiting site was included in its home range. We calculated the distance from the cat to the northern baiting site in September because its home range at that time was closer to the northern baiting site, but the cat never used the baiting site.
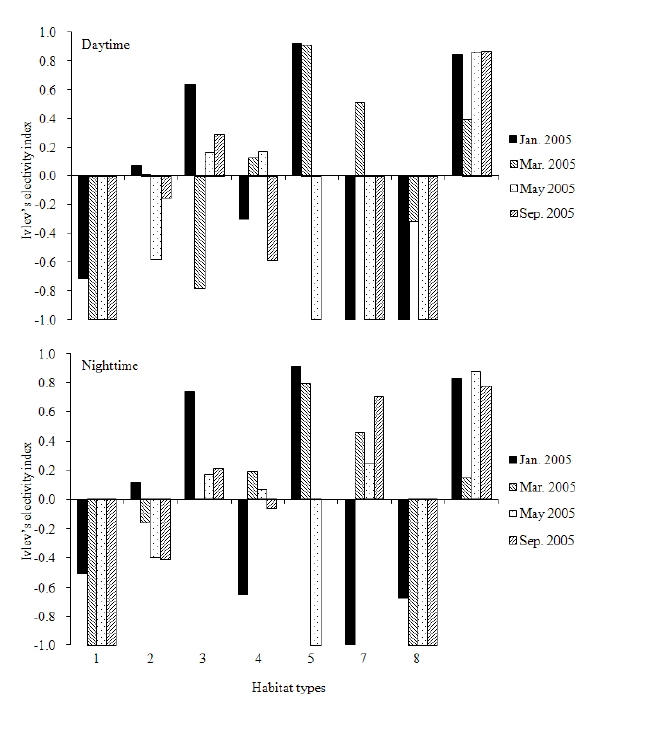
Figure 5 shows the distribution of locations in each tracking-session and the habitat types visited. There is a river in the study area, with a bridge of 4 m width and 70 m length connecting the opposite sides of the river. Figures 6 and 7 show the habitat preferences of the collared leopard cat. Significant differences were found between the expected and observed habitat utilization by the cat during all of the tracking-sessions (χ2 - test, P < 0.001, Fig. 6). Figure 6 suggests that the cat used some habitat types selectively. The Ivlev’s electivity indices for daytime and nighttime habitat use are shown in Fig. 7. The cat avoided (i.e., had a negative preference for) agriculture areas (Ivlev’s Index: daytime < -0.72, nighttime < -0.51) and residential areas (daytime < -0.32, nighttime < -0.67) in all of tracking-sessions. On the other hand, the cat showed weak preference for artificial structures (daytime > 0.39, nighttime > 0.15) during the survey. It showed a strong preference for baiting sites in January (daytime 0.92, nighttime 0.91) and March (daytime 0.91, nighttime 0.79), but avoided them in May(-0.1), and no baiting site was included in its home rangein September. Among the natural habitats, the cat showedstrong preference to deciduous forest in both daytime(0.64) and nighttime (0.74) in January, while it frequentlyused grassland in both daytime and nighttime (0.51, 0.46)in March, and in nighttime in May and September (>0.24).
A radio-collared male leopard cat had a generally nocturnal activity pattern, but it was occasionally active during the daytime. Our results were similar those from previous studies of leopard cats in other region (Thailand; Rabinowitz 1990, Grassman et al. 2005, Iriomote island in Japan; Schmidt et al. 2009), which reported that cat activity patterns were related with those of their prey. The main prey of the Tsushima leopard cat is small mammals (Inoue 1972, Tatara and Doi 1994), and two species of, murids (
The mean home range size (HRS) of the leopard cat from other leopard cats. Previous studies of a male leopard cat on Iriomote island, Okinawa, Japan, reported a HRS of 1.24 ± 0.41(Nakanishi et al. 2005) and 2.96 ± 1.80 km2 (Izawa et al. 1991), and the HRS of a male Tsushima leopard cat living in a mountainous area was 8.05 ± 2.10 km2 (Mean ± SD, n = 9 tracking-sessions, Moteki unpublished). The cat monitored in this study (N2) had a significantly lower HRS than a male cat in a mountainous area (
Riley (2006) reported that the mean home range sizes and core areas for bobcats in a rural zone were larger than those in a developed area and that small home ranges are likely related to high-quality habitat. Indeed, smaller home ranges must provide the requisite resources to sustain individual bobcats. At our study site, people have baited leopard cats at two sites in the study area since 1993. This artificial food enrichment food may lead to reduced HRS for cats in the local area.
The daily movement distances (DMD) do not reflect the actual distance moved, because DMD may be somewhat underestimated in studies of radio-tracked animals (Jedrzejewski et al. 2002, Schmidt et al. 2009). However, it is possible to make general comparisons with other individuals of the same species. The mean DMD in this study was somewhat smaller than that of another leopard cat on Iriomote, which had a DMD of 3.24 ± 1.02 km (n = 5, Schmidt et al. 2009) and also smaller than that of a Tsushima leopard cat in a mountainous area (3.24 ± 1.04 km, n = 9, Moteki unpublished). The studied cat travelled for a shorter time while hunting and appeared to take longer breaks for consuming prey, perhaps because of an abundance of prey resulting from artificial baiting prey as well as natural prey in the study site. Thus, the daily movement range was also smaller.
In general, the spatial organization of male carnivores, including felids, is influenced by two factors, food during the non-breeding season and fertile females during the breeding season. In the breeding season, males occupy larger areas than in the non-breeding season, probably to maximize their access to females (Sandell 1989, Sunquist and Sunquist 2002). The breeding season of the Tsushima leopard cat is from winter to early spring (Maekawa 1998, Ueno 2004, Moteki unpublished). Accordingly, male leopard cats in the Tsushima Islands show seasonal variation in their HRS, with larger home ranges in winter (Izawa et al. 2009). The other subspecies of leopard cat in Japan, the Iriomote cat, is also reported to display seasonal variation on HRS (Nakanishi 2005, Izawa et al. 2009). The leopard cat observed in this study, however, showed an unusual pattern of seasonal variation in HRS, and did not extend its home range in winter. This may be due to influence of two factors. In winter, possibly due to a decrease in natural food resources, the radio-collared cat showed extreme dependence on the baiting food resources. As a result, the activity of the cat was concentrated around the baiting area, resulting in a decrease in overall home range size. As the season changed, and natural food resources started to increase, the cat spent less time around the baiting area and widened its home range, and by summer, it had recovered its original home range size, providing evidence that leopard cat home range sizes on Tsushima are largely determined by their dependence on baiting food resource. In addition, the smaller winter home range of the cat that we observed may have been the result of the breeding activity of older neighboring male cats. Increasing the size of the home range in the breeding season may crucial to the breeding success of adult males, and high levels of competition and conflict may occur during this process. The cat that we tracked was a young adult during this study, according to age estimates from tooth cementum annuli (Nakanishi et al. unpublished) determined after the cat’s death. C onsidering the rarity of home range overlap for neighbors of the same sex (Sunquist and Sunquist 2002), it is possible that the cat in our study may have been driven out of parts of its original home range by neighboring adult male cats. This may have caused a reduction in the home range size of the cat in the winter relative to its home range size in spring and summer.
The Tsushima leopard cat generally prefers natural habitats dominated by deciduous or coniferous forest, as well as grasslands and agricultural areas in their ranges (Izawa et al. 1991, Tajiri et al. 1996, Watanabe et al. 2003a). The cat that we studied showed a strong preference for artificial structures and baiting sites, but avoided residential areas. Shrines and graveyards might have provided good resting spaces for this cat. Small habitat remnants on private land and in green-space areas (i.e. parks, gardens and golf courses) can potentially provide refuge for wildlife threatened by urbanization (Hodgkison 2007). The cat that we studied may have used human-made structures as places of refuge from bad weather during the surveying periods. In January, the cat approached the baiting site every day, suggesting that its ranging behavior was strong influenced by artificial baiting when the density of its main prey, small mammals, was low in winter (Moteki unpublished). As the density of small mammals increased in the March, the HRS of the cat got larger and the frequency of baiting site use decreased. The cat never used the baiting sites in May and September. In short, while the density of its main prey was low, the cat tended to rely heavily on artificial prey and to have small HRS. As density of small mammals increased, it preferred natural prey and its HRS expanded. Baiting sites are clearly attractive to leopard cats in the study site. We observed other cats in the northern baiting site during the survey periods, and the northern baiting site was used by a female leopard cat during the nursing season in May and June of 2001 (Doi et al. 2005). Home range of female felids should be determined by the availability of food for their kittens and themselves (Sunquist and Sunquist 2002). Therefore, the ebaiting site may have been an important resource for female leopard cats and their kittens as this site.
The radio-collared leopard cat seldom approached the residential and agricultural areas in day or night during the study periods. Leopard cats are sensitive to human presence or disturbance, but they do occasionally come into villages. The cat that we observed in this study was captured by a human when it attacked domestic fowl in a village coop, so this cat may have learned to avoid humans and their activities. Riley et al. (2003) reported that large carnivores can come into conflict with humans and their domestic animals, and more-specialized species may not benefit from human-associated foods such as ornamental fruit or garbage. The scats of another native felid in Japan, the Iriomote leopard cat, did not contain artifacts from garbage (Watanabe et al. 1993b), suggesting that it did not take advantage of human garbage as a food source. Interspecific competition with domestic cats may also cause leopard cats to avoid villages, but we have no data about domestic cats that would allow us to evaluate their influence on leopard cats in the study area. Although leopard cats in some areas prefer agricultural areas (Izawa et al 1991, Watanabe et al. 2003a), the cat that we observed in this study avoided agricultural areas, perhaps because it would have had to cross the village and road to gain access to agricultural land.