To perform the mission successfully during the lifetime, the satellite must be provided with sufficient power until its end-of-life (EOL). A number of critical issues arise when a satellite is designed to be big enough to secure sufficient power, such as the thermal control design, the satellite mass budget, the selection of a launch vehicle, orbit maintenance and cost, etc. Therefore, it is important for the electrical power system (EPS) to be designed with minimum power sizing in order to secure the energy balance according to the system’s requirements (Patel 2005). For the optimization of the system architecture, the component choices, and the system performance in terms of efficiency, power density, cost, and lifetime, it is essential to perform simulation studies such as EASY5 (Cho & Lee 1988, Lee et al. 1988), EPSIM (Ayres et al. 2000), and PowerCap (Capel et al. 2002), and to build virtual prototypes (Jiang et al. 2003) in most cases due to the high manufacturing cost and complexity of satellite EPS.
This paper describes the basic concept of peak power tracking (PPT) algorithms, and the results of simulation and electrical test to verify the performance of PPT. Its operation is tested using the electrical test bed (ETB) to verify the algorithm. During the PPT test, it shows the performance of the maximum power tracking of SA and the switching characteristic of the main converter. The switching characteristic depends on the main bus voltage of the spacecraft, so the main bus voltage is analyzed with the terminal voltage of the battery, the voltage drop caused by the harness and electronic device in the spacecraft bus, and the battery modeling (Zimmerman & Peterson 1970, Lim & Hamill 2001, Siri & Conner 2004). In addition, this paper considers the power dissipation of major electrical components, the performance of SA, and the trend analysis of battery behavior during lifetime in orbit.
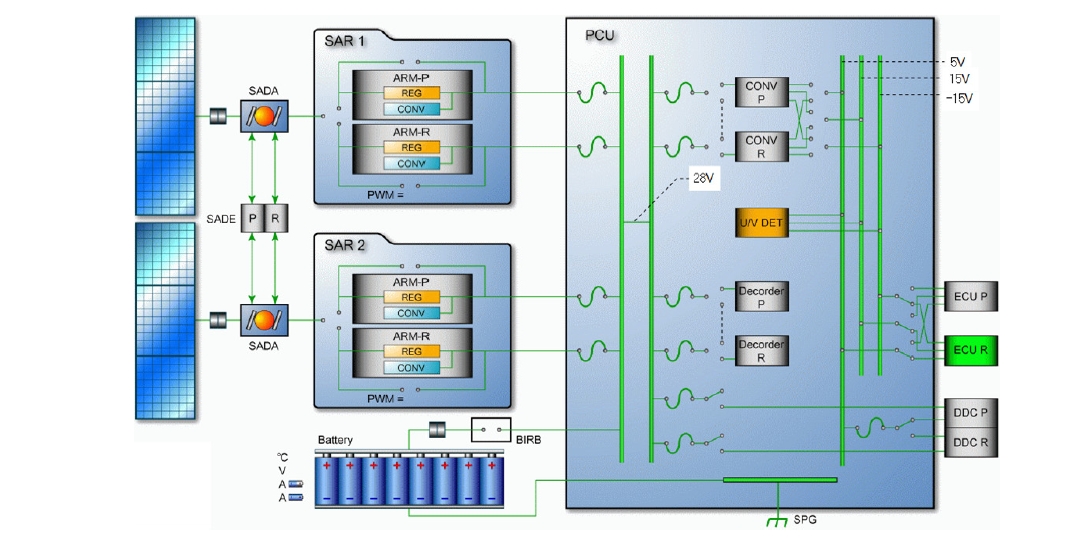
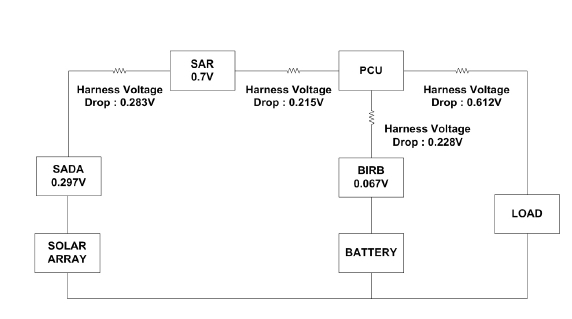
The EPS provides solar energy, electrical energy conversion and storage, voltage conversion, and power control and distribution. The SA supplies the power required to recharge the battery and maintain the energy balance in each orbit at the EOL. The rechargeable battery can supply the steady state and transient electrical power to the spacecraft loads and instruments through all of the various injection or operational modes. It provides the control circuits and driving motors to give a single axis pointing control for the solar array (SA). It develops and conditions the telemetry measurements for the selected power system monitoring points. The EPS provides a redundant control of all deployment release circuits. It also provides the direct current (DC) wiring harnesses for electrically interconnecting the spacecraft and instrumental equipment. The EPS functional block diagram is shown in Fig. 1.
The SA generates electrical power during periods of solar illumination throughout the operational life of the spacecraft, and delivers sufficient power to supply the normal spacecraft bus and payloads. The SA is comprised of two identical deployable wings. Each wing is composed of three panels, and each panel has 16 strings, with 23 cells per string. The battery provides electrical energy to the satellite during the launch phase, the eclipse periods, and the periods of peak power demand that exceed the capability of SA output. The battery is composed of 37 ampere-hour super nickel-cadmium battery cell with 22 series connection.
The SA regulator (SAR) converts the power from the spacecraft SA to the battery-clamped primary DC power bus. The SAR contains two array regulator modules, of which one is operational and the other is in standby. The power control unit (PCU) receives the primary power from the SAR during the sunlight portion of the orbit or from the battery during the eclipse, and creates a primary power bus. The primary bus power is used for battery charging and providing the power to the spacecraft loads,
and the low voltage converter in PCU is supplied from the main power bus.
3. THE ENERGY BALANCE FOR THE SATELLITE IN LEO
In this paper, a 685?km altitude sun-synchronous orbit is used for the satellite in low- earth-orbit (LEO). Before anything else, to perform power analysis, some assumptions were made for all local-time-ascending-node (LTAN) with the roll maneuver to consider worst-case conditions.
The assumptions are SA degradation at EOL, summer solstice intensity, one shorted cell in battery, SA high temperature, spacecraft load profile with payload operation, SA offpoint angle, SA shadow presented during suntime, and SA clamped to battery voltage after eclipse.
3.2 Considered input data for power analysis
This paper considers only the power analysis in normal operation. In the satellite power analysis, of course, all environmental conditions which can affect the SA power should be considered. Accordingly, all factors affecting the generating output power, including the load profile, the SA temperature, the SA offpoint angle, and the SA shadowing effect, will be discussed. Furthermore, the margin factors are included in the energy balance analysis program for the worst-case conditions.
3.2.1 Satellite load profile
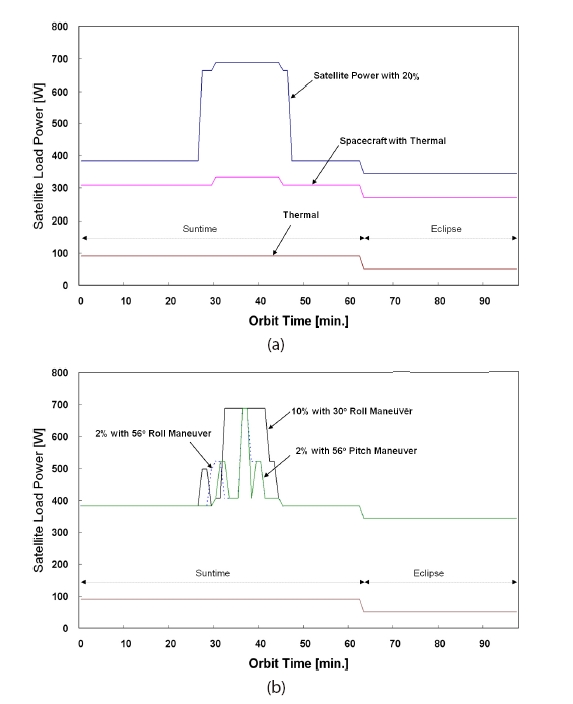
Fig. 2a shows the satellite load profile including the delta attitude slew power during 20% normal mission. The satellite has about 380 W with spacecraft and thermal power during sunlight (orbit time: 0 to 65 minutes), and it will reach maximum 690 W during the payload operation. In addition, it has average 340 W during eclipse (orbit time: 65 to 98 minutes). Fig. 2b is the satellite load profile during 10% mission with 30° roll maneuver, 2% mission with 56° roll maneuver, and 2% mission with 30° pitch maneuver in normal operation, respectively. Added attitude slew power is needed to drive the reaction wheel in roll and pitch maneuver. The maximum satellite load power will be around 690 W during the payload operation.
3.2.2 SA temperature
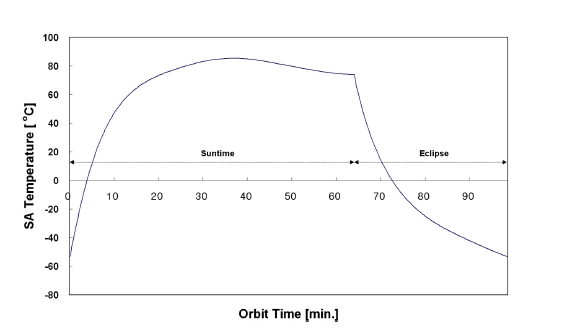
The SA temperature is considered in the power analysis (Rauschenbach 1980). The temperature margin uncertainty is added to the temperature data of thermal engineering to consider the worst-case conditions. Fig. 3 presents the SA worst-case hot temperature profile with the temperature margin uncertainty added during the orbit suntime at EOL. When the satellite exits the previous eclipse, the SA temperature will be a lower than minus 55℃, and then will be increased dramatically up to a maximum of 80℃ during suntime. Before next eclipse, the expected temperature will be between 75℃ to 80℃, and then will be decreased rapidly during eclipse.
3.2.3 SA shadowing effect
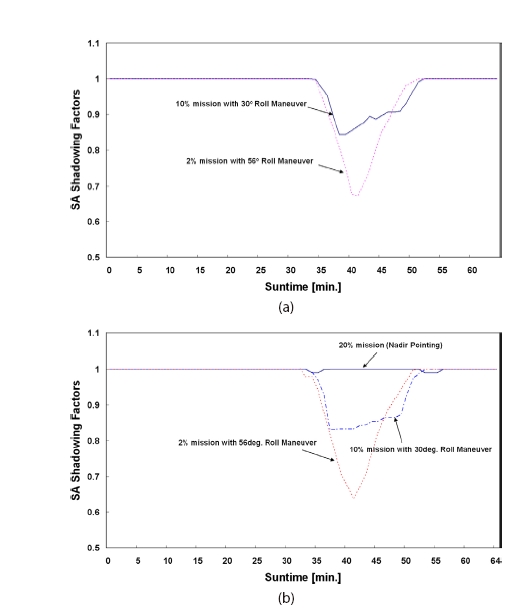
The shadowing effect has been analyzed in the SA as a function of orbit suntime (Rauschenbach 1980). In the power analysis with worst-case conditions, even though the SA string is partially shadowed, the SA string cannot produce the electrical power. Fig. 4 shows the SA shadowing effect at 10:35 AM and 10:50 AM crossing times, which is the ratio of the number of shadowed SA strings to the total number of SA strings. During 56° roll maneuver, the SA Shadowing Factors will be expected to have a maximum of 0.7, and the SA can lose around 30% power capability of SA at the moment. The pattern of SA shadowing in 10:35 AM is more severe than that of 10:50 AM.
3.2.4 SA offpoint angle
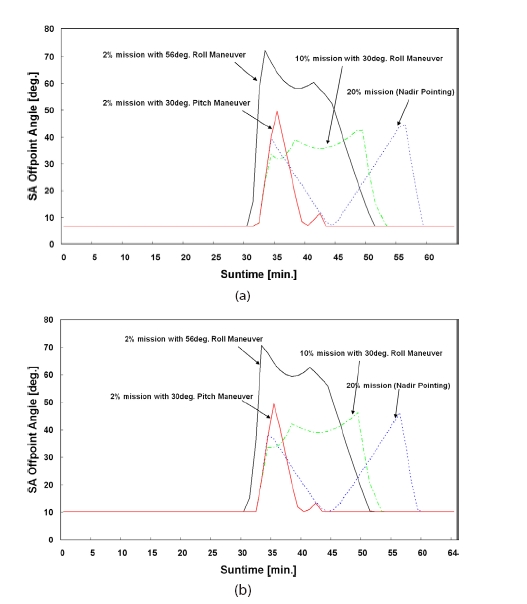
In the roll maneuver operation, the system engineering has considered each roll angle case at each crossing
time. In the zero roll operation at 10:35 AM crossing time, a worst case of pitch-axis error and the computed value of equivalent yaw error as the difference between the real and nominal β-angle occurring at summer solstice were calculated as SA offpoint angle. The difference between the actual β-angle and the nominal -angle provides the second orthogonal component of the SA offpoint angle. Fig. 5a shows the SA offpoint angle as a function of orbit suntime with respect to the satellite operation at 10:50 AM. In the 56° roll maneuver for 2% payload operation, the SA offpoint angle is greater than 70° at the moment, and will settle down to normal offpoint angle around 6.7° The SA power will be lost according to the SA offpoint angle. Fig. 5b shows the SA offpoint angle at 10:35 AM, which shows a worse profile than that of 10:50 AM.
To consider the terminal voltage of the battery in the energy balance, the voltage drop should be predicted according to the harness and electrical components. Using the terminal voltage of battery, the battery charging and discharging current can be calculated to simulate the energy status of battery and the energy balance in the EPS
(Scott 1979).
Fig. 6 shows the voltage drop model in the bus system during charging mode. A simplified impedance model is used to analyze the battery terminal voltage. When the terminal voltage of the battery is known, it is possible to predict the behavior of the battery.
3.4 PPT efficiency and operation characteristic
The PPT algorithm is used to extract the maximum SA power for the satellite-load and high-rate battery charging power. The use of the PPT algorithm results in the optimal sizing of EPS to successfully support the satellite mission.
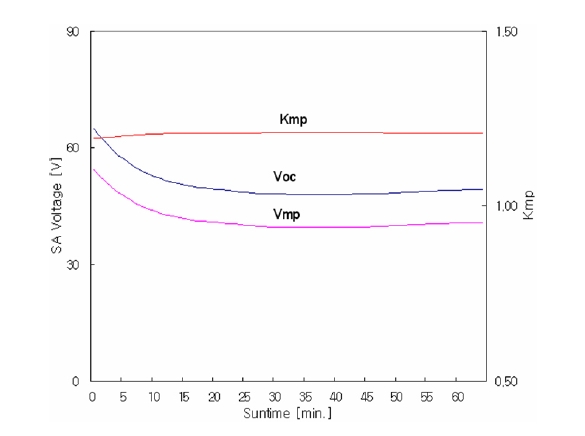
In Fig. 1, the SAR consists of a buck regulator controlled as the pulse-width-modulation (PWM) duty cycles (D) by processor commands. With this architecture, the PPT algorithm is operated to track the maximum SA power. The calculation of PWM duty cycles for PPT is based on the transfer function of a buck-converter. General buck-converter output voltage (Vout) has a linear relation to the PWM duty cycles (D) and the input voltage (Vin). The buck-converter is directly connected to the SA, as shown in Fig. 1. The transfer function characteristic of a buck-converter is combined with the SA operation characteristic curve. The SA has specific I-V characteristic curve with illumination, temperature, and degradation. As temperature increases, the SA open-voltage (Voc) decreases dramatically, but SA short-circuit current (Isc) does not change significantly. Fig. 7 shows the ratio (Kmp) of open-circuit voltage (Voc) and peak-power voltage (Vmp) during the suntime orbit, which is almost constant. The SAR transfer function is provided in Eq. (1):
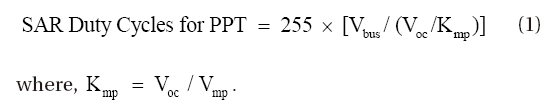
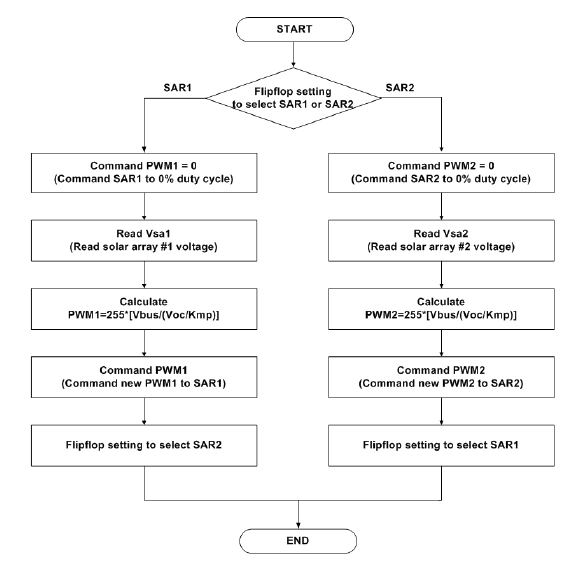
The Kmp for the maximum SA power varies from the beginning-of-life (BOL) to the EOL, and the calculated PWM duty cycles with Kmp for SAR operation will be used to track the SA peak power region. To calculate PWM duty cycles for SAR operation in order to track peak power of the SA, there are several steps in the PPT algorithm, as shown in Fig. 8. The PPT algorithm alternately switches to calculate and command PWM1 for SAR1 or PWM2 for SAR2. If SAR1 is selected, the PWM1 for the SAR1 is commanded to zero to read the SA open voltage. Then, a new PWM1 is calculated with the main bus voltage and Kmp. The operational SAR1 is commanded to the new PWM1 value, and the flip-flop is set to perform the procedure
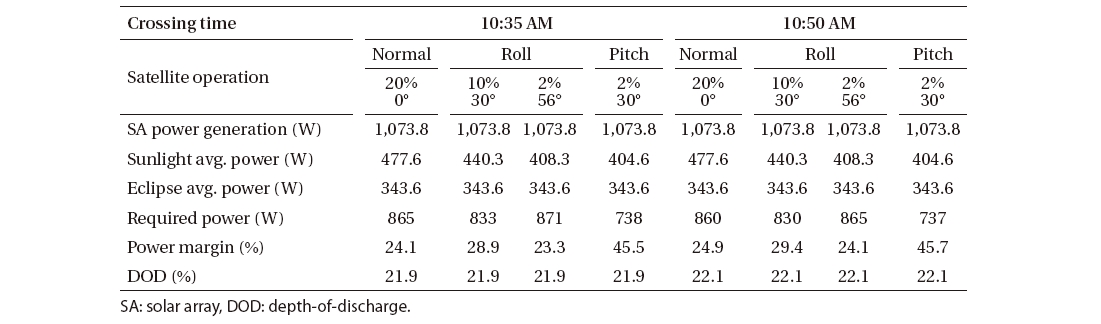
[Table 1] Energy balance analysis results.

Energy balance analysis results.
for SAR2.
The PPT algorithm to find the maximum SA power using Eq. (1) is guaranteed in the range of normal charging battery voltage. In the lower voltage of battery caused by some faults, the PPT algorithms cannot find the SA peak power efficiently. But an extended region of lower battery voltage should in theory be prevented by the satellite power design.
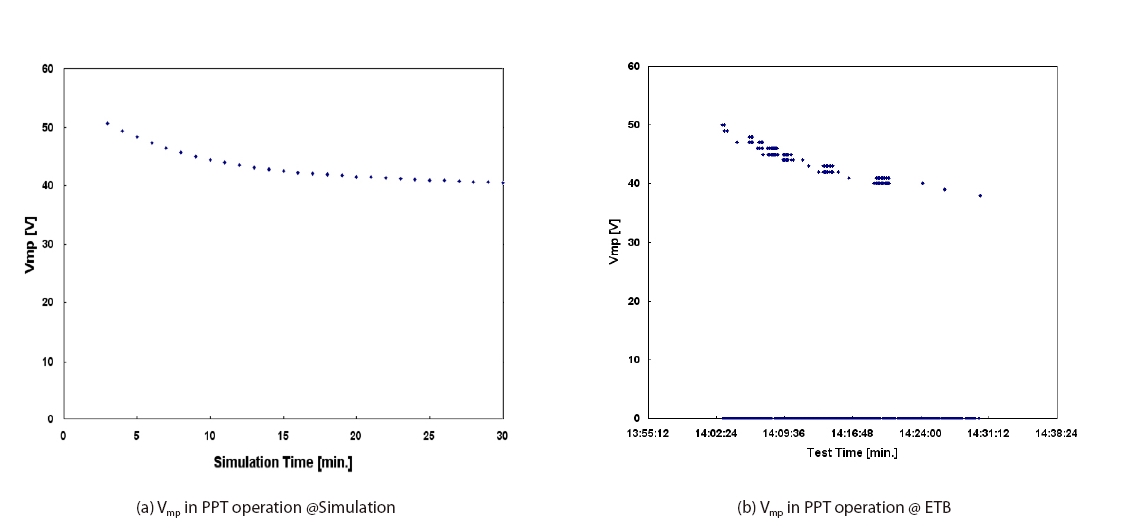
Fig. 9a shows the maximum SA power voltage (Vmp) in PPT mode simulation using the EOL solar cell characteristic in orbit. The PPT constant value for EOL power simulation is applied to track the maximum SA power. After eclipse, Vmp reached about 50 V, and is decreased until it reaches around 40 V in PPT operation mode during sunlight. Fig. 9b is the test data of the maximum SA power voltage (Vmp) for PPT operation in ETB, which shows that the PPT is working in 50 V to 40 V according to the SA performance in sunlight.
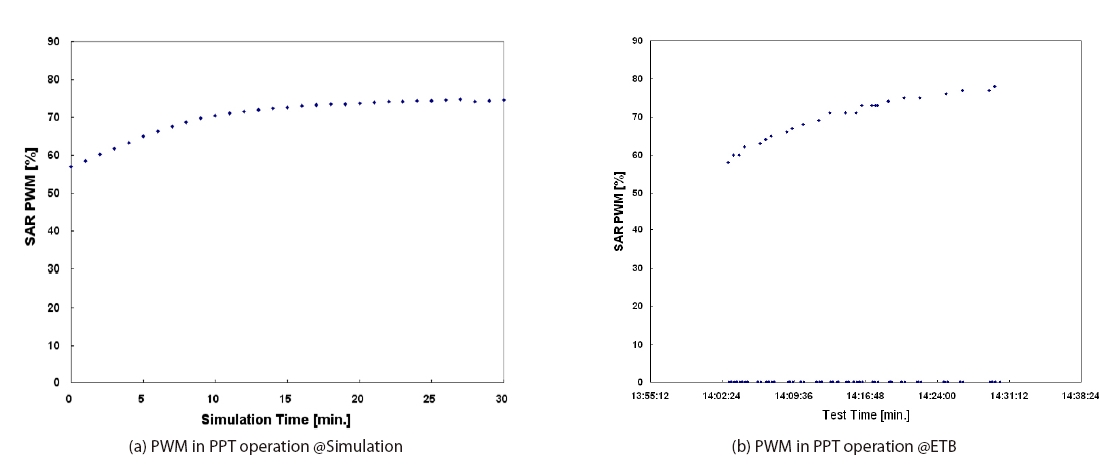
In PPT operation mode, the SAR PWM duty cycle is analyzed using the power simulation. Fig. 10a shows the simulation result of SAR switching in PPT operation mode. After eclipse, PWM is operated at 57.6% to track the maximum power, and is increased until it reaches 75.1% at higher SA temperature. Fig. 10b shows the ETB test results for SAR operation.
4. THE DESIGN RESULTS OF ENERGY BALANCE
A positive SA power margin exists for all satellite operation cases that were analyzed. Table 1 summarizes the EPS energy balance analysis results in each crossing time with roll maneuver. As shown in Table 1, the power margin is positive, and battery depth-of-discharge (DOD) is acceptable in all cases. Minimum power margin of 23.3% occurs at 10:35 AM crossing time with the largest roll maneuver, and battery DOD range of 21.9% to 22.1% occurs for all roll maneuver cases. The maximum battery DOD is 33% for Korean ground station pass during eclipse with LTAN of 11:00 AM. The battery will have more than 81% cycle life margin with a 33% DOD (Larson & Wertz 1995).
4.2 Power performance analysis
4.2.1 Power simulation results in orbit
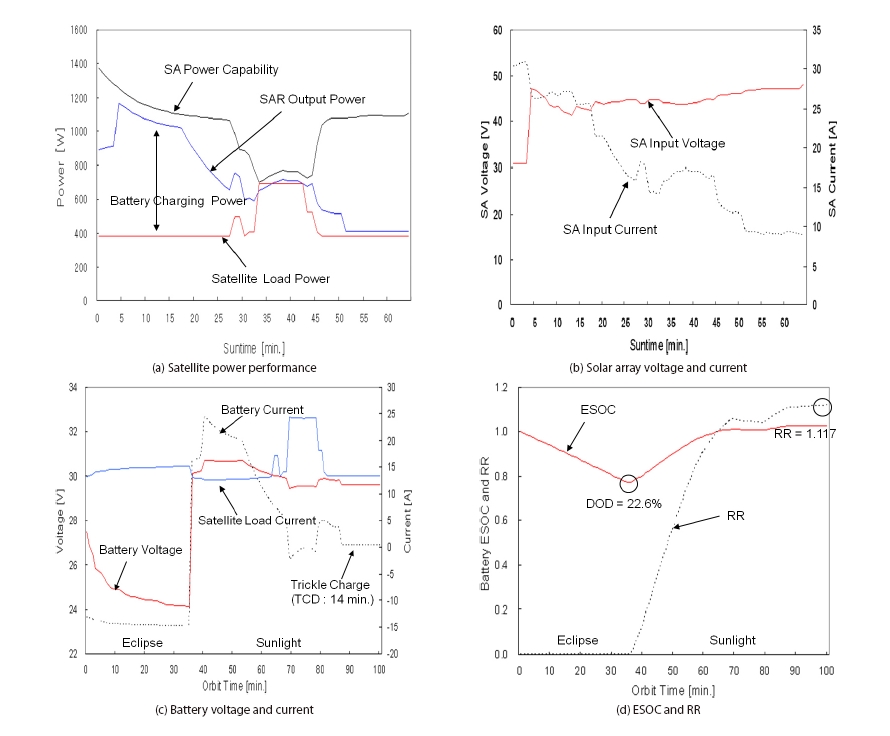
Fig. 11 shows the simulation results of the satellite mission with 30° roll maneuver at EOL. It presents the satellite power profiles in timeline, the SA and battery performance of 10% mission with 30° roll maneuver operation in normal operation with largest roll and shadow at 10:35 AM crossing time. The battery may be discharged during the roll maneuver, because Fig. 11 uses the minimum value of SA power needed to achieve energy balance in one orbit. The actual SA predicted power capability in orbit at EOL is larger than the required power. If this power is produced, even in the worst-case orbit, the discharging current in the battery will not occur.
In PPT operation, the peak voltage of SA is around 47 V. As it is in EPS operation mode, the SA input voltage operating point will be adjusted to supply the appropriate power of the satellite load. If the battery is fully charged, the SA input voltage is slightly increased to reduce the SA power generation. In the eclipse, the battery voltage will be decreased to less than 25 V, but it will reach max 32 V in charging mode. The maximum charging current is approximately 25 A in PPT operation. The battery may be discharged for payload operation in sunlight, but it will reach fully charged status before next eclipse. The trickle charge duration (TCD) can be assured before eclipse entrance, at least 14 minutes in worst-case at EOL.
The battery DOD in previous orbit is 22.6%, but the battery will be fully recharged in the next sunlight and the recharge ratio (RR) will reach 1.117 before next eclipse entrance.
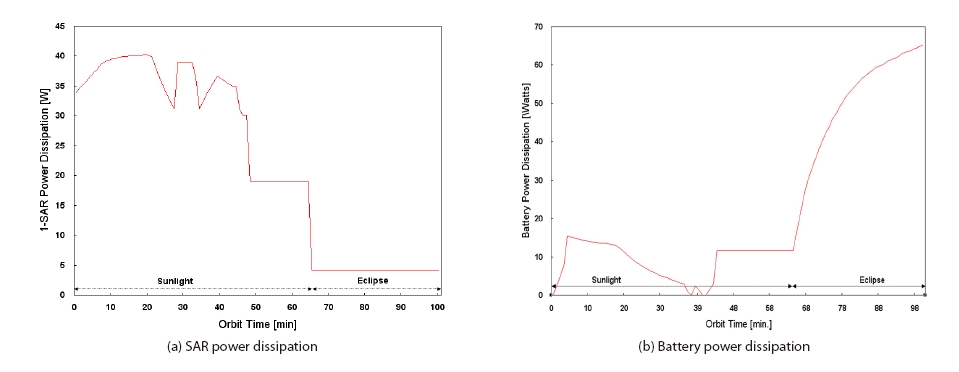
Fig. 12 represents the power dissipation of major EPS components during the satellite mission. All components should be adjusted to dissipate the internal heat and to operate in dedicated temperature range in the design stage. During 20% payload operation at EOL, the EPS components will dissipate the maximum power due to the operation and standby power losses. In particular, the SAR will generate maximum 32.1 W of power loss during the SA power conversion in sunlight, and it will be dissipated through baseplate of SAR. The power dissipation profile of the SAR is shown in the Fig. 12a.
Fig. 12b represents the battery power dissipation during the normal operation at EOL. If the battery reaches around 80% of Estimated-State-of-Charge, it will start to dissipate power due to the internal chemical reaction in charging mode. During eclipse, it will dissipate the power continuously, and will reach maximum 65 W at the end of eclipse in normal operation. The battery is designed to maintain avg. 10℃ in orbit.
4.2.2 EPS performance trend analysis in orbit
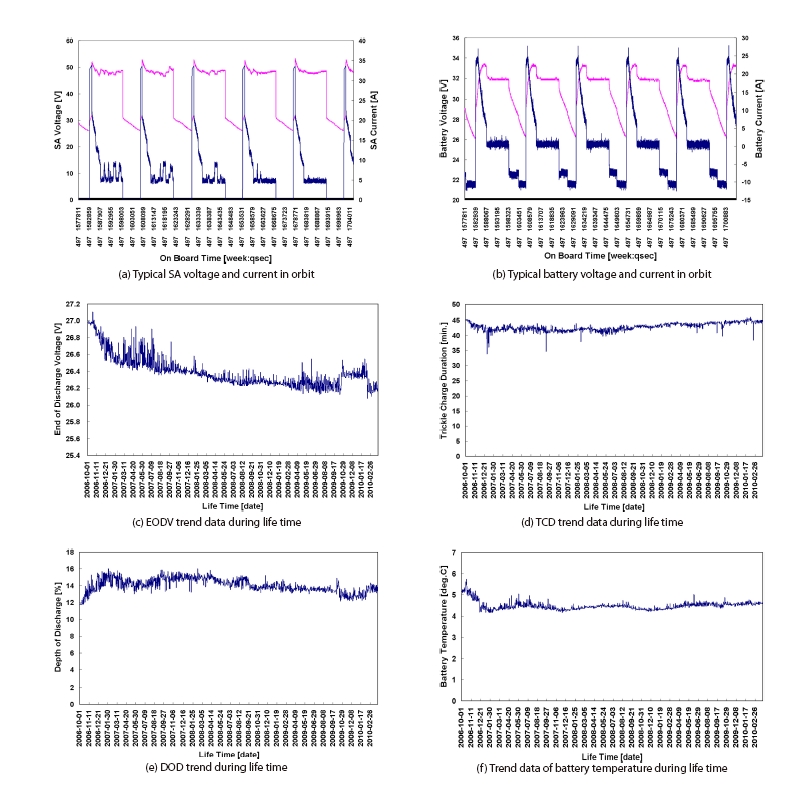
Fig. 13 shows the power performance in real orbit. In
normal operation, the SA generates enough power to meet the demand of loads and battery charging. After the eclipse, the maximum voltage of SA is operated around 60 V, which then will be reduced and operated about 42 V according to the power operation. The battery voltage is charged until around 33 V in the high-rate charging, and then will be stabilized around 32 V.
During the lifetime, the end of discharge voltage (EODV) is operated at min 26 V, as shown in Fig. 13c. Each cell of the battery is discharged to minimum 1.18 V. The TCD is assured a minimum 40 minutes to charge the battery before next eclipse, as shown in Fig. 13d. And the battery is depleted by a maximum of 16%, and will be kept within 6℃ in normal operation, as shown in Figs. 13e and 13f, respectively.
This paper summarizes the power required to achieve the energy balance for Korean LEO satellite according to 10:35 AM and 10:50 AM LTAN. For the energy balance analysis, all kinds of design factors are described and analyzed to be considered in the simulation. With PPT operation mode, the extent to which the peak power of SA can be tracked through the power simulation and electrical test with ETB is described. In addition, this paper shows the power simulation results to verify the SA performance and battery behavior in orbit, considering the satellite operation with 30° roll maneuver. Typically, before the satellite goes to the following eclipse, the battery is fully charged in the predefined energy level during sunlight to recharge the depleted energy in the previous eclipse.
In real satellite operation, the power system is operated with a good power margin in normal condition during lifetime. The EODV is working in the range of 26 V, and the TCD is greater than 41 minutes. The battery is depleted by an average of 14% in the eclipse normally, and the operating temperature of battery is maintained within 6℃. Based on the satellite telemetry in real operation, the power system is working in a good condition of health to successfully support the satellite mission.