The purpose of the Near Earth Space Survey (NESS) project is the observational study of the near earth objects (NEO) and the satellite tracking test. The NEOs are divided into the near earth asteroids (NEA) and the near earth comets of which perihelion distance is less than 1.3 A.U. Since these NEOs have the potential to collide with the earth, they should be observed continuously and systematically. In addition, the optical tracking is carried out to monitor the foreign satellites, the disposed satellites and the satellites passing through the airspace of the country. Several developed countries operate the omnidirectional surveillance system by means of the optical and Infrared observation instruments, the radar network and the space surveillance satellites.
Korea Astronomy and Space Science Institute (KASI), collaborating with the Yonsei University Observatory, has established and operated an observatory in the Republic of South Africa in 2002 and the other one in Australia in 2005, with the goal of all-sky survey. These observatories are operated by an unmanned automatic observation system composed of the automatic observation system, the automatic observatory operation system, the meteorological observation instrument, global positioning system (GPS) receiver, the all-sky monitoring camera, and the security camera, etc (Yuk et al. 2004). In addition, to perform the satellite tracking test, the test observatories have been established and operated in KASI and Chungbuk National University Observatory (Jincheon, Korea). The telescopes operated in these observatories are exclusively for the exploration, having wide-field and high-speed mount.
These exploration exclusive telescopes are fabricated with a small F number to secure a wide field. The fabrication or measurement of the telescope with a small F number is a hard technology which has not been much studied yet in Korea. To find the possibility of fabricating the telescope with a small F number in Korea, we have started the correction of the optical system in collaboration with the Korea Research Institute of Standards and Science (KRISS), taking advantage of the abnormality in the telescope optical system in the observatory in Australia.
The Section 2 introduces the characteristics and problems of the telescope. The measurement, fabrication, test observation and the problems of the primary mirror are described in the Section 3. The Section 4 addresses the measurement, fabrication and test observation of the secondary mirror. The Section 5 shows the results of the performance improvement of the telescope optical system.
2. THE CHARACTERISTICS AND PROBLEMS OF THE TELESCOPE OPTICAL SYSTEM
2.1 Characteristics of the optical system
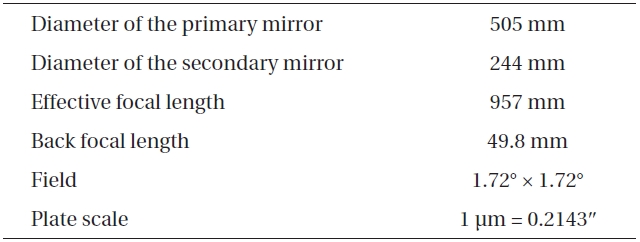
[Table 1.] The characteristics of the NESS Australian Observatory telescope.

The characteristics of the NESS Australian Observatory telescope.
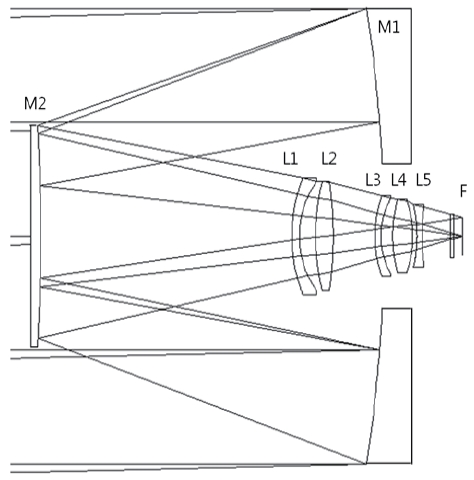
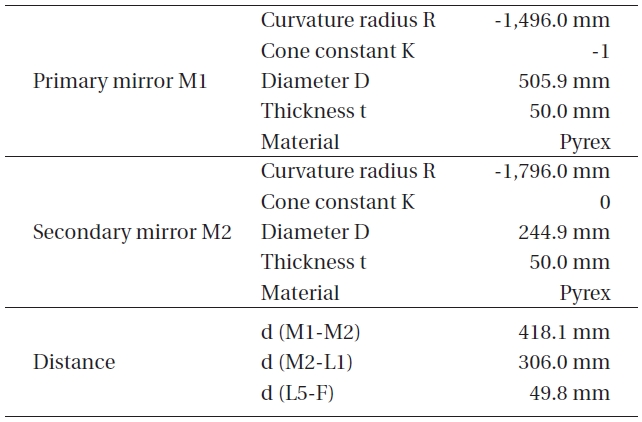
The wide-field telescope No. 2 (NESS-2) installed at the observatory in Australia was produced by Torus Technologies, U.S., together with the wide-field telescope No. 1 (NESS-1) at the observatory in the Republic of South Africa. As shown in Table 1, the diameter of the primary mirror of the optical system of the NESS-2 is 505 mm, the secondary mirror diameter 244 mm. The telescope is the hybrid Cassegrain type with the focal ratio of f/1.9. The telescope adopted the correction lens group composed of 5 lenses to correct the image distortion caused by the wide field (1.72° × 1.72°) and the structure is shown in Fig. 1. The detailed specifications of the NESS-2 are show in Table 2.
The NESS-2 was fabricated to have a small focal ratio to secure a wide range of field but to have a large secondary mirror to secure the back focal length. As a result, the secondary mirror obstruction ratio is about 25% which is very high. In addition, since the focal ratio is small, the image quality is very sensitive to the alignment of optical axis.
[Table 2.] The specifications of the NESS Australian Observatory telescope.
The specifications of the NESS Australian Observatory telescope.
2.2 Problems of the optical system
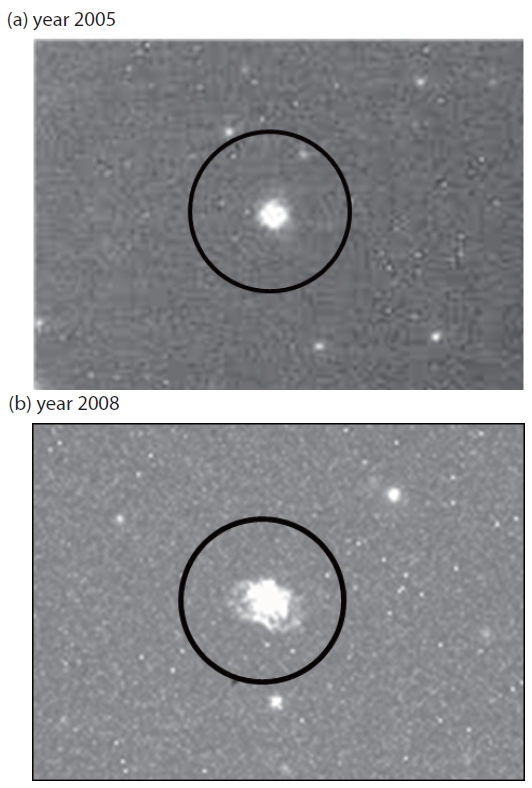
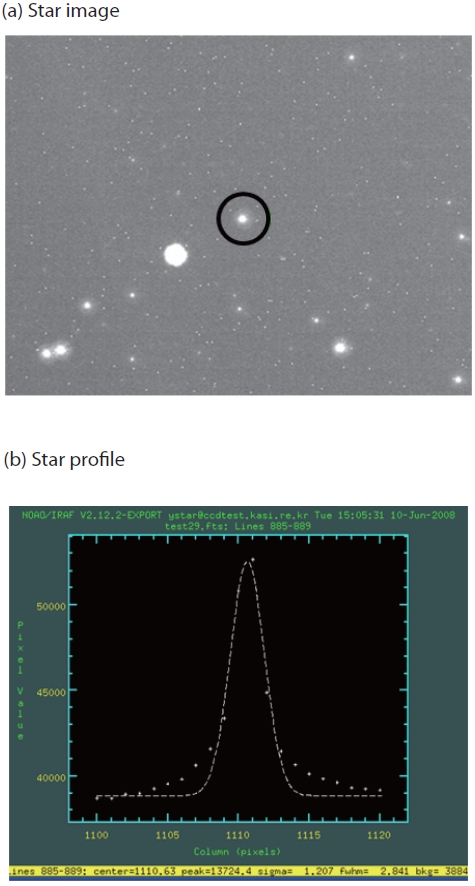
The wide-field telescope No. 2 at the observatory in Australia in 2005 was established at the observatory after the correction of the primary mirror and sufficient test at the Cheonan observatory of Yonsei University (Fig. 2a). However, after 3 years, the observed star image became irregular as in Fig. 2b, the point spread function (PSF) did not follow the Gaussian function, and the star full width half maximum (FWHM) was 43.5 μm. Assuming that the cause was in the optical system, we transported the optical system to Korea in January 2008 for the precise measurement and correction.
3. IMPROVEMENT OF THE PRIMARY MIRROR PERFORMANCE
3.1 Measurement of the primary mirror
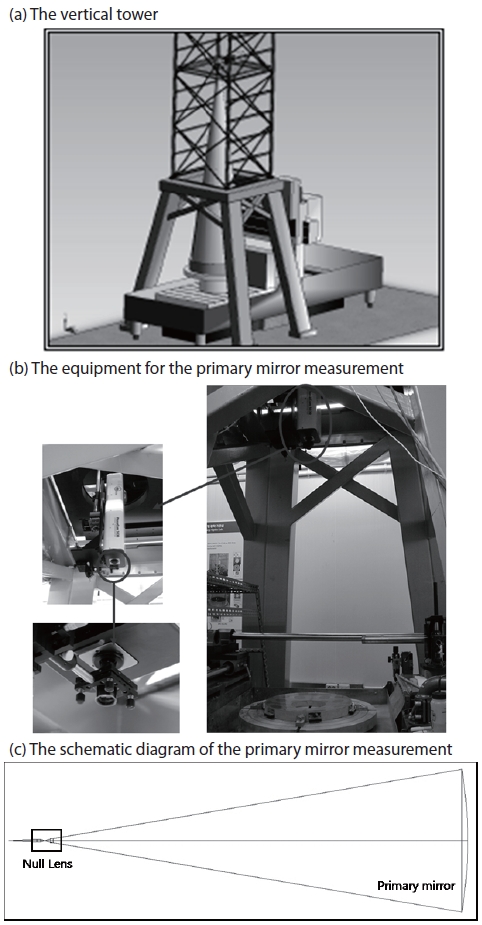
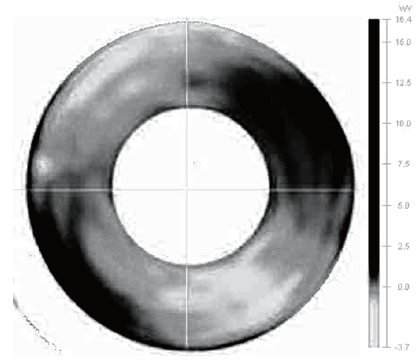
The primary mirror was measured by using the autostigmatic null lens optical system and the vibration-free interferometer at the vertical tower at KRISS (Fig. 3) (Lee et al. 2006). The autostigmatic null lens optical system adopted the refractive Offner compensator (Malacara 1992). The primary mirror measurement results showed that the surface figure error had the root mean square (RMS) 0.651 λ, and the spherical aberration and the astigmatism were dominant (Fig. 4).
The surface figure error numerical simulation results obtained by applying the measurement results to CODE V showed that the primary mirror should be fabricated to reduce the surface figure error below RMS λ/10 to obtain the star FWHM less than 28 μm that satisfies the Nyquist frequency of the CCD (pixel size = 14 μm) used at that time (Malacara 1992). However, the goal was set as RMS λ/20 considering the error generated by the installation of the primary mirror cell and the alignment of optical axis of the optical system. It was expected that RMS λ/15 of the surface figure error would be achieved during the primary mirror installation to the mirror cell and RMS λ/10 during the alignment of optical axis of the optical system (decenter of the secondary mirror <; ±0.1 mm, tilt <; ±0.01°).
3.2 Processing of the primary mirror
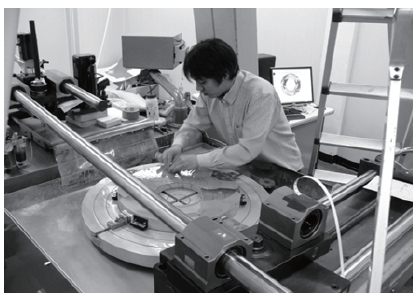
Since the primary mirror of the NESS-2 had been already polished, the surface figure error goal of RMS λ/20 could be achieved by correcting the primary mirror by manual polishing. The 600 mm draper type optical polisher at KRISS was used for the polishing of the primary mirror. To enhance the convenience of the manual processing and measurement, the tool control part and the stroke generator were removed (Fig. 5). In addition, a polyurethane pad was used to the mount to prevent the distortion of the optical plane (Fig. 6).
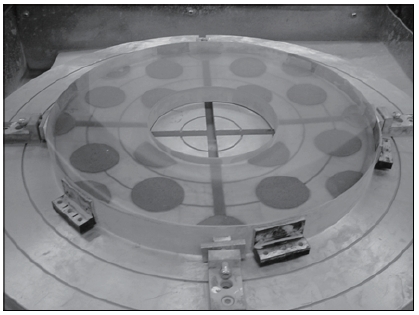
For the surface processing of the primary mirror surface, various sizes of tools were fabricated with polyurethane pads on the surface. In the case of the non-spherical surface processing, a hollow, non-spherical tool was required since the curvature varied depending on the radius of the primary mirror. Fig. 7 is the picture of the various tools.
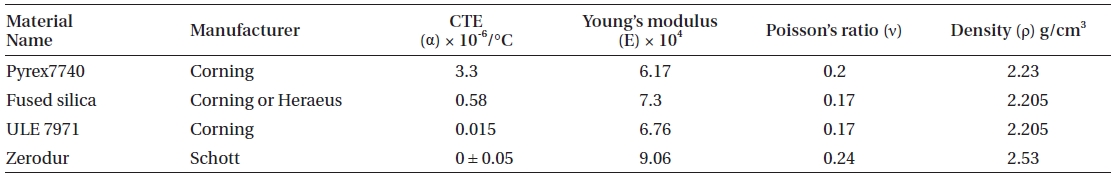
These tools of various sizes were selectively used depending on the width of the error figure to be removed. The processing was performed manually, and the mixture of the water and cerium oxide was used as the abrasive. The glass of the mirror was Pyrex which has a relatively high coefficient of thermal expansion(CTE) compared with other glass and ceramic materials so that the figure of the processed object could be susceptible to the indoor temperature (Table 3) (Yoder 2008). Hence, the indoor temperature of the processing room was kept constant during the processing.
3.3 Results of the primary mirror processing
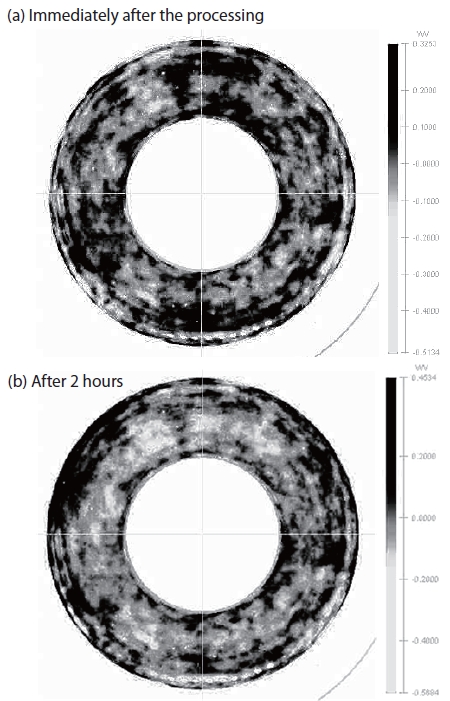
More than a hundred times of measurement and processing were repeated to reduce the surface figure error of the primary mirror below the surface figure error goal, RMS λ/20. It was because the processed object was relatively thin with the thickness ∼1/10 of the diameter in contrast with the general mirrors of which thickness is about 1/5∼1/7 of the diameter, and the figure error could be easily affected by the thermal expansion of the mirror glass which was Pyrex. Figs. 8a and b show the surface immediately after the processing and the same surface after 2 hours.
More than a hundred times of measurement and processing were repeated to reduce the surface figure error of the primary mirror below the surface figure error goal, RMS λ/20. It was because the processed object was relatively thin with the thickness ∼1/10 of the diameter in contrast with the general mirrors of which thickness is about 1/5∼1/7 of the diameter, and the figure error could be easily affected by the thermal expansion of the mirror glass which was Pyrex. Figs. 8a and b show the surface immediately after the processing and the same surface after 2 hours.
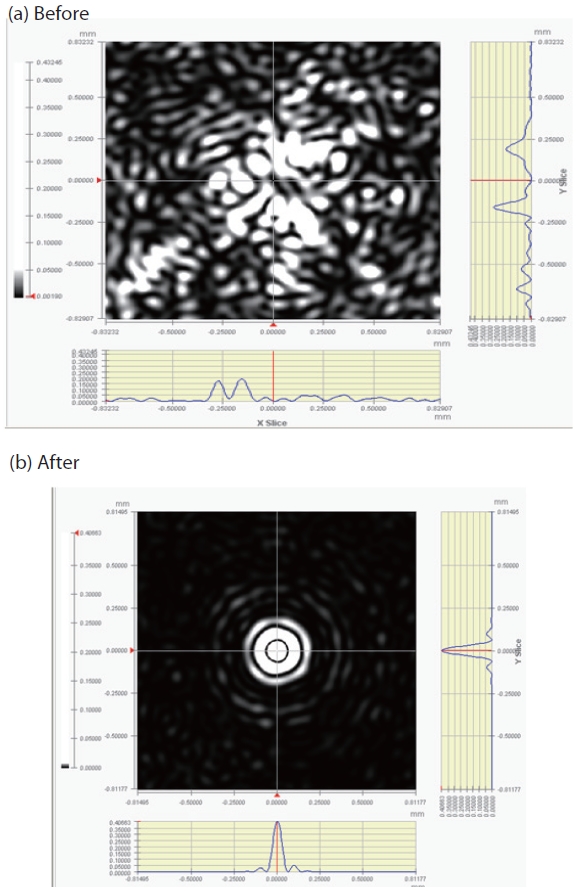
As show in Table 4, the surface became thermally stable after about 2 hours. So, the measurements were carried out after waiting for 2 hours. Fig. 9 shows the measurement results on the polisher after the processing and the surface figure error was less than RMS λ/20. It shows that the spherical aberration and the astigmatism found at the initial measurement were removed. Moreover, Fig. 10 shows the measurement results before and after the processing, indicating that the surface after the processing had the ideal PSF which was close to a diffraction pattern.
3.4 Installation of the primary mirror to the cell
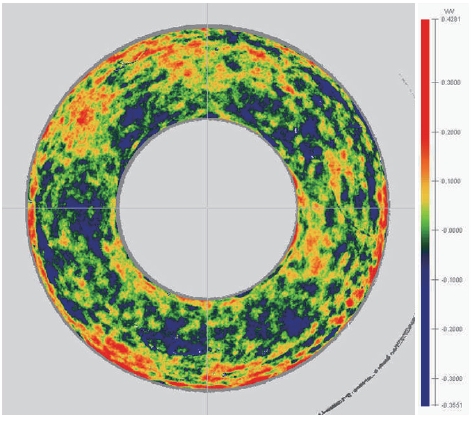
After the primary mirror processing, the primary mirror had to be finally installed to the telescope cell. Since the primary mirror supporting points on the primary mirror cell were fixed to the unprocessed primary mirror, the surface figure was changed after the primary mirror was installed to the cell without correction. Hence, the procedure to measure the surface figure error and correct the error was required after the installation of the primary mirror to the cell. The measurement was carried out after the installation of the processed and coated mirror to the cell. The measurement error had to be corrected according to the surface figure error by the fine tuning of the mirror supporting points. The final measurement results of the primary mirror installed to the cell are shown in Fig. 11, and the figure error of the primary mirror was RMS 0.0648 λ.
[Table 3.] The properties of glass and ceramic materials.

The properties of glass and ceramic materials.
[Table 4.] The change of the primary mirror surface figure error depending on the time.

The change of the primary mirror surface figure error depending on the time.
3.5 The test observation result after the primary mirror correction
After finishing the correction of the primary mirror, the optical tube parts were assembled for the test observation that was carried out on the rooftop of the Radio Research Building at KASI with a wide-field telescope mount. The test observation result is shown in Fig. 12. Though the shape of the star was almost symmetric, a wing like a lunar halo was found around the star. Since this wing could be caused by the spherical aberration, the spherical aberration analysis of the optical system was carried out firstly.
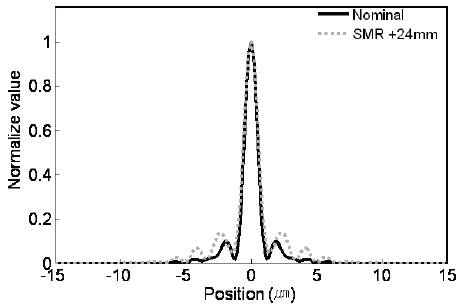
There are many reasons for the spherical aberration in an optical system, but the most influential factors are the curvature radius of the primary mirror and the secondary mirror, the distance between the secondary mirror and the correction lens and the distance among the correction lenses. According to the CODE V software, the surface figure error after the primary mirror processing had almost no effect on the spherical aberration. For the measurement of the curvature radius of the primary mirror, we used the indirect method to measure the distance between the primary mirror and the null lens. The measured curvature radius of the primary mirror was 1,496.5 ± 1 mm which was almost the same with the design value, 1,496 mm. The curvature radius of the secondary mirror could not be measure with an optical method since the surface was convex. So, it was measure by means of the 3-dimensional measurement system at KRISS and the result was 1,820 mm which was larger than the design value, 1,796.977 mm, by about 24 mm. Fig. 13 shows that numerical simulation PSF results obtained by applying the curvature radius of the secondary mirror which was 24 mm larger. The results were obtained by assuming no error in all the other optical elements except the secondary mirror. Fig. 13 shows a wing that is similar to the star profile from the test show in Fig. 12b. Therefore, the curvature radius of the secondary mirror was corrected by judging that the difference in the curvature radius of the secondary mirror was the main reason for the wing that was found around the start.
4. IMPROVEMENT OF THE SECONDARY MIRROR PERFORMANCE
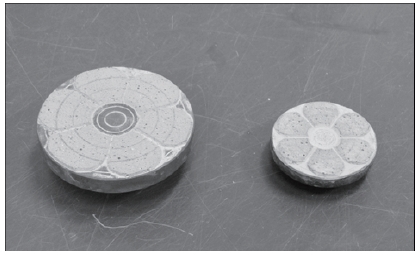
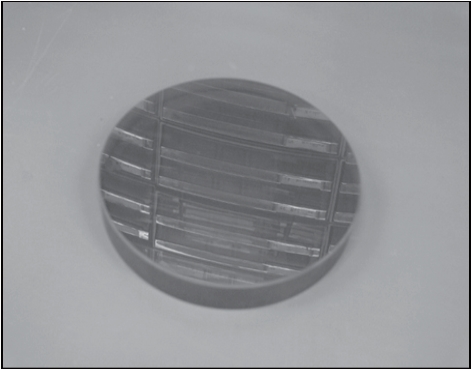
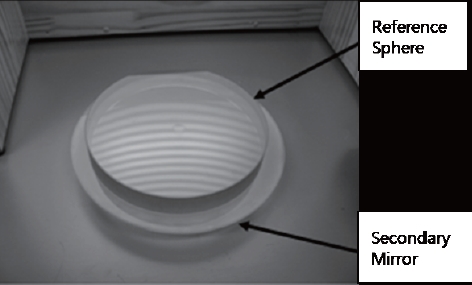
The entire surface of the secondary mirror could not be measure domestically by means of an interferometer since the surface was convex. However, it is possible to measure the surface if a concave spherical surface that has the same diameter of the convex sphere surface is available. A reference concave spherical surface whose curvature radius was R = 1,796.53 ± 0.05 mm, diameter D = 200 mm and the thickness t = 30 mm was fabricated by using the Zerodur at KRISS (Fig. 14).
The shape of the convex sphere could be figure out by observing the Newton patter overlapping the reference concave spherical surface on the secondary mirror. Fig. 15 is the picture of measuring the secondary mirror by using the reference concave spherical surface, showing the interference fringes by the low-pressure sodium lamp of which wavelength was 589-589.6 nm.
The number of interference fringes was about 2, and the curvature radius of the secondary mirror calculated by the Eq. (1) was 1,796.53 mm.
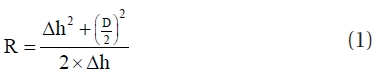
Here, R denotes the curvature radius of the measured object, D the diameter of the reference spherical surface and °h the sum of the reference spherical surface diameter sagitta and (the number of interference fringes × the measuring light wavelength). The percentage of Strehl ratio of the measure value to design value calculated by applying the measure value, 1,796.53 mm, and the design value, 1,795.98 mm, to ZEMAX software was 97.6%.
Fig. 16 shows the test observation result with the corrected secondary mirror. The wing around the was reduced in the shape obtained after the correction of the secondary mirror, and the star FWHM was also reduced to 27.6 μm.
The primary and secondary mirrors of the NESS-2 were corrected at KRISS after transported to Korea from Australia in 2008. The primary mirror was corrected to have the figure error of RMS λ/20 and the curvature radius of 1,496.5 ± 1 mm. The surface figure error of the secondary mirror that had the convex spherical surface could not be measure and the curvature radius was corrected to 1,796.53 mm. Following the correction, the test observation was carried out at the observatory inside KASI. The corrected optical system moved to the SSO in Australia and a test observation was performed in July, 2009.
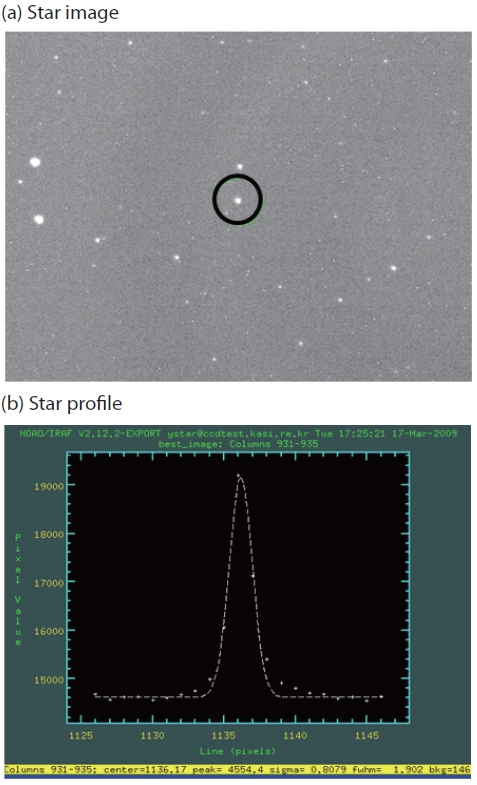
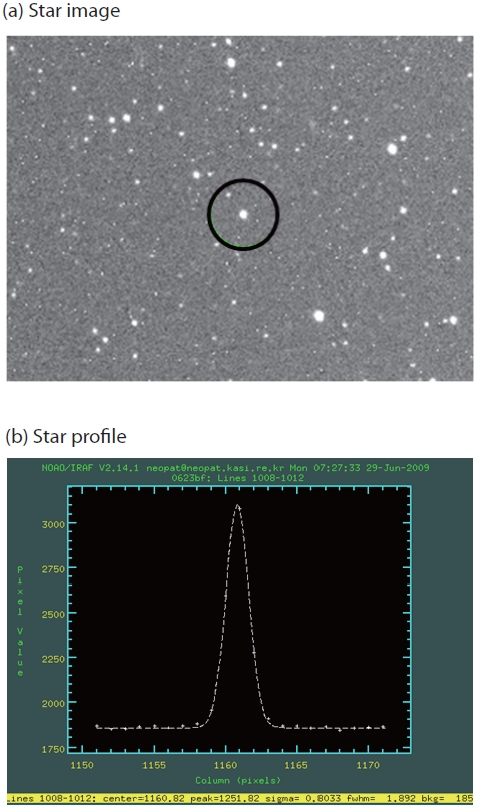
Fig. 17 is the result of the test observation performed at the SSO in Australia, showing that the wing around the star disappeared. The star shape result from the test observation indicated that the performance of the optical system of the Australian Observatory telescope had been improved as the FWHM was ∼27 μm.
Through this study, the methodology to process and measure the optical parts that have the precision of the surface figure error less than RMS λ/20 could be established for the middle and large sized wide-field telescopes with small F number required for satellite tracking test and the NEO observation.