For the oscillator source which is the main component in the local oscillator (LO) system of heterodyne millimeter wave band receiver system, Gunn oscillator with Gunn diode and Yttrium Iron Garnet (YIG) oscillator with YIG are used in general (Carlstrom et al. 1985, Erickson et al. 1992). The development of analog and digital phase locked loop (DPLL) module has been carried out to increase the output frequency stability of LO system and its output power stability (Davis et al. 1991, Hunter et al. 2003).
Heterodyne type radio receiving is applied to the most of the domestic and international single-dish radio telescopes and very large array (VLA) and very long baseline interferometry (VLBI) array radio telescope systems to observe the space radio wave in millimeter or sub-millimeter band. Thus, for accurate correlation of the observation data in the millimeter wave band VLA and VLBI observation receivers, the LO system ensuring frequency stability of several Hz, power stability as well as instrumental phase stability should be established to provide the LO signals of cryogenic mixer that is used as a cosmic radio signal detection (Durand et al. 2006). In addition, in order to observe the very weak line spectrum of which antenna temperature is less than 0.1 K with a single-dish radio telescope, the power stability of the intermediate frequency of the receiver and the radio spectrometer should be secured and the noise of the instrument itself should be minimized. Among these requirements, the power stability of the intermediate frequency of the receiver is very important to the observation data stability. To maximize the observation data stability, the stability of the LO frequency provided to the mixer should be firstly secured (Lee et al. 2005, Nagatsuma et al. 2006).
In this study, we have designed and fabricated the LO system whose VCO is Gunn oscillator that is mainly used as the LO of the millimeter wave band cosmic radio wave receiver systems covering the frequency band of 86-115 GHz. DPLL module was also developed as the PLL method for the frequency from the Gunn oscillator to allow the control by a computer.
The performance verification of the fabricated LO system was carried out in the laboratory. First, the output frequency and the power stability that determines the single-dish radio receiver performance were measured. The results showed that the system maintained ±10 Hz of frequency stability and 0.06 dBm of power stability for more than 2 hours, indicating that the system can be used as the single-dish receiver system LO with the same performance of the LO that uses YIG oscillator (Lee et al. 2005). Second, the high-level phase stability that is required for the millimeter wave band VLBI receiver system was measured with the DPLL module developed in this study and a commercial PLL module, respectively. The phase and amplitude stability was measured for 20, 200, 500 seconds and 2 hours. The obtained phase data was compared and analyzed by the instrument phase compensation method using the tone signals (Walker 1995). The phase analysis results showed that the mean phase drift stability was better in the case of DPLL module that the case of the commercial product. However, the phase drift of about 34° was found. Since the phase drift of the measuring instrument was also included in the data, we expect that better result can be obtained when a more precise phase measurement system is available in the future.
2. SYSTEM DESIGN AND FABRICATION
2.1 Resonator-tuned type Gunn oscillator
Generally, the output frequency and power of the millimeter wave band resonator-tuned type Gunn oscillator are controlled by the mechanical tuning the electrical bias and the U-band resonator back-short. In other words, the output frequency
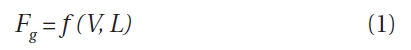
The function,
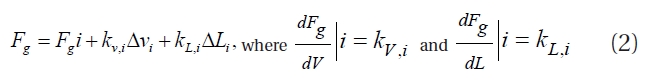
Usually κV,i has positive values, and the unit is MHz/Volt. κL,i can be compensated from the micrometer tuning characteristics has negative values and its unit is mil/GHz. Thus, by the application of PLL system, the drift of °
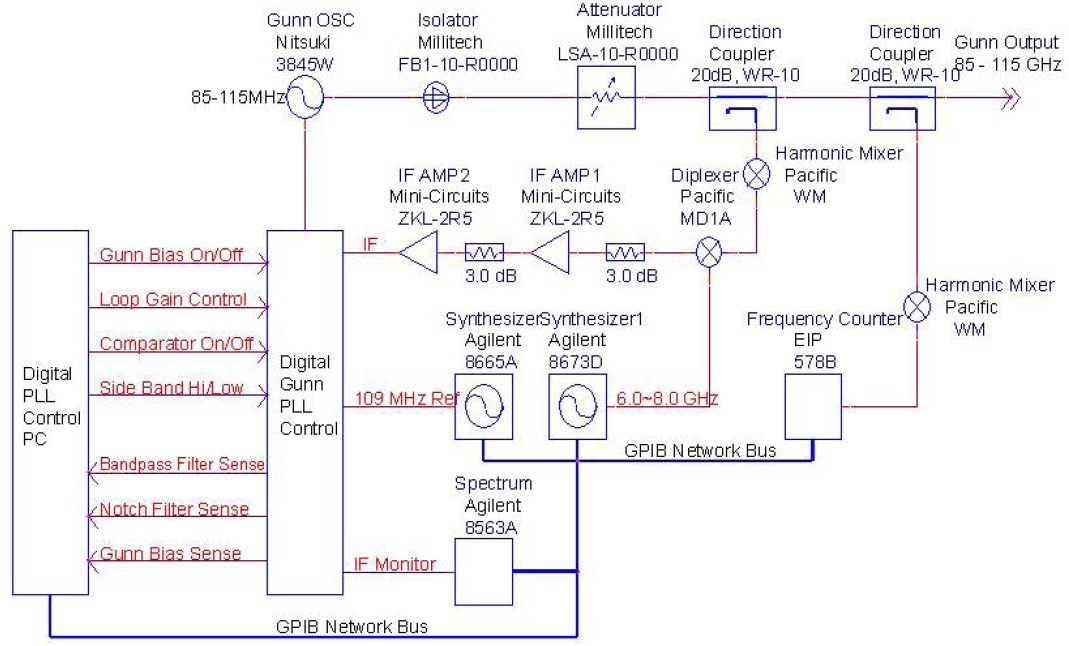
In this study, for the millimeter wave band VCO that can control the voltage in the manner described in the previous section, the millimeter wave band LO system of 86-115 GHz was designed as show in Fig. 1 on the basis of the Gunn oscillator of Nitsuki, Japan.
The total system configuration was divided into two categories for the design and fabrication: first radio frequency (RF) part consists of the Gunn oscillator, the waveguide parts including isolator, attenuator and directional coupler, the harmonics mixer to generate the intermediate frequency of 0-200 MHz required for the DPLL, diplexer, the intermediate frequency amplifier components, and the measuring instruments for the monitoring of the intermediate frequency and the RF system including the 6-8 GHz oscillator to respond to the 109 MHz of reference frequency and the change of the LO frequency. Second part is the DPLL controller that generates the correct Gunn bias voltage receiving the intermediate frequency and the command from the controlling computer.
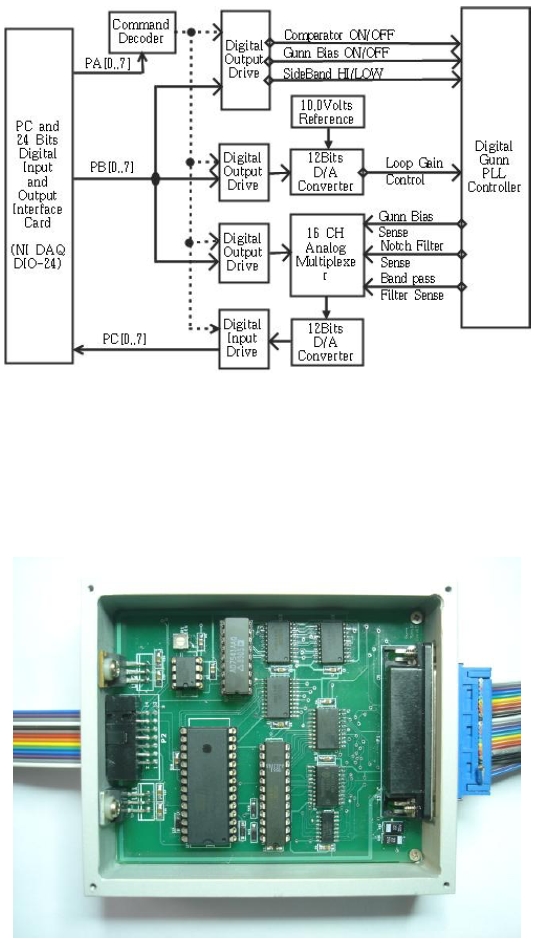
The DPLL controller, the most essential part of the LO system constituted as in Fig. 1, was designed and fabricated to control Gunn bias ON/OFF, the loop gain and the comparator ON/OFF, and to monitor the band pass filter, the notch filter and the Gunn bias with a personal computer, as shown in Fig. 2 (Lee et al. 2006).
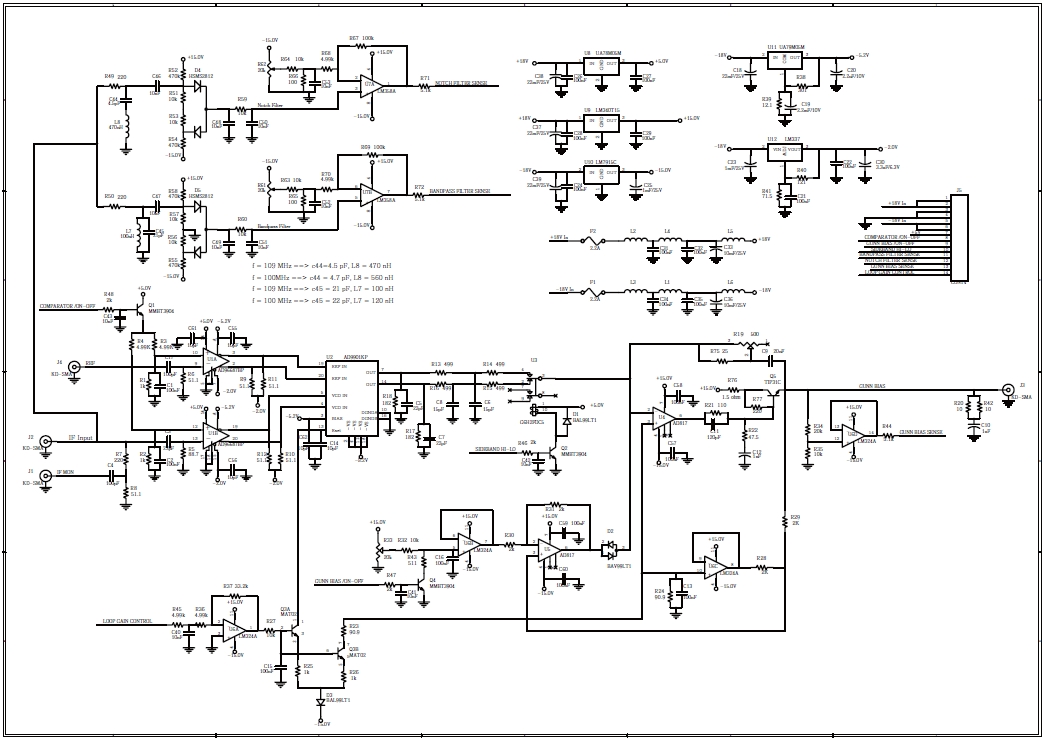
2.3 Fabrication of the DPLL module
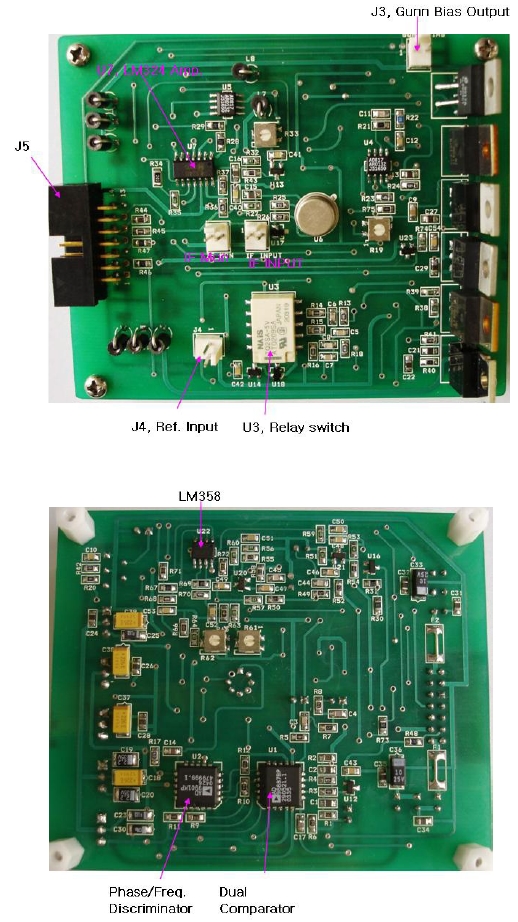
The DPLL controller of Fig. 2 was designed and fabricated with different circuits in one printed circuit board (PCB) as shown in Figs. 3 and 4: the high-speed comparator circuit that converts and compares the 0-200 MHz of the intermediate frequency signals and the 109 MHz of the reference signal into emitter coupled logic (ECL) digital signals, the phase error detector circuit that uses the ultra high-speed phase and frequency discrimination function, the circuit that controls and holds the loop gain of the Gunn PLL, the circuit that sets the ON/OFF and the Gunn bias voltage, the circuit that drives the detected phase error and the Gunn bias, and the circuit that monitors the PLL status using the notch filter and the bandpass filter designed by the LC resonator circuit.
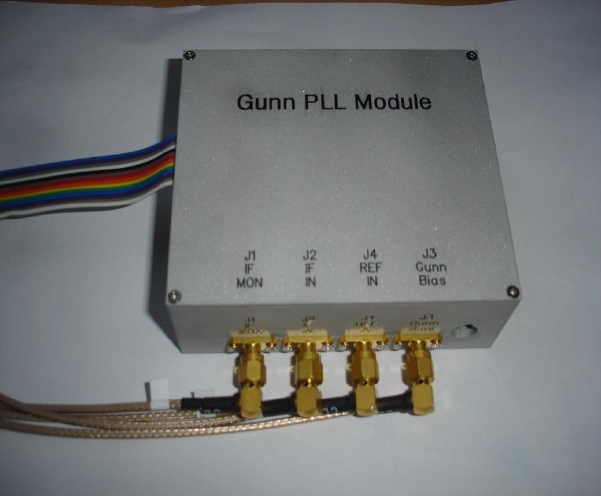
The interface box was designed and fabricated as shown in Fig. 5 to remote control the DPLL controller with a PC and monitor the PLL status. The interface circuit was constituted to input and output 3 digital signals and 4 analog signals. The 3 digital output signals are for the ON/OFF of the Gunn oscillator power source, the selection of the high or low PLL frequency sideband and the ON/OFF (comparator) of the PLL lock command. The analog output signal can change the loop gain in the range of 0.0-5.0 volts. The 3 analog input signals are used to monitor the oscillating voltage of the Gunn oscillator, voltage detection from the notch filter and the band-pass filter and monitor the PLL lock status.
3.1 The output frequency and power stability test of the LO
The overall system setup for the LO system performance test was based on the block diagram in Fig. 1. HP 8665A function generator was used for the 109 MHz reference frequency, and HP 8673D for the 6-8 GHz of frequency that was determined by the LO frequency. EIP 578B frequency counter was used to measure the stability of the LO frequency stability. HP Harmonic Mixer 11970 W and the Agilent E4440A spectrum analyzer were employed to measure the LO output power stability. Each of the measuring instruments was connected through GPIB and the measurement data were obtained by using a PC.
The operation was carried out from the control PC to the DPLL controller in order according to the following procedures:
The Gunn oscillator was turned from OFF to ON to supply the bias voltage from the DPLL control PC to the Gunn oscillator and the sideband was set to Hi or Low.
The Fsyn frequency that is calculated by the Eq. (3) according to the LO frequency (FLO) was set up in the magnitude of 0-8 dBm and output with the HP 8673D Synthesizer.

where, Fsyn is 6-8 GHz, Fref is the reference frequency 109 MHz and N is the harmonic integer that is expressed as the integers from 12 to 18.
The reference frequency 109 MHz was set up in the HP 8665A Synthesizer and the output power was set up in the range of 0-8 dBm.
When the band-pass filter Sense was the maximum, the loop gain control voltage was tuned to let the output voltage of the notch filter Sense be the minimum.
Finally, for PLL ON, the comparator On/Off signal was output as ON from the control PC.
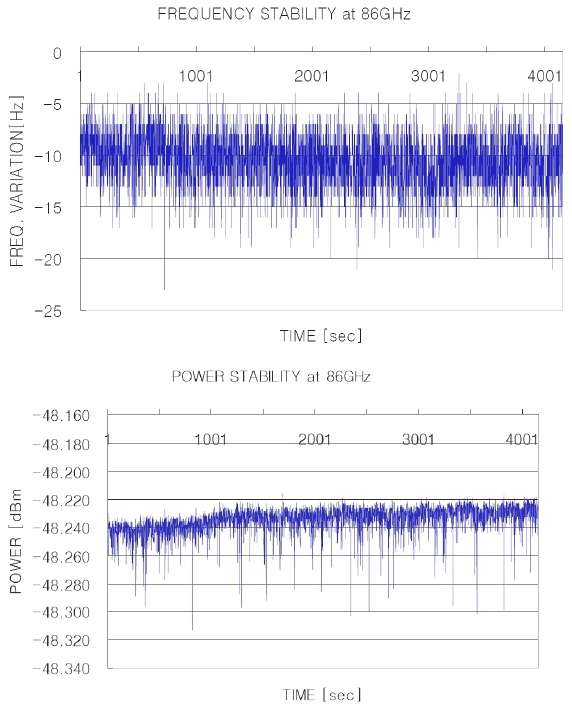
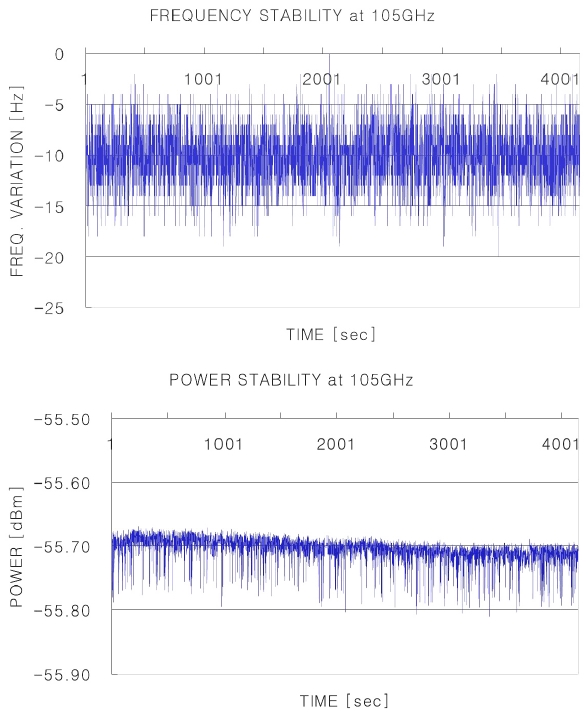
After the PLL ON by these procedures, the long-term stability of the output frequency and the power amplitude were measured with the EIP 578B frequency counter, the HP 11970W external harmonics mixer and the Agilent E4440A spectrum analyzer for 4,000 seconds. The measurement results at different LO frequency are shown in Figs. 6 and 7. Here, since the conversion loss of the harmonics mixer during the power measurement was 40dBm and the directional coupler used in this experiment had 20 dBm loss, totally 60 dBm loss should be considered at the y-axis at the right graph of Figs. 6 and 7.
After the PLL ON by these procedures, the long-term stability of the output frequency and the power amplitude were measured with the EIP 578B frequency counter, the HP 11970W external harmonics mixer and the Agilent E4440A spectrum analyzer for 4,000 seconds. The measurement results at different LO frequency are shown in Figs. 6 and 7. Here, since the conversion loss of the harmonics mixer during the power measurement was 40dBm and the directional coupler used in this experiment had 20 dBm loss, totally 60 dBm loss should be considered at the y-axis at the right graph of Figs. 6 and 7.
3.2 The phase and amplitude stability test of the LO frequency
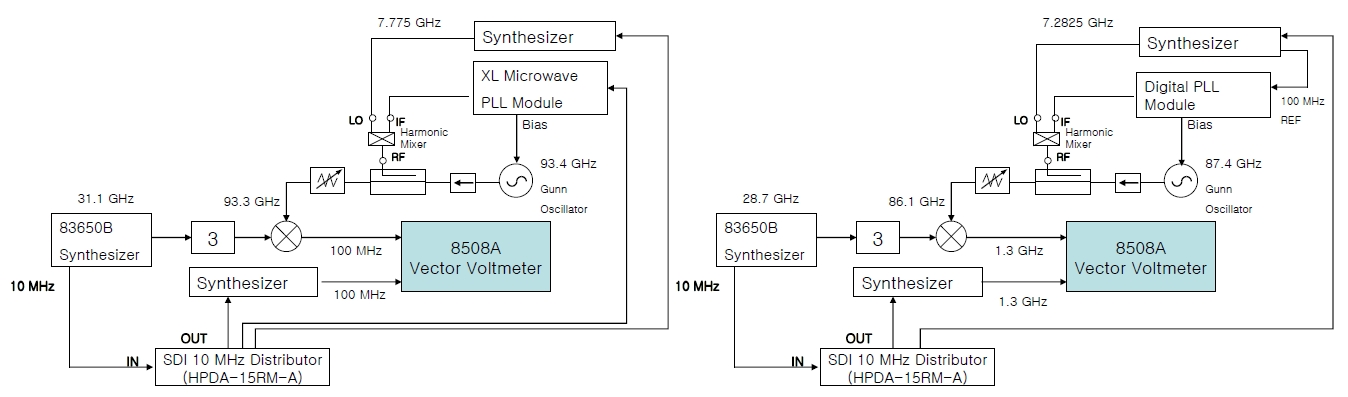
To compare the phase and amplitude stability performance of the LO system with the developed DPLL module, two test systems were set up with the commercial PLL module and the DPLL module developed in this study, as shown in Fig. 8. For the two systems in common, Nisuki Gunn oscillator was used as the VCO and the Agilent 8508A vector voltmeter was used for the phase stability measurement. The tone signals for the phase comparison were applied to the mixer by the triple multiplication of the continuous wave (CW) signal from the Agilent 83650B. For the synchronization of all the measuring instruments, the 10 MHz output frequency from the 83650B synthesizer was applied to a 10 MHz frequency distributor to use the outputs as the external reference signals for each of the instruments.
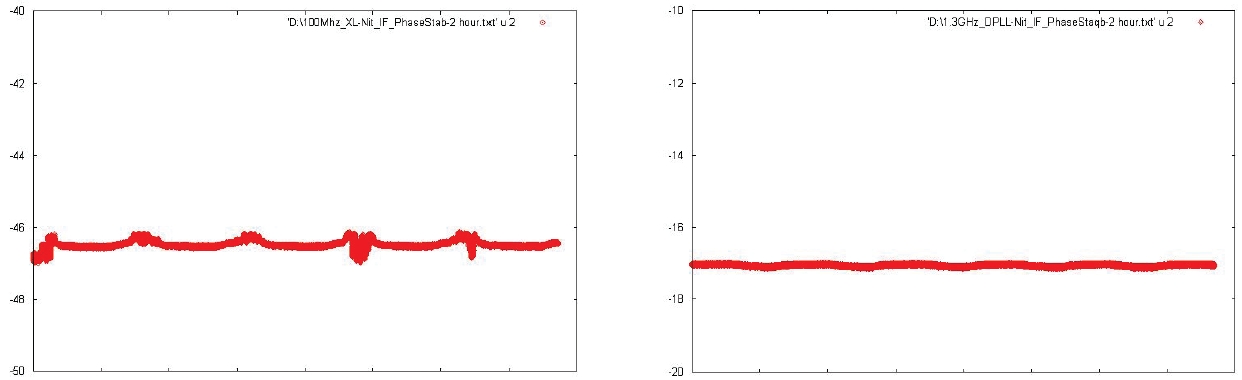
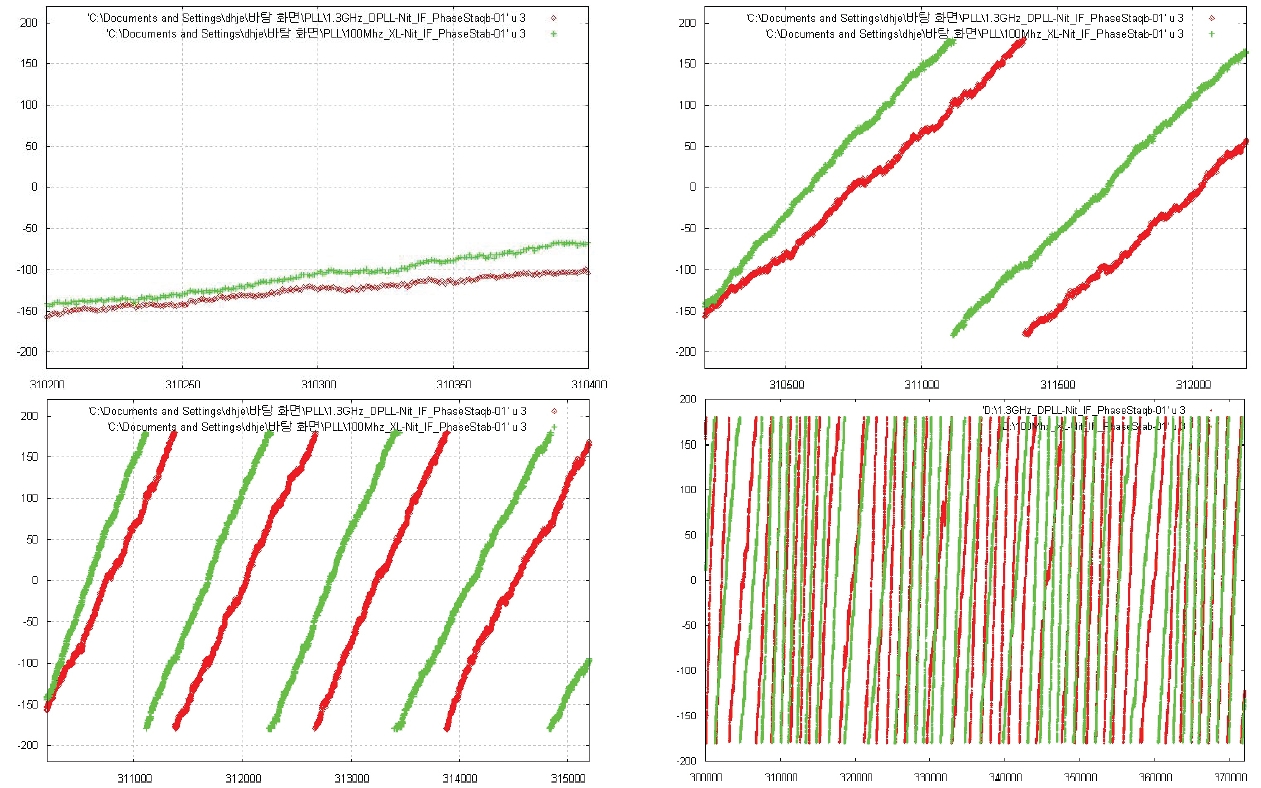
The experiment was performed by measuring the phase stability change (A/B) for 20, 200, 500 seconds and 2 hours. The result of the phase stability is shown in Fig. 9 and the phase stability (A-B) change is shown in Fig. 10.
The linear phase increase or decrease, as in Fig. 9, can be easily understood by the principle of phase stability test based on the following equation:

Here φ1,n is the offset value of the phase measure at each of the frequencies.
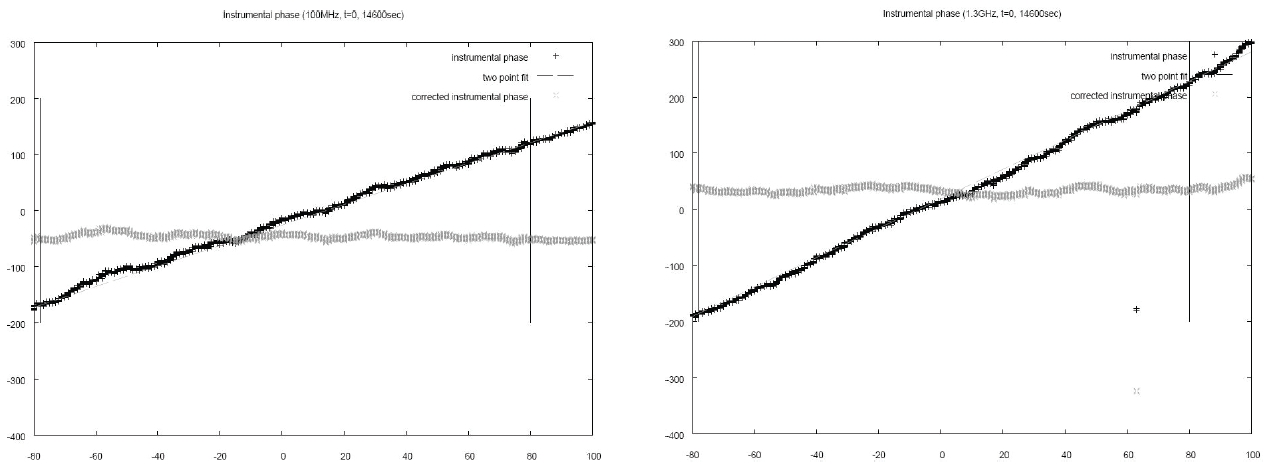
The phase error °φ is calculated by °φ = 2π(

From Equation (5), °φ(
When the compensated results were linearly fit, the mean and standard deviation of the compensated phase were -46.55° and 5.32°, respectively, in the case of the commercial PLL module, and 33.63° and 15.41°, respectively, in the case of the developed DPLL module. These calculations verified that the mean drift performance of the compensated phase was good when the DPLL module was applied, showing the less value by about 13°. However, both cases did not show satisfactory performance of phase drift characteristics. The major reason for the result is assumed to be the fact that the measuring instruments used in the experiment had their own phase drifts.
In this paper, the LO system of a millimeter wave band receiver was constituted by using the Gunn oscillator as the VCO and developing the DPLL module for computer-aided control. To verify the performance, the output frequency and power stability were measured and test, firstly. The experimental results showed that the output frequency was very stable at all the frequencies within ±10 Hz. The output power stability also showed excellent drift characteristic less than 0.06 dBm. The measured locking range was very wide as to be 200 MHz. Second, to verify the potential feasibility of the developed DPLL module to VLBI receiver system, the phase stability performance was compared with that of the commercial PLL module. The instrumental phase and amplitude stability measurements were compensated using the tone signals and the results showed that the DPLL module was more stable than the commercial PLL module. However, both of the modules did not show satisfactory phase drift characteristics due to the phase drifts of the measuring instruments themselves used for the experiment. It is expected that the module will show excellent phase drift characteristics within 10° if the test is performed using the measuring instruments with stable phase drift change characteristics in an upgraded experimental environment in the future.