To test the feasibility of using chlorophyll a fluorescence to assess the establishment success of seagrass transplants, photosynthetic characteristics of eelgrass Zostera marina transplants were measured using a Diving-pulsed amplitude modulation fluorometer in Jindong Bay on the southern coast of Korea. Maximum quantum yield (Fv/Fm), photosynthetic efficiency (α), saturating irradiance (Ek) and maximum electron transport rate (ETRmax) of transplants and reference plants in a nearby transplant site were measured using the fluorometer for 5 months. Additionally, shoot morphology, individual shoot weight and productivity of transplants and reference plants were also monitored. Shoot height, leaf weight and productivity of transplants were significantly reduced during the first two or three months after transplantation compared to those of reference plants, and then increased to the levels of reference plant Characteristics of chlorophyll a fluorescence, including Fv/Fm, α, Ek and ETRmax of transplants were also significantly reduced in the initial period, but recovered slightly sooner than shoot morphology or leaf productivity. These results indicated that after transplantation, Z. marina transplant photosynthesis recovered faster than shoot morphology, biomass or productivity. Thus, chlorophyll a fluorescence can be used as an indicator for early assessment of the status of eelgrass transplants without destructive sampling.
Chlorophyll
When transplanting seagrasses, transplants may establish by adapting to new transplant environment in their physiology, morphology and growth (Zimmerman et al. 1995, Moore et al. 1996, van Tussenbroek 1996, Horn et al. 2009). Their photosynthesis will also be affected to some extent by transplanting shock, which can be indicated by characteristics of chlorophyll
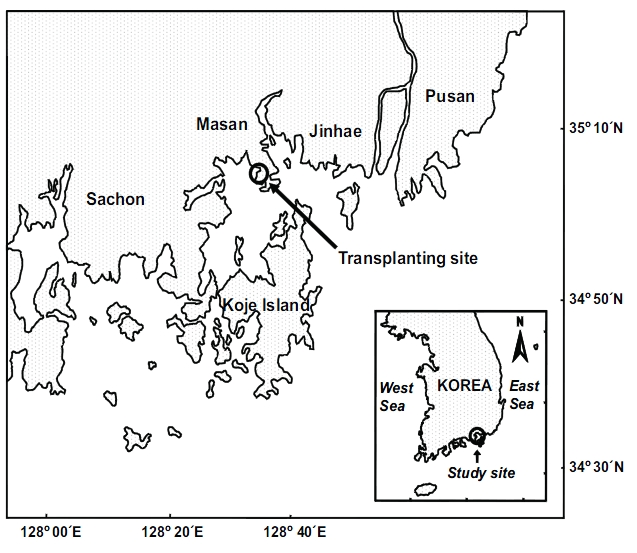
Transplantation was conducted in Jindong Bay (35°05.6'N, 128°33.9'E) on the southern coast of Korea (Fig. 1). Seagrasses were once widespread in this bay, but significant seagrass decline has occurred due to human activities such as seashore road construction, reclamation, fishery activities, and increased nutrient loading during the past decades. Recently, small Z. marina patches have been observed inthe bay. Thus, the environment conditions in this bay are probably suitable for seagrass growth. The mean water depth at the study site was about 1.5 m relative to the mean sea level, and the sediment was loamy. The tidal regime is semi-diurnal with a 1.5 m tidal range (Tide tables for coast of Korea, National Oceanographic Research Institute of Korea). Z.
Seagrass transplantation was conducted in October 2008.
>
Chlorophyll a fluorescence measurements
After transplantation, transplants and reference plants were sampled with a 2-5-week interval for about 5 months. The measurements of the chlorophyll
The RLCs of Z. marina leaves obtained from the Diving-PAM fluorometer were calculated using a default absorption factor (0.84), which is the instrument’s default value determined for terrestrial plants. Leaf absorption factor values of Z. marina were measured using the light meter of the fluorometer immediately after chlorophyll a fluorescence measurement (Beer et al. 1998). The average absorption factors for transplants and reference plants were used to calculate the ETRs.
To calculate the values of characteristic parameters of RLCs such as α,

where
The parameters ETRmax and

After chlorophyll
Plant samples were rinsed with tap water and cleaned of sediments and epiphytes using a razor blade.
At each sampling event, the leaf marking technique (Zieman 1974) was also applied for leaf productivity measurement. Ten to 12 haphazardly chosen shoots were marked through the bundle sheath about 3 cm above the meristem using a hypodermic needle. At the next sampling event after a period of about 3-5 weeks, the marked plants were retrieved, taken to the laboratory, cleaned as described above for biological measurements, and then all leaves were separated into old and newly produced parts and dried as also described above. Leaf productivity was measured by dividing the dry weight (DW) of the newly produced leaf parts of a shoot by the time interval (in days) since the shoot was marked.
Statistical analyses were performed using SPSS version 16.0 (SPSS Inc., Chicago, IL, USA). Data were tested for normality and homogeneity of variance to meet the assumptions of parametric statistics. If these assumptions were not satisfied, data were log transformed. Differences in
>
Chlorophyll a fluorescence parameters
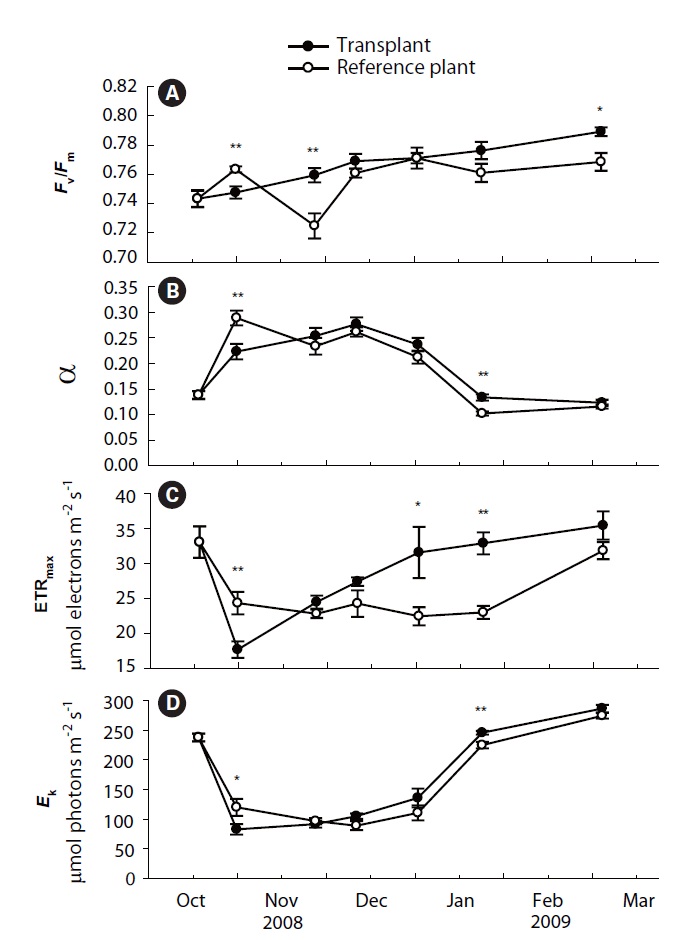
Values of
Photosynthetic efficiency (α) of both transplants and reference plants showed significant (p&;lt;0.01)temporal variations, ranging from 0.12 ± 0.01 to 0.28 ± 0.01 for transplants and from 0.10 ± 0.00 to 0.29 ± 0.01 for reference plants (Fig. 2B). Comparing with reference plants, α of transplants was also reduced at the first sampling event after transplantation, being significantly lower than that of reference plants (p < 0.01). However, the α of transplants also became comparable to, or even higher, than that of reference plants from the second sampling event (Fig. 2B). ETRmax and

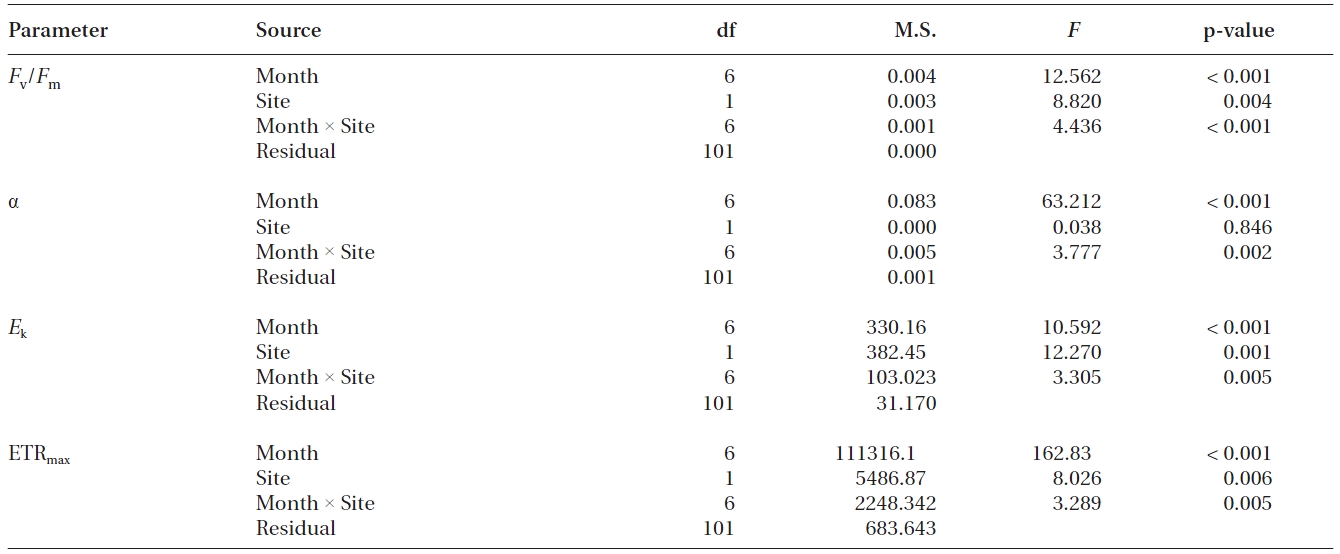
Results of two-way ANOVA for the chlorophyll a fluorescence parameters in seagrass Zostera marina between sampling sites and among sampling months
>
Shoot morphology and productivity
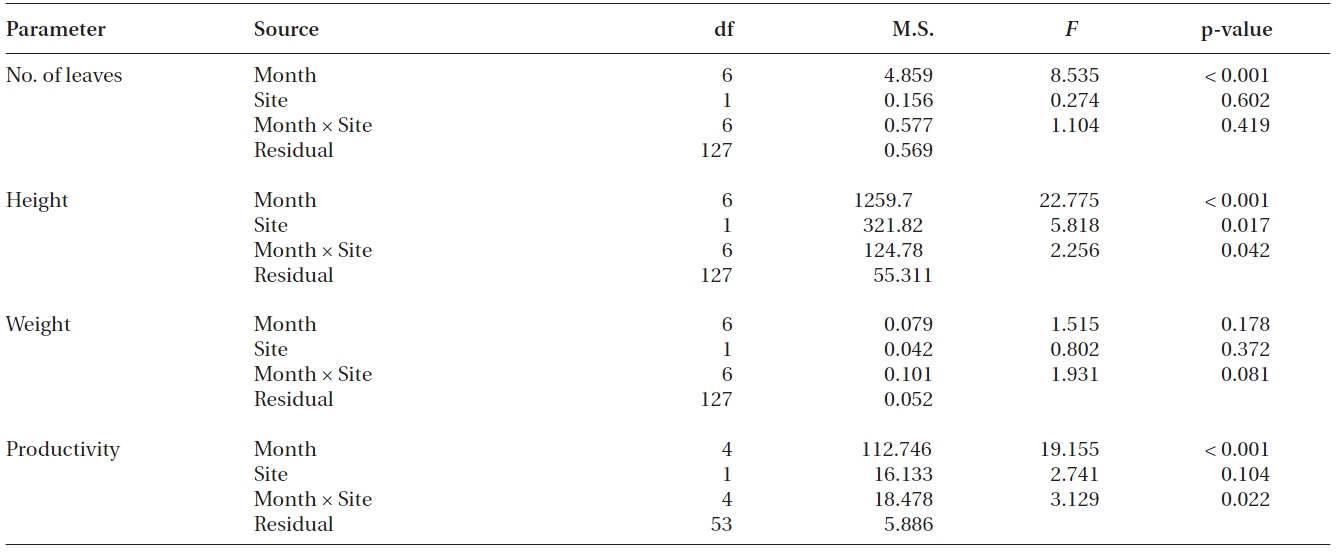
Significant differences were found in the number of leaves, shoot height and leaf productivity among sampling times (all p < 0.001), but not in the leaf DW per shoot (p = 0.178) (Table 2, Fig. 3). Two-way ANOVA also showed that significant differences were found in shoot height (p = 0.017), but not in the three other measurements between transplants and reference plants throughout the study period (Table 2). The number of leaves in transplants and reference plants increased over time, ranging from 4.6 ± 0.3 to 6.0 ± 0.2 leaves shoot-1 for transplants and from 4.7 ± 0.2 to 6.5 ± 0.3 leaves shoot-1 for reference plants (Fig. 3A). Highest values of shoot height of both transplants and reference plants occurred in early December of 2008 (i.e., 75.3 ± 2.4 and 83.7 ± 1.8 cm for transplants and reference plants, respectively), whereas lowest values of shoot height occurred in late October 2008 (58.0 ± 1.7 cm) for transplants and at the beginning of the study period (58.1 ± 1.7 cm) for reference plants (Fig. 3B). Leaf weight of both transplants and reference plants varied greatly over time, but no clear changing pattern was found (Fig. 3C). Leaf weight was highest in March 2009 for transplants (1.11 ± 0.04 g DW shoot-1) and in November 2008 for reference plants (1.07 ± 0.09 g DW shoot-1), and lowest in later October 2008 for transplants (0.76 ± 0.05 g DW shoot-1) and in January 2009 for reference plants (0.84 ± 0.09 g DW shoot-1) (Fig. 3C).

Results of two-way ANOVA for number of leaves per shoot, shoot height, shoot weight and shoot productivity of Zostera marina between sampling sites and among sampling months
Contrary to the other measurements, leaf productivity continuously decreased in both transplants and reference plants during most of the study period, with only a slight rise at the last sampling event (Fig. 3D). Highest values of leaf productivity of both transplants and reference plants occurred in November 2008 (16.5 ± 0.8 and 21.6 ± 0.8 mg DW shoot-1 day-1 for transplants and reference plants, respectively), whereas the lowest values occurred in January 2009 (11.2 ± 0.7 and 10.0 ± 1.8 mg DW shoot-1 day-1 for transplants and reference plants, respectively).
Seagrass shoot morphology and growth usually exhibit seasonal and spatial variations, and, thus, measurements of transplants should be compared with those of reference plants for assessment of the establishment success of transplants (Fonseca et al. 1996, Balestri et al. 1998, Peralta et al. 2003, Tanaka and Nakaoka 2004, Evans and Short 2005, Lee and Park 2008). When transplanting seagrasses, seagrass leaves may be broken, and may also occasionally be exposed to air, hence the photosynthetic performance of transplants decreases during the initial period of transplantation (Seddon and Cheshire 2001, Lan et al. 2005, Horn et al. 2009). In this study, we measured the shoot morphology, leaf weight and growth of transplants and reference plants, as well as their photosynthetic parameters. Significant reductions were observed in all the four measurements of photosynthetic parameters of transplants during the first sampling event after transplantation. Decrease in
Values of the four measurements of photosynthetic parameters of transplants became comparable to, or even higher than, those of reference plants from the second sampling event after transplantation. Increases in the photosynthetic parameters probably imply that photosynthesis of transplants had recovered from transplanting shock after about one month since transplantation (Horn et al. 2009). Shoot height, leaf DW and leaf productivity of transplants were also significantly reduced during the initial period after transplantation, which might also be due to the transplant shock (Lepoint et al. 2004, Evans and Short 2005). However, shoot morphology and productivity took longer time to increase to the levels of reference plants than the chlorophyll
Recently, chlorophyll fluorescence has been widely used to examine the photosynthetic performance of plants in response to a variety of environmental stresses (Figueroa et al. 2002, Adams and Demmig-Adams 2004, Campbell et al. 2006, Koch et al. 2007, Kahn and Durako 2009). Chlorophyll