The genus Chaetoceros provides highly diversified diatoms in marine systems. Morphological descriptions of the genus are well-documented, yet the DNA taxonomy of Chaetoceros has not been satisfactorily established. Here, the molecular divergences of the 18S-28S rDNA of Chaetoceros were assessed. DNA similarities were relatively low in both 18S (93.1 ± 3.9%) and 28S rDNA (81.0 ± 4.6%). Phylogenies of the 18S, 28S rDNAs showed that Chaetoceros was divided according to individual species, clustering the same species into single clades. Statistical analysis with corrected genetic (p-) distance scores showed that nucleotide divergence of Chaetoceros 28S rDNA significantly differed from that of 18S rDNA (Student’s t-test, p < 0.05). This finding suggests that the 28S rDNA may be treated as a more suitable marker for species-level taxonomic distinctions of Chaetoceros.
DNA-based molecular tools are sometimes very effective for the species discriminations of microscopic-size organisms like diatoms (e.g., Jung et al. 2010). Recently, the concept of DNA barcoding was introduced to diatom taxonomy (Evans et al. 2007, Kaczmarska et al. 2007). The promise of DNA barcoding is based on a small DNA fragment divergence coinciding with biological species separation (Moniz and Kaczmarska 2009). Several pioneer studies on the diatom barcoding were performed with several molecular markers such as nuclear ribosomal DNA (rDNA), chloroplast
Of the molecular markers used in taxonomic studies, nuclear rDNA in eukaryotes is typically composed of tandem arrays of a basic unit that contain the transcription unit (e.g., 18S, 5.8S, 28S) and an intervening intergenic spacer region. The different subunits and regions of the rDNA locus have different degrees of sequence variability and varying suitability for comparison at the inter-generic or inter-species level. Recent data indicated that nuclear rDNA is a suitable molecular marker for DNA-based taxonomy or DNA barcoding of diatoms (Alverson et al. 2007, Evans et al. 2007, Kaczmarska et al. 2007, Moniz and Kaczmarska 2009, 2010, Jung et al. 2010). However, DNA-based discriminations should be carefully applied to the strongly diversified diatoms considering their molecular divergences of the rDNA, because they are variable according to different rDNA molecules and taxonomic categories (e.g., Jung et al. 2010). For example, the centric diatoms
In the present study, we characterized molecular characteristics including genetic divergences and DNA similarity of the 18S-28S rDNA sequences from several selected
In this study, a total of 32 rDNA sequences from
>
DNA sequence characteristics
Intra-specific genetic variations of
>
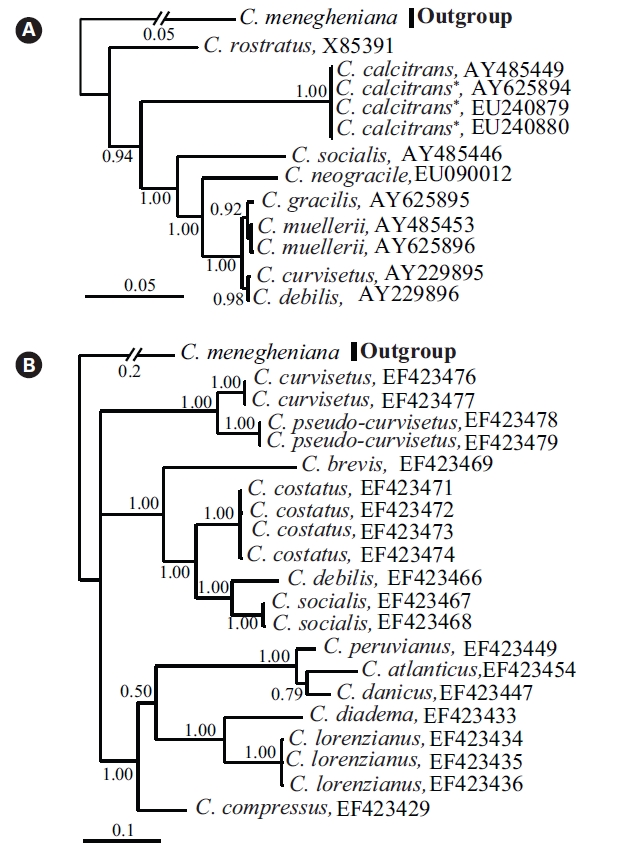
Phylogenetic analysis of Chaetoceros
For the phylogenetic analysis of
In this study, we characterized nuclear 18S and 28S rDNA sequences of
Genetic variations in the rDNA of
Bayesian trees with the 18S-28S rDNAs showed
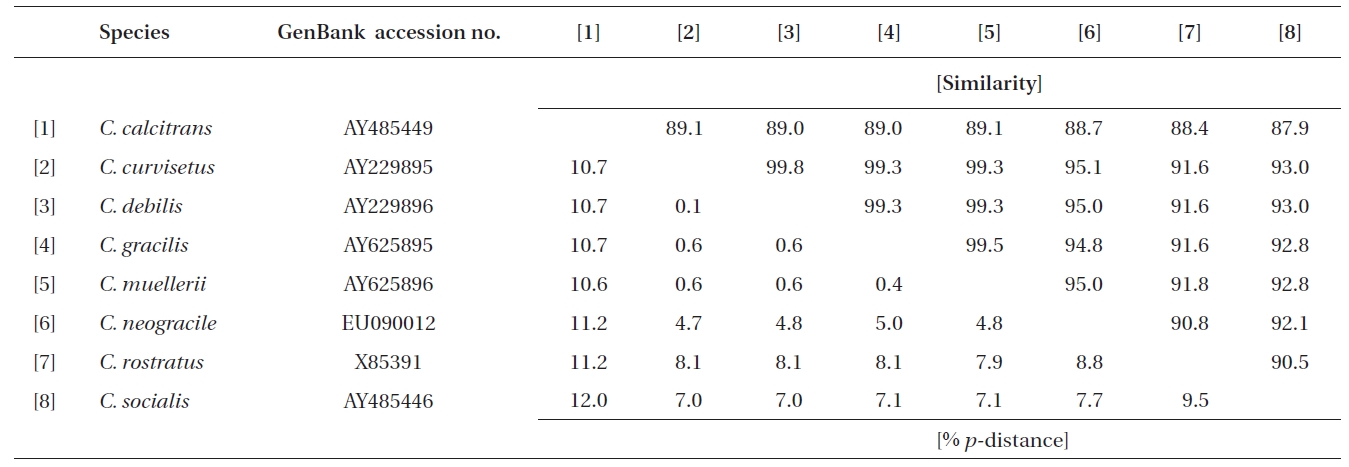
Similarity scores (above diagonal) and genetic distances (below diagonal) between nine pairs of the aligned sequence data (1,734 sites) of the nearly complete 18S rDNA of Chaetoceros
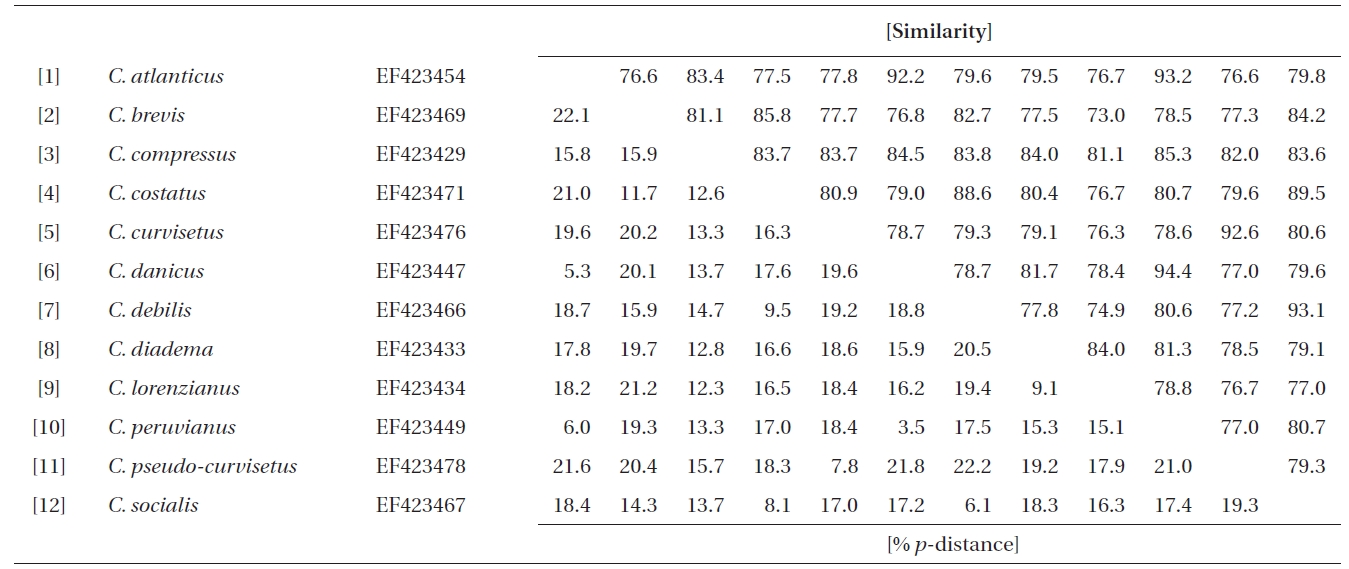
Similarity scores (above diagonal) and genetic distances (below diagonal) between 12 pairs of the aligned sequence data (758 sites) of partial 28S rDNA of Chaetoceros
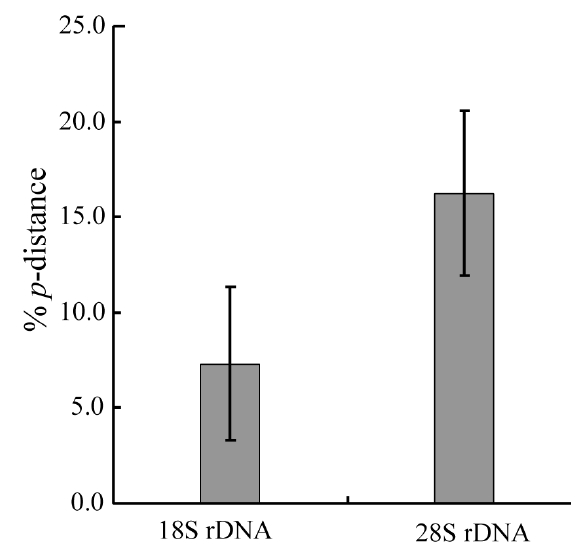
Molecular comparisons and phylogenies showed that sequence variations in the 18S and 28S rDNA within intra-species were not significantly different (Student’s t-test, p > 0.05). Thus, we selected different Chaetoceros (e.g., eight for 18S rDNA; twelve for 28S rDNA) to extensively compare one another. Table 1 summarizes the DNA similarity and corrected p-distance scores between the eight pairs of aligned 18S rDNA sequences. DNA pairs of C. curvisetus, C. debilis, C. gracilis, and C. muellerii were recorded at high DNA similarities (> 99%, or < 0.6% p-distance), indicating that they could not be separated by the 18S rDNA divergences; however the other pairsFig. 2. Nucleotide divergences of Chaetoceros 18S and 28S rDNAs based on corrected p-distances. Values of the p-distances were measured at 7.3 ± 4.01 (n = 36) for 18S and at 16.2 ± 4.34 (n = 66), respectively. showed relatively low similarities (< 95%, or > 4.8% p-distance). On the other hand, the Chaetoceros 28S rDNA showed high genetic divergences in the present analysis. Table 2 displays the DNA similarity and p-distance scores among the 12 compared species. In most cases, DNA divergences were considerably high in the 28S rDNA (81.0 ± 4.6% similarity). The highest similarity (94.4%) was recorded between C. danicus and C. peruvianus, and the lowest (77.2%) was recorded between C. devilis and C. pseudo-curvisetus.
In addition, comparative analysis showed that corrected p-distances of the 18S and 28S rDNAs were 7.3% and 16.3%, respectively (Fig. 2), based on pairwise genetic distance scores (Tables 1 & 2). Statistical testing revealed that divergences of the 28S rDNA were significantly different compared to the 18S rDNA (Student’s t-test, p < 0.05). In further analysis, we found that the 28S rDNA contained more PI sites (28.6%) than 18S rDNA (11.0%). The 28S variation was approximately 2.60-times higher than that of the 18S as judged from the % PI values, and it was also 2.23-times by p-distance in the present data sets. These statistical, parsimonious results showed that the 28S rDNA D1-D3 (> 3.5% p-distance, > 5.4% dissimilarity) had a much greater genetic divergence than the 18S rDNA (> 0.4% p-distance, > 0.5% dissimilarity). These results were generally in accordance with other centric diatoms, Cyclotella, Discostella, and Stephanodiscus (Ki 2009, Jung et al. 2010). These results suggest that the 28S rDNA may be treated as a more suitable marker for species- level taxonomic distinctions of Chaetoceros.