Citation Laws and Quasi-Impact Factor on Innovation Studies in Korea*
Author: Park Jung-Min, Seol Sung-Soo, Namm Su-Hyeon
Organization: Park Jung-Min; Seol Sung-Soo; Namm Su-Hyeon
Publish:
Journal of Information Management
Volume 40, Issue4, p135~150, 30 Dec
2009
ABSTRACT
Existing bibliometric laws have been established on the basis of well defined science journals with a long history. However, the history of technology innovation research in Korea is young and the scope of the research is diverse compared with other fields. The main purpose of this research can be summarized as follows : Can the traditional bibliometric laws be used to explain the young and diverse data derived from technology innovation studies in Korea. Second, we want to compare the explain ability of the power law, compared with the traditional laws in the field. Third, we propose a quasi index related to the well-known impact factor to measure the contribution of a journal or a group of journals to the development of innovation research in Korea. We confirmed Lotka's and Bradford's laws which are used to measure the productivity of researchers, but we could not support the validity of Price's Square Root law as Nicholls (1998) could not. On the citations to journals, Garfield's laws is not observed. However, the power law fits well the citations to author, journal, article, and book. The estimated parameters between 1.6 and 3.5 are similar to the values in the range of 1.5 and 3 in previous studies. Finally the quasi index shows that the influence of international leading journals on innovation research in Korea is weaker than on innovation studies in the world.
계량서지학은 오랫동안 잘 정의된 과학저널의 기초 위에서 구축되었다. 그러나 한국의 기술혁신연구의 역사는 짧고 다른 분야에 비해 연구범위도 다양하다. 따라서 우리는 한국의 기술혁신연구에서도 전통적인 계량서지학의 법칙들이 적용되는지를 고찰하고자 한다. 한편 전통적인 법칙과 함께 멱함수법칙의 설명력을 비교한다. 영향력지수와 관련하여, 한국의 기술혁신연구에 기여 정도를 측정하는 의사 영향력지수를 제안한다. 연구자의 생산성을 측정하기 위해 사용되는 Lotka's law와 Bradford's law가 적용됨을 확인했으나, Nicholls(1998)와 마찬가지로 Price's Square Root law가 유효하지 않았다. 저널에 대한 인용의 측면에서는 Garfield의 법칙 역시 적절하지 않았다. 다만 멱함수 법칙은 저자, 저널, 논문 및 단행본 모두에서 잘 적용됨을 확인하였다. 이전 연구에서 추정된 1.5에서 3사이의 범주와 유사하게 한국의 기술혁신연구에서도 1.6에서 3.5사이의 수치가 추정된 것이다. 의사 영향력지수(quasi-impact factor)를 본 연구에 적용한 결과, 피인용도가 높은 저널 집단의 한국기술혁신연구에 대한 영향력은 국제적 기술혁신연구에 비하여 그 정도가 약한 것으로 나타났다.
KEYWORD
Citation Law
,
Lotka's Law
,
Power Law
,
Korean Innovation Study
,
Quasi-impact Factor
Bibliometric objects such as authors' contribution, coauthoring, citation, are complex in nature. The complexity comes from a large number of constituents, a lack of controlling and coordinating entity, and non-linear dynamics(Halpin et al. 2007). Moreover, the themes of innovation management studies in the world are interdisciplinary; engineering management, economics, marketing, forecasting, operations management, organizational behavior, technology innovation, and finance(Merino et al. 2006). On the other hand, the history of technology innovation research in Korea is young and the scope of the research reflects the needs for rapid domestic economic development, making the research area more complex by adding information technology and communication, venture, valuation of technology, and technology policy(Namn et al. 2005).
Are there any bilbiometric laws which are applicable to technology innovation research in Korea whose publication both began in the early 1990's and covered a wide spectrum of research disciplines? We note that the existing bibliometric laws have been derived from well?established, western science journals which have a long history. If the laws are valid for technology innovation in Korea, we can claim that the journal publication of the area is stabilized as other science journals in the west are in the maturity stage. As a separate issue from the bibliometric laws, we are interested in deriving a quasi index which is similar to the well known impact factor to measure the contribution of a journal or a group of journals to innovation research in Korea.
In bibliometric research we have several representative laws governing the productivity of researchers and the distribution of academic journals. The most prominent laws on research productivity are the Lotka's(1926) Law and the Square Root Law by de Solla Price (1963), while Law of Scattering by Bradford( 1934; 1985) and the Law of Concentration by Garfield(1972) are well known for explaining the distribution of journals.
The question we raised is that the laws above can be applied to such citation attributes as authors, journals, articles, and books which are cited in technology innovation publications in Korea. If they are not applicable to them, are there any other patterns to explain the citation attributes? Exploration for the answer is the purpose of this research. We use all the citation data cited by research papers of innovation studies in Korea.
We first describe the summary statistics of the data to be analyzed. Next, in the analysis section, we examine the validity of the traditional laws in research productivity and the distribution of journals. Finally, we test the fitness of the power law for the citation data of innovation studies in Korea.
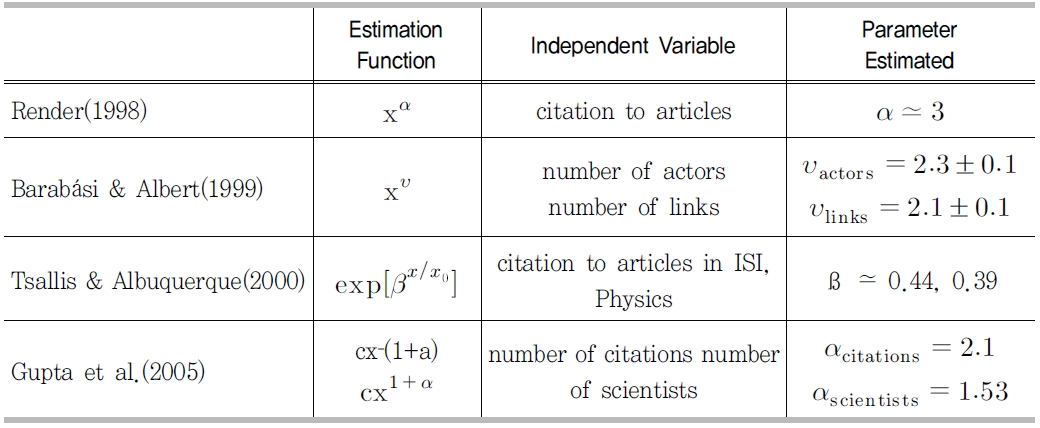
Previous research works show that power laws are observed in diverse complex networks of such well-established fields as physics, biology, and sociology. A complex network system, defined as a set of nodes and links connecting constituent nodes, is frequently employed for the analysis of the distribution of nodes and links. Power law is a general function which does not possess the normal distribution characteristics, but decreases rapidly as the value of an independent variable increases. This peculiar characteristic is explained by growth of nodes by time and preferential attachment of a node to other nodes Albert and Barabasi(2002).
For the analysis of social relationships, Barabasi & Albert(1999) showed that the networks of both Hollywood actors and WWW follow the power law. They also compared the parameters across networks. Jeong et al.(2000) applied the power law to the cell network.
Amaral(2000) also showed that the number of passengers at US airports can be explained by the power law. A coauthor network analysis by Barabasi et al. (2001) also shows this law. In Web 2.0 environment, both collaborative tagging system which is applied in bookmarking services(Halpin et al. 2007; Dardy 2008) and the readership and editing in Wikipedia( Hardy 2008) are shown to follow power laws. Zipf(1949) shows in the socalled Zipf's law that the distribution of the most frequently used words follows the power law. Distributions of cited authors(Laherrere & Sornette 1998) and cited articles(Render 1998) are also shown to possess the power law. Tsallis & Albuquerque(2000) proposed a new distribution called the Tsallis statistics, which shows the relationship between the number of citations to a journal article and the time elapsed after the publication of that article. The distribution also follows the power law, but after a certain period of time, the number of citations decreases rapidly. Gupta et al.(2005) analyzed the citations to a group of physicists and chemists in Brazil, and confirmed the Tsallis statistics. Podlubny(2005) tested the Tsallis statistics in several research areas in the US, but the shapes of the distribution differ from area to area.
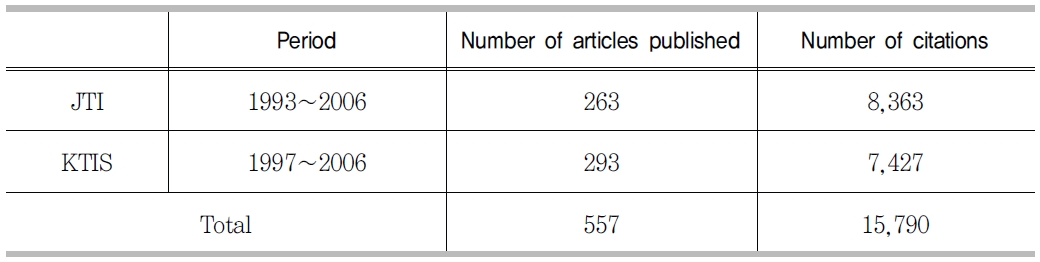
There are two major journals as outlets for academic papers on technology innovation in Korea: the Journal of Technology Innovation(JTI) and the Korea Technology Innovation Society(KTIS). We covered all the articles(557) and citation data(15,790) published in the two journals from 1993 to 2006. Of course all the technology innovation related research is not published in the two journals. We ignore other journals since these are the representative ones and we want to make the analysis simple. Namn, Park and Seol(2005) and Seol & Park(2008) are related researches.
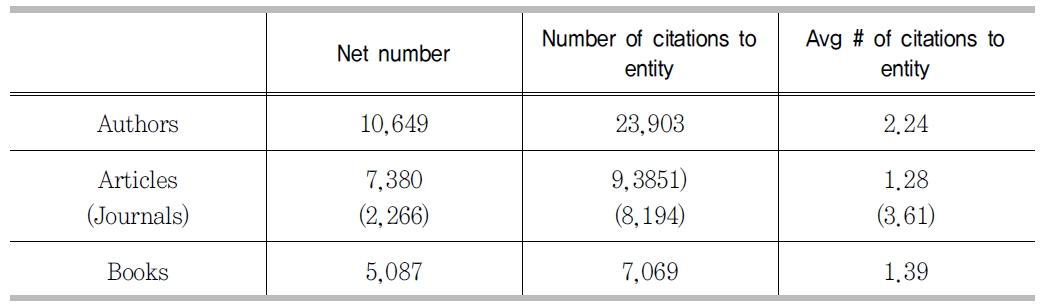
. The total number of citations in the period is 15,790, of which 9,385 citations come from 7,380 journal articles, conference papers, and chapters of books. As shown in
, the number of citation to 2,266 journal articles is 8,194, and 5,087 books are cited 7,069 times. A total number of 10,649 authors are cited 23,903 times.
] Distribution of number of citations to different objects
Distribution of number of citations to different objects
Note: Articles include papers, conference papers, and chapters of edited books
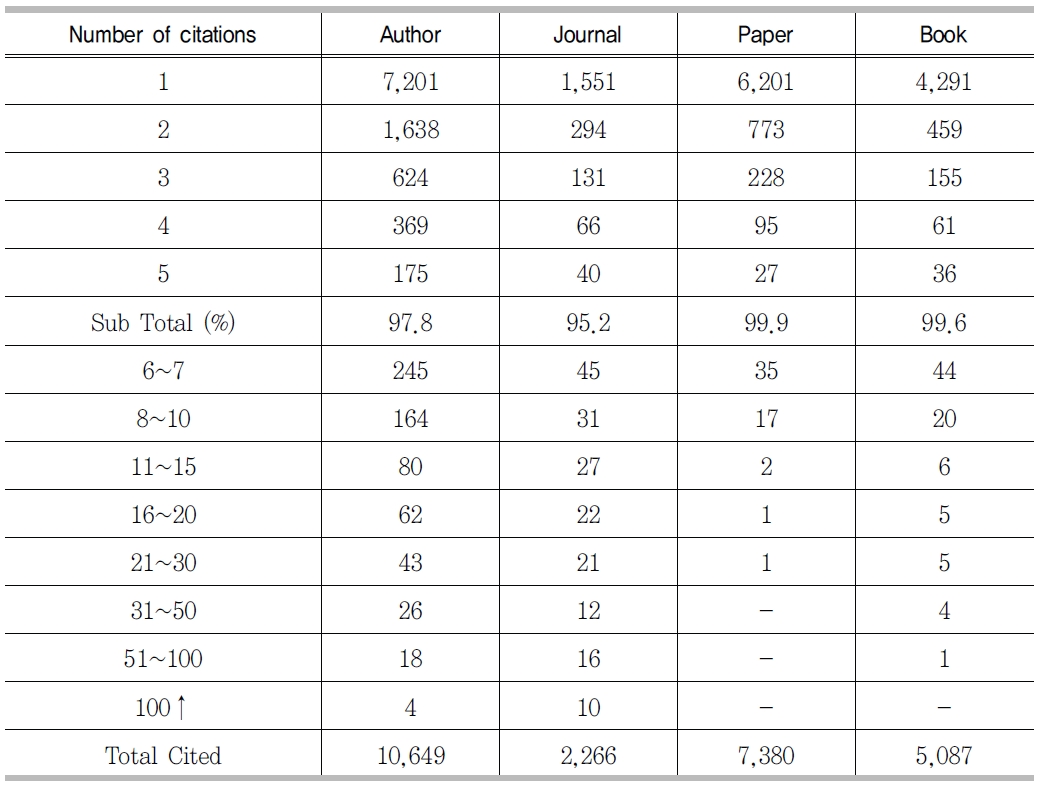
shows the distribution of the frequency of citations to authors, journals, and books. Most of the authors, journals, and books received less than 5 citations, but a few of them got over several hundred citations.
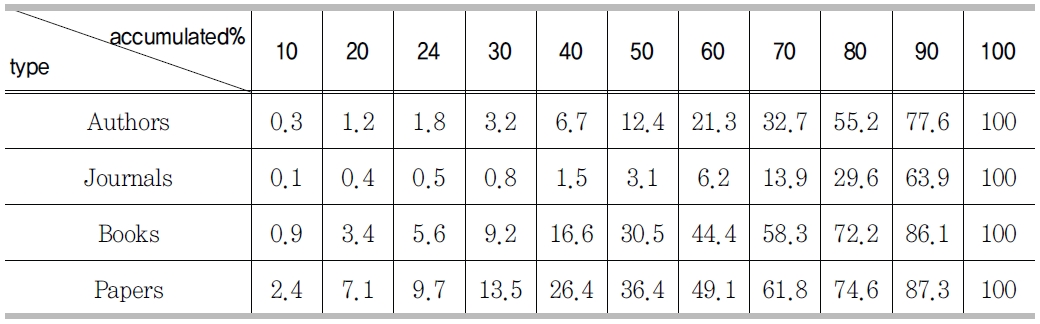
When we sort the citation data in decreasing order, we can see what percentage of each type of citation contributes to the total number of citations. Interpretation of
is as follows: 0.3% of all cited authors received 10% of the total citations to authors, and 13.5% of all cited articles obtained 30% of the total citations to articles.
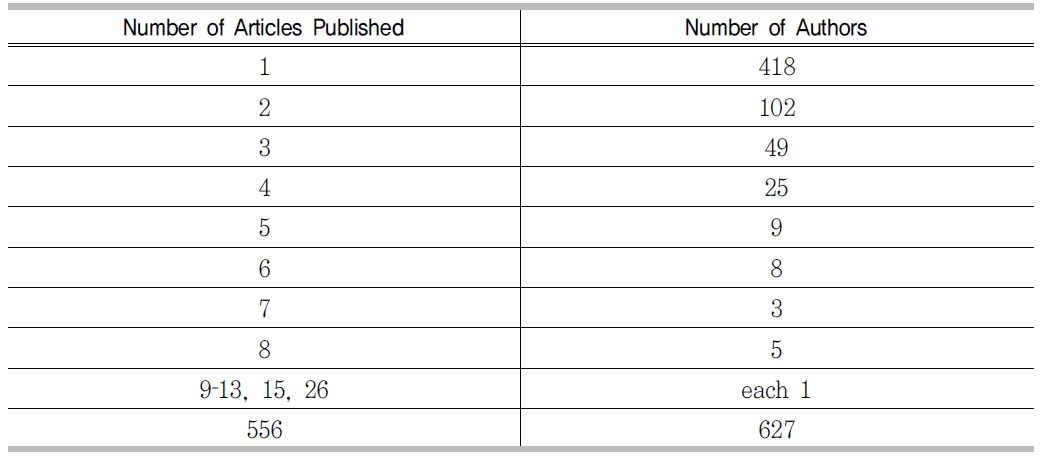
Lotka studied the distribution of authors with respect to the number of articles published. That is he examined the corresponding number of authors who published an article, two articles, and so on. He proposed the mathematical relation, y×xα, where y is the number of authors who published x articles, and C is a constant and α is a parameters. He called it Lotka's Law.
Based on our data, a total number of 556 articles and 627a uthors who published those articles are described in
. Regressing the data of
on Lotka's Law, we have the following relation. Since the relation explains 91% of variations in the data, we can say that technology innovation studies in Korea satisfy Lotka's Law. In fact, Lotka's Law is the same as the Power Law, which is described in section 3.3 in detail.
Number of Articles9.622 * Number of Authors = 365.65 R2 = 0.9142
Price's Law says that the square root of the total number of authors in a specific research area produces half of the total output. We test whether the law applies to technology innovation studies in Korea too. In our case we have a pool of 627aut hors. The square root of them is 25.04. However, we have 24 authors who published more than 6 articles. The 24 authors calculated is equivalent to 3.8% of the total number of authors, and their output occupies only 18.9% of the total of 556 articles. Since the number of authors who published 3 or more articles is 107, and they contributed 44.8% of the total output, our data does not explain the law well. Nicholls(1988) also was not able to confirm the law.
When we use the data of citations to authors to see whether Price's Law is working, we can rephrase the law as follows: The square root of the total number of cited authors receives half of the total number of citations to authors. In this case we have a total of 10,649 cited authors and the square root of this number is 103.19. On the other hand, the number of most frequently cited authors who received more than 20 times of citations is 101, which is only below 1% of the total 10,649. Therefore we can conclude that Price's Law is not applicable to this case.
Garfield(1972) analyzed about a million citations from 2,200 science journals listed on the SCI. He observed that 24% of the cited articles came from 25 academic journals. He called the phenomena the Law of Concentration. To see whether the law works for our case let's look at the 24% column in
. There we have 9.7% or 713 cited articles. These articles come from 249 journals and 47 books. When we ignore the chapters in edited books, we have 650 articles covered in journals. Thus, from the citation point of view our data does not confirm Garfield's Law of Concentration.
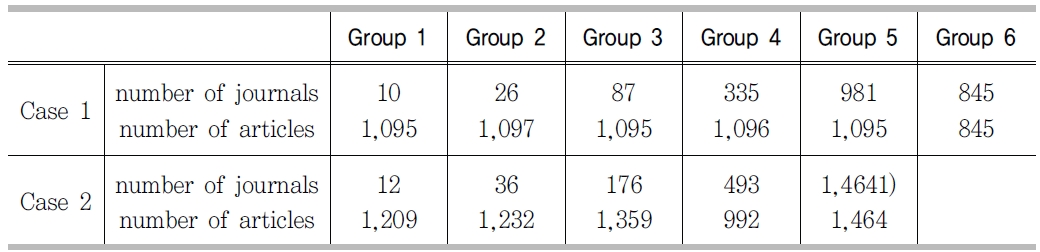
3.2.1 Bradford's Law
The Law of Scattering by Bradford (1934; 1985) stipulates that when a set of journals in a specific research subject is sorted by relevance, the number of journals listing a certain number of articles is distributed as 1: b : b2 : b3 : ..., where b refers to the Bradford's multiplier. To test the law, we use the data in
. For the grouping, we use two cases of the number of articles cited: about 1,095 and 1,200. Based on the first case and ignoring the outlier of Group 6, the number of journals cited (Jn) in Group n is approximated as (3.1)Jn-1. In the similar way, the second case can be formulated as Jn = (3.1)Jn-1. From these two cases, we can deduce that the Bradford's multiplier regarding the number of journals cited in the Korean innovation research lies between 3 and 3.5.
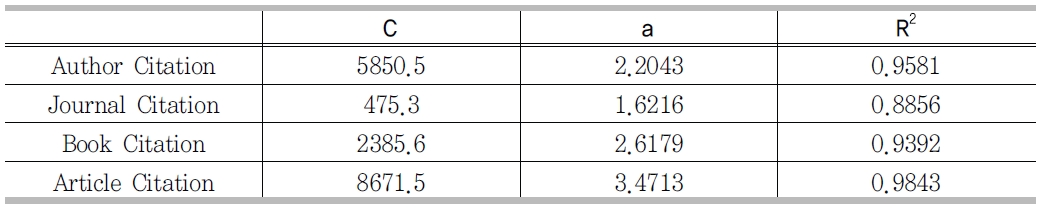
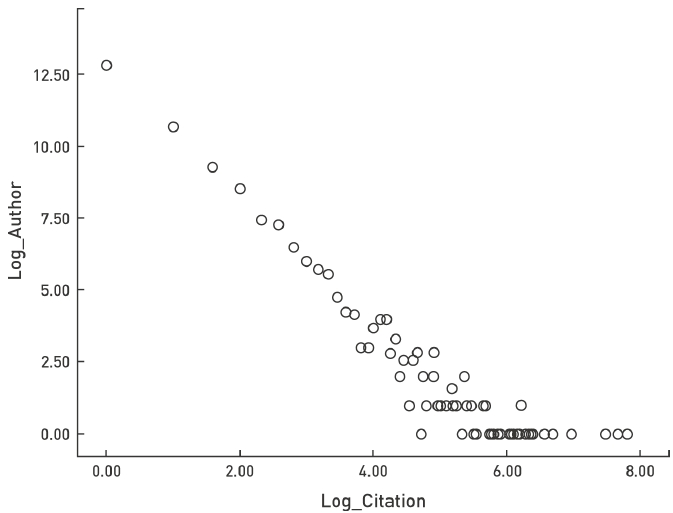
As was described in the previous section, the power law explains citation related data better than other bibliometric laws. Therefore we will use the power law to examine the citation data of innovation studies in Korea. Here we define the independent variable x as the number of citations and the dependent variable as the number of the objects cited. The object can be an author, article, journal, or book.
we have the smallest value of a, 1.62, for journal citations, and the biggest value of 3.47f or article citations. Since the objects of cited authors, journals, books, and articles follow the power law, the shapes of the functions of each object are similar. As an example, the log transformed distribution of the number of citations with respect to author is shown in . A simple linear regression analysis shows that the coefficient is -1.78.
Regarding the issue of citations, what are the relationship among the number of citations to journals and the number of articles cited? We can easily deduce that if a journal which contains articles cited more, then the journal is more frequently cited than the other journals which contain articles cited less. However, can we claim that if a journal is more frequently cited, does it mean that the article in that journal attracts more citations in average?
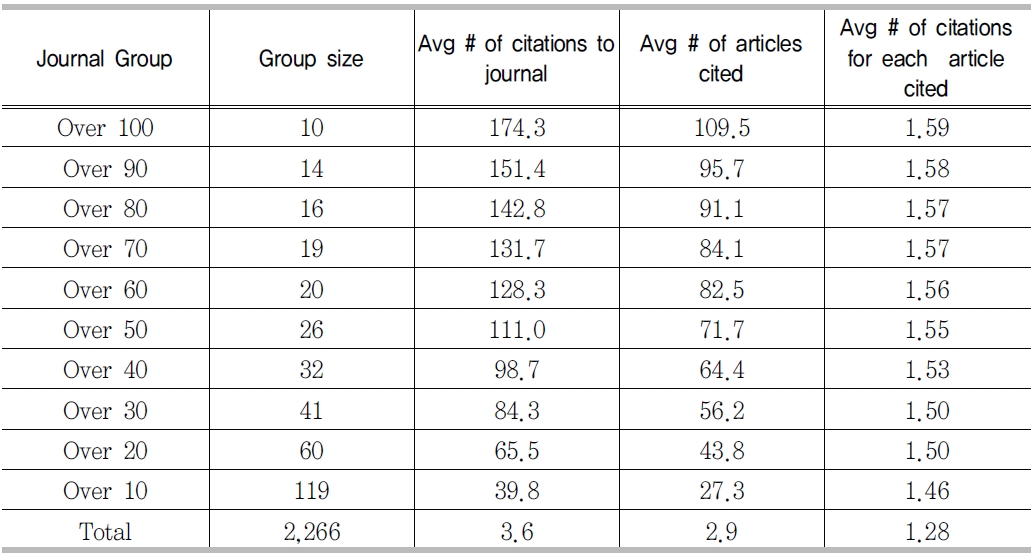
To answer the question we make groups of journals based on the number of citations to the journals in descending order. The meaning of columns in
is as follows: Column 1 refers to the group of journals which attract the specified number of citations. For example, "over 90" indicates the group of journals cited over 90 times. Column 2 refers to the number of journals in that group. Thus, the number of journals in group "over 90" is obtained by adding the number in group "over 100" and the number of journals cited between 89 and 80 times. Column 3 represents the average number of citations to the journals in that group and it is derived by dividing the total number of citations to the journals in that group divided by column 2. Column 4 refers to the average number of articles, which is calculated by dividing the total number of articles cited at least once in the group by column 2. Column 5 is the average number of citations per article cited at least once, and it is obtained by the ratio of column 3 to column 4. Note that the denominator of the ratio of column 5 is the number of articles cited at least once, which first of all makes the ratio different from the impact factor.
] Grouped indices derived from citation statistics
Grouped indices derived from citation statistics
As is indicated in
, if there are more citations, we have a smaller number of journals, but we have a larger number of articles cited, and the average number of citations to articles becomes bigger.
An interesting result is that even though there are 10 journals which are cited more than 100 times, the average number of citations to articles in the group is only 1.59. It means that on the average each article from the most influential journal group on the innovation research in Korea is cited only 1.59 times. Also note that the overall average number of citations to articles is 1.28.
How to interpret these figures? Since the average number of citations for each article cited for each journal Group and the impact factor1) are built from different concepts, a direct comparison of the two is meaningless. For that reason we call Column 5 quasi-impact factors. In fact, when we focus on a specific journal, the index conveys the similar concept to impact factor. But when we make a group of journals, the resulting index becomes a composite index. Based on the two indices, we can derive the following implications.
Since we compiled our data from 1993-2006 as in
& 3>, we use the impact factor of influential Research Policy in 2006, which is 2.211. The impact factor can be considered to be a contribution factor to the innovation studies in the world, especially in Europe and America. On the other hand, our data show that the number of citations to Research Policy for 1993-2006 is 470, the number of Research Policy articles cited is 264, and the average number of citations for each Research Policy article cited is 1.78.
In the current study we used the time span of 1993 to 2006 for our study and only counted the articles cited at least once. Considering these, it is easy to see the values in Column 5 are overvalued, compared with the values to be derived when we apply the rules of impact factor. It implies that when we only consider the citations from the two innovation technology journals published in Korea, the contribution factor of the leading group consisted of major journals is significantly lower than that of top journals such as Research Policy in the international innovation research field. This confirms the unique, diverse, and interdisciplinary nature of innovation research themes in Korea.
1) The impact factor of a journal measures the degree of influential power of a journal on related research area by comparing the number of citations toward the journal during nth year with the number of articles published in that journal during a certain number of previous years, usually (n-1)th and (n-2)th years.
The main purposes of this research are as follows: First we wanted to test whether the traditional bibliometric laws can be used to explain the data derived from the technology innovation studies in Korea. Second, we wanted to compare the explain ability of the power law, compared with the traditional laws in the field.
The major results of our analyses are summarized in the following: We confirmed Lotka's Law which is used to measure the productivity of researchers, but we could not support the validity of Price's Square Root Law as Nicholls (1998) could not. On the citations to journals, Garfield's Law is not observed.
However, the power law fits well to the citations to author, journal, article, and book. The estimated parameters between 1.6 and 3.5 are similar to the values in the range of 1.5 and 3 in the previous studies. We can view the citation relationship as a set of links among the nodes such as authors, articles, and so on. Once we know the nature of the distribution of network elements, we can deduce the existence of hub and connector elements in the network. Also the notion of "the fitter, the better" can be explained by the power law.
Our finding confirmed that the power law works well for the citation data of young and diverse research of innovation studies in Korea, whereas existing bibliometric laws have been established on the basis of well?defined science journals with a long history.
We also proposed a quasi-impact factor to compare the contribution of major journal group to innovation research in Korea and the world. The quasi index or the average number of citations to articles cited is 1.59, and the overall average is 1.28. The figures are significantly smaller than the impact factor, 2.211, of Research Policy in the year 2006, even though our quasi impact factor is overestimated by considering the much longer time span and by only including articles cited at least once for the calculation.
For the analyses, we used our proprietary database, not the database from ISI Thompson, which is generally used for bibliometric research. Since we focused on the technology innovation studies in Korea, the results of our analysis can not be generalized to other areas and countries. In the future we need to expand the area and coverage of data for the generalization.
참고문헌
1.
Albert R, Barabasi A.L
2002
Statistical Mechanics of Complex Networks
[Reviews of Modern Physics]
Vol.74 P.47-97
2.
Barabasi A.L
2002
Linked: the New Science of Networks
3.
Barabasi A.L, Albert R
1999
Emergence of Scaling in Random Networks
[Science]
Vol.286 P.509-512
4.
Barabasi A.L, Jeong H, Ravasz R, Neda Z, Vicsek T, Schubert A
Evolution of the social network of scientific collaborations
5.
Bradford S.C
1985
Sources of Information on Specific Subjects
[Journal of Information Science]
Vol.10 P.173-180
6.
De Solla Price D.J, Nelson C.E, Pollock D.K
1970
Citation Measures of Hard Science Soft Science Technology and Nonscience;Communication among Scientists and Engineers
P.3-22
7.
Garfield E
1972
Citation Analysis as a Tool in Journal Evaluation
[Science]
Vol.178 P.471-479
8.
Gupta H.M, Campanha J.R, PESCE R.A.G
2005
Power?Law Distributions for the Citation Index of Scientific Publications and Scientists
[Brazilian Journal of Physics]
Vol.35 P.981-986
9.
Halpin H, Robu V, Shepherd H
The Complex Dynamics of Collaborative Tagging
[Proceedings of the 16th International Conference on World Wide Web]
P.211-220
10.
Hardy D
Oct 2008
Discovering Behavioral Patterns in Collective Authorship of Place?Based Information
[Proceedings of the 9th International Conference of the Association on Internet Researchers]
11.
Laherrere J, Sornette D
1998
Stretched Exponential Distributions in Nature and Economy: “Fact tails” with characteristic scales
[European Physical Journal B]
Vol.2 P.525-539
12.
Lotka A.J
1926
The Frequency Distribution of Scientific Productivity
[Journal of the Washington Academy of Sciences]
Vol.16 P.317-323
13.
Namn S.H, Park J.M, Seol S.S
2005
Quantitative Analysis of Knowledge Flow Technology Innovation Research in Korea
[The Journal of Korea Technology Innovation Society]
Vol.8 P.337-359
14.
Nicholls P.T
1988
Price's Square Root Law: Empirical Validity and Relation to Lotka's Law
[Information processing & management]
Vol.24 P.469-477
15.
Podlubny I
2005
A Note on Comparison of Scientific Impact Expressed by the Number of Citation in Different Fields of Science
[Scientometrics]
Vol.64 P.95-99
16.
Render S
1998
How Popular is Your Paper? An Empirical Study of the Citation Distribution
[European Physical Journal B]
Vol.4 P.131-134
17.
Seol S.S, Park J.M
2008
Knowledge Sources of Innovation Studies in Korea - A citation analysis
[Scientometrics]
Vol.75 P.3-20
18.
Seol S.S, Namn S.H
November 2-5 3-14
Innovation Studies in Korea: Origins Branches and Activities
[Proceedings of The 1st China Korea Conference on ?Innovation Studies]
19.
Tsallis C, Albuquerque M.P
2000
Are Citations of Scientific Paper a Case of Nonextensivity
[European Physical Journal B]
Vol.13 P.777-780
20.
Zipf G.K
1949
Human Behaviour and the Principle of Least Effort: An Introduction to Human Ecology
21.
Zipf G.K
2006
25 Years of Technovation: characterisation and evolution of thejournal
[Technovation]
Vol.26 P.1303-1316
이미지 / 테이블
[
<Table 1>
]
Previous studies on power laws
[
<Table 2>
]
Descriptive statistics of data used
[
<Table 3>
]
Citation statistics (1993-2006)
[
<Table 4>
]
Distribution of number of citations to different objects
[
<Table 5>
]
Distribution of number of citations
[
<Table 6>
]
Number of authors vs number of articles by them
[
<Table 7>
]
Groups of journals with similar number of articles
[
<Figure 1>
]
Distribution of authors and the number of citations
[
<Table 8>
]
Parameters estimated and R2
[
<Table 9>
]
Grouped indices derived from citation statistics