Epoxy resins in the electric insulation field have been used together with micro scaled silica fillers. It is called a filled epoxy or a micro filled epoxy. Because nano-fillers have even more advantages, the conventional micro fillers can be replaced with these nano-fillers. Polymer nano composites include a small amount of nano-fillers, up to 1-15 wt?%, and contribute to the light weight, compactness, and low facility and system costs. They will be usefully applied to the next generation of mold insulation and solid insulation substations [1]. Therefore, it can be expected that the use of polymer nano composites as a type of industrial material will increase in the future. In particular, epoxy resins are applied to dry mold transformers and to power CT/PT. In addition, solid insulated switchgears and gas insulated switchgears require a large insulation spacer in order to support the internal conductors. In general, epoxy resin is essential for heavy apparatus systems, not only for electric rotating machinery, but for static mold machinery as well. The epoxy resin needs to be filled by certain micro scaled fillers (silica or alumina) in order to obtain a low thermal expansion needed by some conductors, such as aluminum or copper [2]. The conventional filled epoxy with low thermal expansion avoids the exfoliation that occurs between conductors caused by thermal cycles or epoxy casting sections. In addition, it is required due to the heat generated during the operation of heavy apparatuses. The mechanical and electrical properties of the insulation materials at high temperatures (about 100℃) determine the performance of these apparatuses, and that assures a further step in the realization of environmentally friendly heavy apparatuses by using it to create solid insulation systems that do not use SF6 gas [3].
2.1 The preparation process of the ENMC
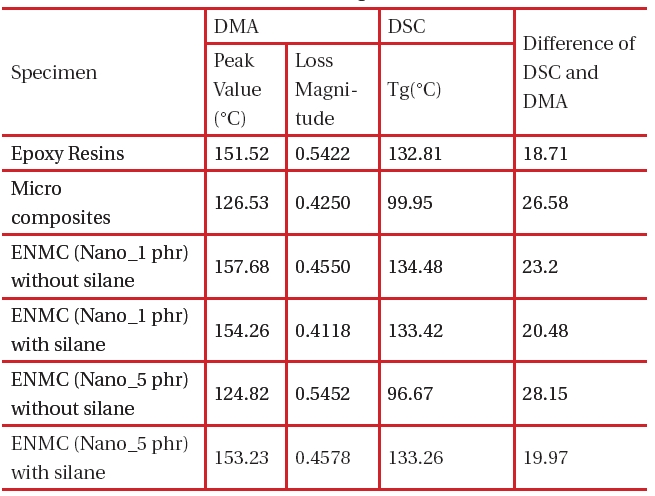
As noted in Table 1, the epoxy resins that are not made with nano-fillers are referred to as conventional epoxy resins and the composites in which the conventional micro scaled epoxies are made with nano-fillers are referred to as epoxy nano-and-micro mixture composites (ENMCs). Three different ENMCs were fabricated with the composition ratios shown in Table 1.
As this table shows, all of the epoxies were made with the same basic ratios of resin, hardener, and microparticles. The three different ENMCs are differentiated by nano SiO2 concentrations of 0.5, 1, and 5 phr. In addition, this study looked at the effects of the silane processing (silane coupling agent: KBE_903_2.5 phr) for the micro composites.
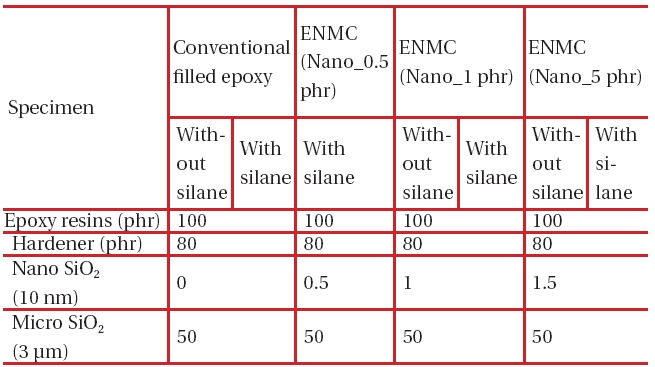
The conventional filled epoxy and the composition ratios for the nano and micro composites.
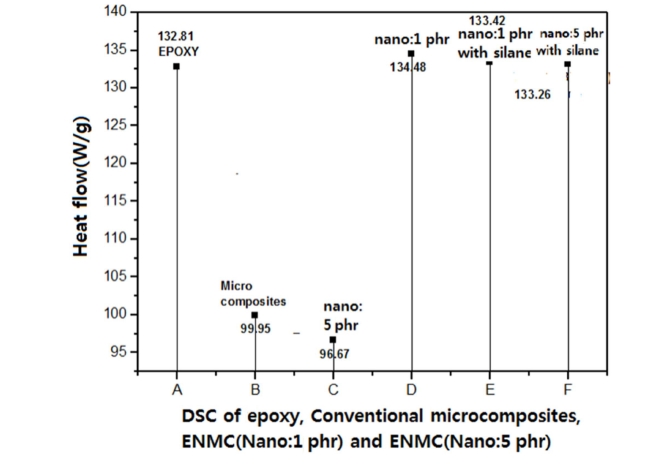
Figure 1 illustrates the results of the measurement of the glass transition temperature using a differential scanning calorimeter (DSC). Also, it shows the comparison and evaluation of the peak of Tan δ , which is the result of DMA measurements. The glass transition temperature of original epoxy resins and micro composites measured by using the DSC were 132.82℃ and 99.95℃, respectively, a difference of 32.87℃. In the conventional micro composites, the filling was performed using 50 phr of 3 μm SiO2 particles. In the case of the 1 phr ENMCs, the results of the temperatures presented by the composites with and without the silane processing were 133.42 and 134.48℃. In the case of the 5 phr ENMCs, the results of the temperatures presented by the composites with and without the silane processing were 133.26 and 96.67℃.
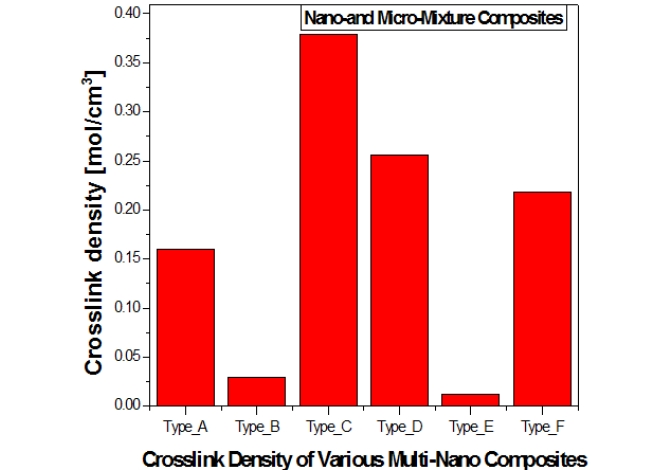
Based on the results of the dynamic mechanical analyser (DMA) measurements, the cross-linking density presented in the glass transition temperature illustrated in Fig. 2 was introduced using the following formula proposed in the study by Lakshmi et al. [4]:

where ρ is the cross-linking density presented by mol/cm3, G' is the shear storage modulus of an epoxy system above the glass transition temperature, R is a universal gas constant (8.314472 JK-1 mol-1), and T is the absolute temperature (273.15 K) in which the experimental modulus was determined. As the cross-linking density decreases, the glass transition temperature decreases. The equation shows that the cross-linking density correlates directly to the glass transition temperature.
The cross-linking density of the original epoxy resin was 0.15971 mol/cm3, and the glass transition temperature was 132.82°C. However, in the case of the 1phr ENMC, the crosslinking densities of the composites without and with the silane processing were 0.37873 and 0.25593, respectively, with the glass transition temperatures at 134.48 and 133.42°C, respectively. The differences of the cross-linking density between the original epoxy resin and the 1 phr ENMCs were large, 137.1% without the silane processing and 60.2% with. There are large differences in the mobility between the molecular chains of the original epoxy resin and the ENMCs. It can be seen that the composition between the particles of the ENMCs was relatively dense. As a result, it affects their thermal and mechanical properties and electrical insulation breakdown significantly at some high temperature sections. However, in the comparison of the cross-linking density between the original epoxy resin and the conventional micro composites, the difference in the crosslinking density was a low 435%. It can be considered that the interface was fatally weakened by a loose coupling between the micro filler and the polymer matrices as the micro SiO2 particles were mixed into the epoxy resins. In addition, it can be seen that it directly affects the mobility of the polymer chains. As a result, the glass transition temperature was only 99.95°C. The cross-linking densities of the 5 phr ENMCs with and without the silane processing were 0.21837 and 0.01247, respectively. There is a large 1,651% difference between these two values. It can be considered that there exists some unhardened reactive matrices, and the cohesion of the nano particles was performed on a large scale, as the homogeneous dispersion of nano particles was insufficient [5]. As a result, this represents a large increase in the mobility and a significant weakness in the interface caused by the cohesion of particles. If the cohesion between the loose coupling between the nano particles and the matrices and the particles occurs, the cross-linking will be weakened, and the glass transition temperature will be decreased.
Thus, the glass transition temperature decreased due to the concentration of stresses around the cohesive nano-fillers [6,7]. However, in the case of the sample with the silane processing, although it shows some cohesion due to the strengthening of the coupling force between the surface of the nano particles and organic polymer molecules, it disturbs the mobility through constraining the chains of the polymer resins by such nano and micro particles due to the improvement in its interface which leads to improved mechanical and electrical properties. The cross-linking density is an important factor that controls the glass transition temperature for a normal thermosetting polymer setting system [5]. Evora and Shukla [5] represent a much greater increase in the limitation of resin networks according to the decrease in particle sizes, and the glass transition temperature will greatly increase for the small particles. It has been reported that a certain weak dispersion causes a decrease in the glass transition temperature according to the increase in the accumulation of particles. In the case of the 1 and 5 phr ENMCs, the small amount of SiO2 particles represent uniform dispersions between the micro particles. Thus, it is necessary to study the issue through changing the phr in a more specific manner in order to obtain improved properties. The molecular weight for the glass transition temperature, the cross-linking density [8], the free volume [9], and the nano clay surface adhesion and epoxy interfacial layer [9] all affect the glass transition temperature.
[Table 2.] The symbol Table for Figure 2.
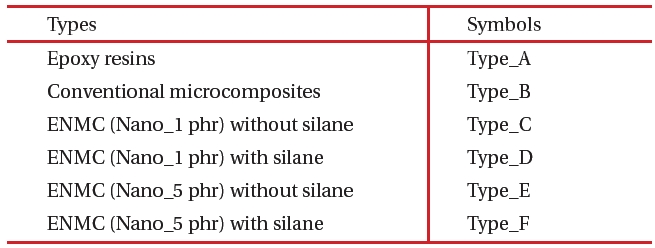
The symbol Table for Figure 2.
3.2.1 The DMA
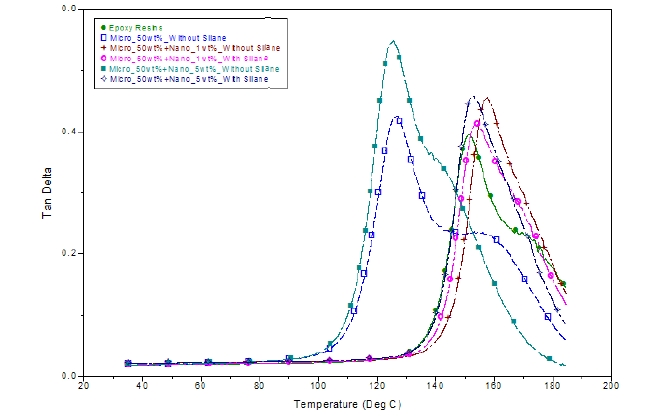
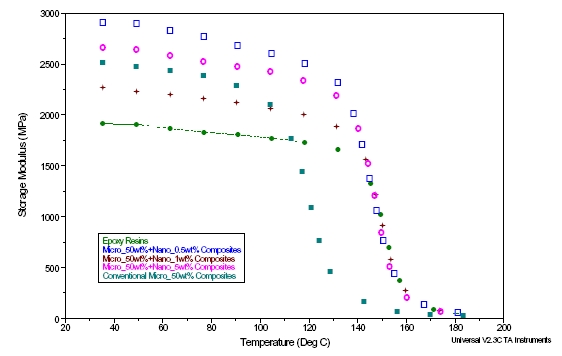
Figures 3 and 4 illustrate the DMA properties of the original epoxy resins, the conventional micro composites, and the ENMCs. Figure 3 shows the change in the storage modulus according to the changes in the temperature in which a glass state region before the glass transition temperature represents a more improved modulus than the original epoxy resin. However, in a rubbery state, there are conflicting results, compared to that of the glass region. Specifically, in the case of the conventional micro composites, it decreased by 81.3%. Also, the 5 phr ENMCs without the silane processing showed a huge decrease, as much as 920%. Regarding the different cases without and with the silane processing, the rubbery state of the 1 phr ENMCs demonstrates improvements in the storage modulus by as much as 137.1% and 60.24%, respectively. The results of the cross-linking density, as illustrated in Fig. 2, were obtained by measuring the DMA, where it is not connected to the hardness of the glass state of the storage modulus and shows an agreement in the results for a rubbery state that exceeds the glass transition temperature.
The Tan δ is a conversed value that represents a difference in temperature. The temperature difference of the 1 phr ENMCs was 31.15℃ compared with the conventional micro composites. The 1 phr ENMCs is a composite that shows an excellent thermal property.
Regarding the large increase in the storage modulus in a rubbery state region based on these results, it can be definitely considered that the homogeneous dispersion and the excellent interfacial coupling force in a mixture state of the micro and nano particles limits the mobility of the epoxy molecules [10-13]. This can be detected in the cross-linking density. In this study, the cross-linking densities of the conventional micro composites and 1 phr ENMCs were 0.0298 and 0.37873, respectively. Thus, the difference can be considered as a confirmed result, because the cross-linking density showed a larger level, 1,170%, than the others.
[Table 3.] The DMA storage modulus for the ENMCs.
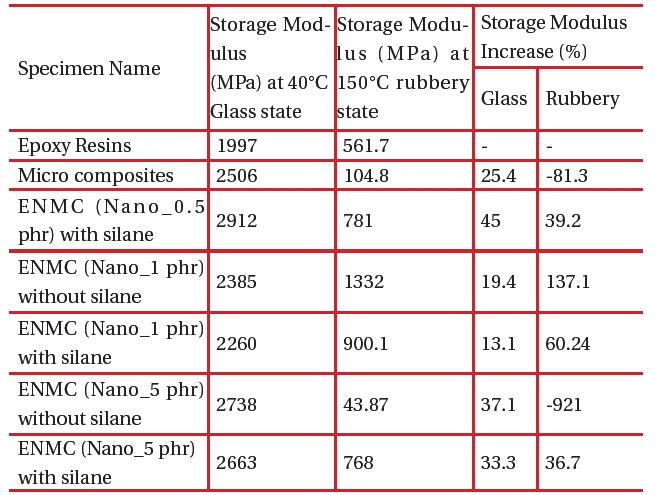
The DMA storage modulus for the ENMCs.
[Table 4.] The Tan δ of the DMA for the ENMCs. (Table 4. The data table for Figure 4)

The Tan δ of the DMA for the ENMCs. (Table 4. The data table for Figure 4)
[Table 5.] The Weibull plot of the bending strength for the ENMCs.
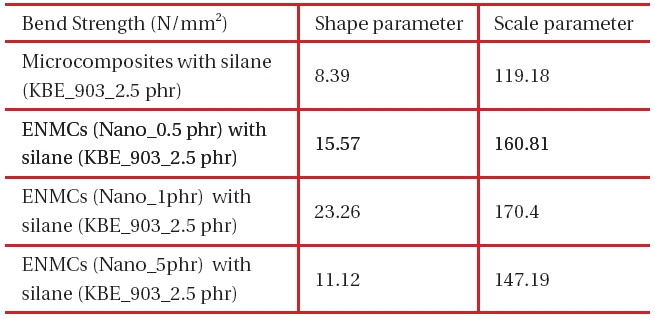
The Weibull plot of the bending strength for the ENMCs.
3.2.2 The bending strength
Table 5 shows the bending strengths of the original epoxy resins, the micro composites for the conventional micro fillers with the silane processing, and the 1 phr ENMCs with the silane processing using the Weibull plot. The shape parameters of the bending strengths of the original epoxy resins and the 1 phr ENMCs were 8.39 and 23.26, respectively. This shows that the 1 phr ENMCs have a higher mechanical property with a higher homogeneity than that of the original epoxy resin, because its gradient is 2.81 times larger than the original epoxy resin. The large value in the shape parameter means the homogeneity characteristic is a fitted line in the Weibull plot. The larger gradient in the fitted line represents a more homogeneous dispersion; this will present some advantages in the design of insulation systems for heavy electrical equipment. The scale parameters that correspond to 63.2% in the Weibull plot show the strengths of 119.18, 160.81, 170.4, and 147.19 N/mm2 for the original epoxy resins, conventional micro composites, SiO2_10 nm filled by 1 phr, and EMNCs (Nano_1 phr), respectively. The ENMCs, compared to the original type, show an improvement in the strength by as much as 42.97%.
Based on these results, the nano scaled SiO2 particles show much smaller gaps and much larger interfacial areas than that of the micro scaled SiO2 particles. Therefore, the interfacial areas of the nano scaled SiO2 particle epoxy resins play an important role in the insulation breakdown strength due to the huge interfacial areas. In conclusion, it is evident that the nano-and-micro mixture composites have stable properties in the homogeneity of bending strength and breakdown strength [14].
This study fabricated micro composites filled by micro particles and mixture composites filled by nano and micro particles based on epoxy matrices. This study obtained the following thermal and mechanical properties from these samples:
In the thermal property, the cross-linking densities were obtained using DSC and DMA glass transition temperatures. The ENMCs had excellent thermal properties. The mechanical properties were investigated by DMA and bending strength. Based on the results of the storage modulus of the DMA, the 0.5 phr in the glass and rubbery states showed improvements at 45% and 137%, respectively, compared to the original epoxy resin.