The use of electrical energy has increased in the 21st century due to increasing standards of living. Therefore, to supply electric power safely and efficiently in the future, it is important to requisition extra high voltage [1]. Therefore, the insulating material in extra high voltage cables requires significant improvement. Polymer insulating materials, such as cross linked polyethylene (XLPE), are generally used as electric cables for extra high voltage [2]. However, insulating materials can degrade due to chemical, mechanical and electric stress [3], [4]. Material specific reasons for the degradation includes voids, extrinsic materials and protrusions in the material. Furthermore, sectional degradation due to breakdown can occur in the substance, possibly in combination with influences of the electric field, heat, mechanical power and atmosphere [5]. Therefore, this study measured the discharge patterns due to voids and copper particles using parameters such as discharge phase angle (Φ), discharge amount (q) and discharge number (n), as a function of temperature and applied voltage for various configurations of XLPE. To analyze the measured irregular partial discharge patterns quantitatively, the discharge patterns were analyzed using a statistic program written in C++ [6], [7]. Characteristics of the discharge were compared and verified after gathering the discharge pattern around the negative and positive areas using the K?means algorithm, which helps simplify complicated mass data by converting objective information to declination information and distance between objects. Specifically, the likelihood ratio was used to perform the test [8]. Types of defects were distinguished by removing the patterns of partial discharge from the polymer insulating material by applying insulation patterns that originated from ageing and defects in XLPE to the complicated distribution statistical model. Therefore, it is believed that the new diagnosis system can be used to help supply stable electric power by predicting faults in insulation materials used in extra high voltage cables.
Three layers of specimen were used, having has a size of 70×70 mm and a thickness of 0.8 mm. Virgin XLPE was used as the upper and lower layers while either a 2 mm of air void or 2 mm of copper particles were inserted between the specimen layers [9]. An electric voltage was applied artificially to a flat board versus plate electrode and the pressure was kept constant using springs. Moldings were made on the upper and lower electrode with epoxy to prevent a surface or corona discharge. The experiment was performed in silicone oil having a viscosity 1,000 cSt. After heating at room temperature, 50℃, and 80℃ in silicone oil, the partial discharge characteristics were examined with increasing electric voltage from the inception voltage to breakdown.
The distribution of the specimen's partial discharge characteristic (Φ?q?n) was examined by measuring the partial discharge with increasing electric voltage to AC 60 Hz [9]. The calibration signal coupler was connected to the specimen and was calibrated using an electric charge of 50 pC. Total electric discharge (q) and the occurrence frequencies (n), which were generated by each phase angle, were detected with the discharge data acquired by acquisition for 10 seconds after the voltage was applied. The information was obtained by converting the deposited data of a single cycle period to a three dimension graph in order to convert to the correct and quantitative discharge amount and occurrence frequency using the statistics program written in C++. Using the K?means algorithm, the average discharge amount, standard deviation and polarity charge quantity and discharge number were calculated.
3.1 Temperature dependence of discharge
3.1.1 Void specimen
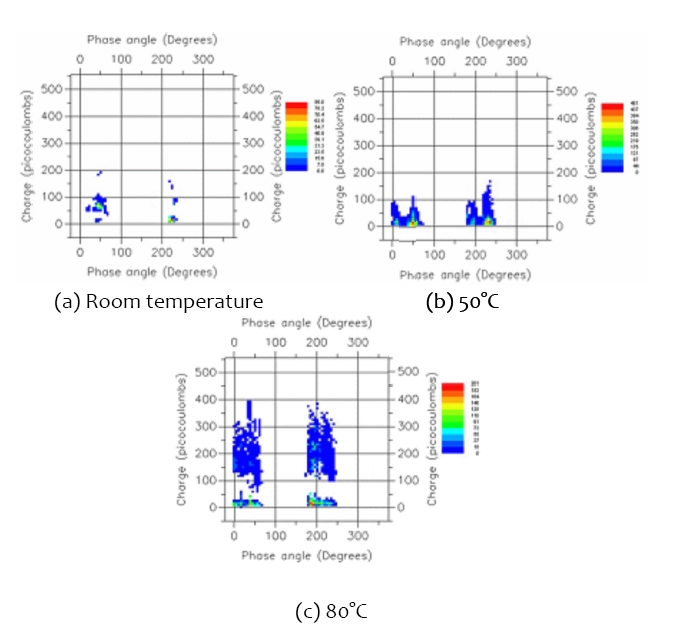
Figure 1(a) shows the characteristics of inception discharge
at room temperature for 9 kV. Discharge occurs due to concentration of the characteristics at approximately 50 degrees in the positive area, and the maximum number under this condition was approximately 6 degrees. Concentration occurs at approximately 225 degrees in the negative area, and the maximum number under this condition was approximately 86 degrees. The total discharge amount of each area was approximately 9.4 × 10⁴ pC. This shows that the negative area was 4.0 × 10³ pC larger than positive area, but the positive area had a higher frequency. This was attributed to voids inside the insulator, which is the discharge inception region wherein discharge originates from the voids where the dielectric strength is low.
Figure 1(b) shows a graph of partial discharge at 50℃ and 9 kV. The maximum number was 210 at 10 degrees and 481 at 50 degrees in the positive area, and 170 at 190 degrees and 481 at 230 degrees in the negative area. Discharge was confirmed to be internal discharge due to the symmetrical phase. On the other hand, the level of partial discharge was 7.54 × 10⁴ pC and 3.44 × 10⁴ pC in the positive and negative polarity, respectively. As the total number was 1,025 and 855 in the positive and negative area, the total charge and total number of 31.4% and 88.6% was increased at 9 kV, which increased to 1 kV higher than the inception discharge 8 kV. As the measuring temperature was increased to 50℃, a partial discharge was activated, and the total discharge increased 15.5% at the same voltage.
Figure 1(c) shows the partial discharge characteristic graph when 9 kV was applied at 80℃. This shows that the maximum numbers in the positive area were 91 and 150 at approximately 10 and 50 degrees, respectively. The negative area showed maximum numbers of 201 and 110 at 190 and 230 degrees, respectively. This was confirmed to be an internal discharge as the phase was symmetrical. The discharge amount in the negative area was 62% higher than that in the positive area. Compared to the applied voltage 8 kV, the total discharge amount increased by 46%, and the number increased by 56.3% from 6,404 to 10,007. The discharge phenomenon becomes
active due to the contribution of the applied voltage and thermal energy. This can be distinguished from the existing characteristics for a non?crystalline specimen as some crystalline melt will form if the temperature increases to 80℃ .
3.1.2 Copper particle specimen
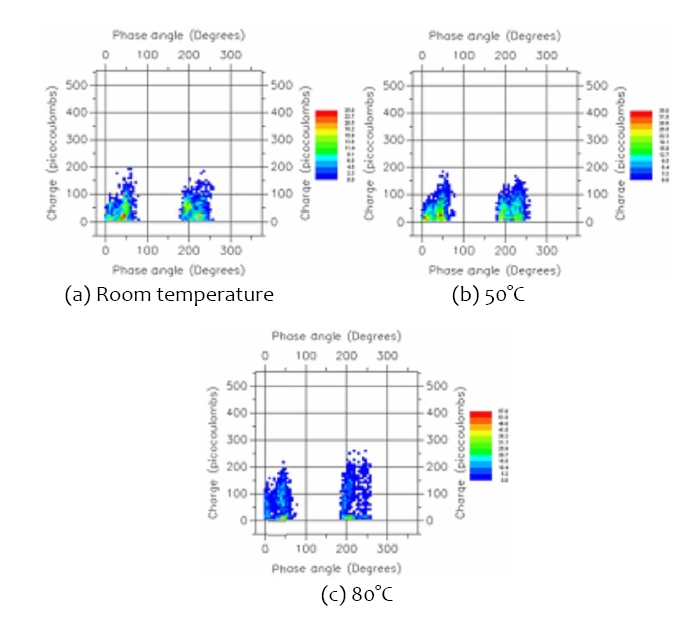
Figure 2(a) shows the partial discharge characteristic of the 5 kV inception voltages at room temperature in the positive area. Frequency maxima in the positive area were 13 and 25 at 5 and 50 degrees, respectively, and the total number value in the positive area was approximately 1,346. The maximum number in the negative area was 18 and 23 at 190 and 230 degrees, respectively, and the total number area was approximately 1,350. The phase angle was symmetrical and the total number and total discharge amount in the positive area were similar to that in the negative area. A comparison of the partial discharge characteristics of copper particles with those of the void under the same conditions revealed the inception voltage of the copper particles to be 4 kV lower than that of the void with a 51.5% increase in the total discharge amount. It is believed that the decrease in applied voltage and increase in discharge amount were due to impurities and conductors, which result in unequal electric fields at the applied voltage from the outside as a result of the internal discharge of the insulator.
Figure 2(b) shows the partial discharge at 5 kV in the insulator containing copper particles at a temperature of 50℃. The maximum numbers in the positive area were 35 and 31 at 5 and 50 degrees, respectively. The maximum numbers in the negative area were 26 and 21 at 190 and 230 degrees, respectively. Each area has two peaks. Average charge was 113 pC, which is a 5.6% increase compared to 5 kV at room temperature. The discharge amounts in the positive and negative areas were similar and symmetrical. It is believed that the electric charge injected from the external electrode acts as a homo polarity space charge. In addition, the average amount of the electric charge increases with increasing discharge number even though the total charge decreases due to the occurrence of a reverse voltage. Fig. 2(c) shows the discharge characteristics at an applied voltage of 5 kV at 80℃. The maximum numbers in the positive area were 12 and 45 at 5 and 50 degrees, respectively. The maximum numbers in the negative area were 26 and 12 at 196 and 250 degrees, respectively. Compared to the discharge characteristic at 4 kV, the total discharge amount was 2.27 × 10⁵ pC, which is a 116.4% increase, and is similar for both the negative and positive polarity. The discharge number was 2,630, which is a 102% increase, and the discharge numbers of the positive and negative areas were similar. Therefore, the temperature and applied voltage both play a significant role.
This method takes initially represents "K" of the clusters between the large volumes of data. To minimize errors of the centroid value due to quantification of the data, each component in the population was examined and assigned to one of the clusters depending on the minimum distance. The position of the centroid was recalculated every time a component was added to the cluster. This process was continued until all the components were grouped into the final required number of clusters. Then, the centroid can be decided in multi? dimensional space [10].
3.2.1 Void specimen
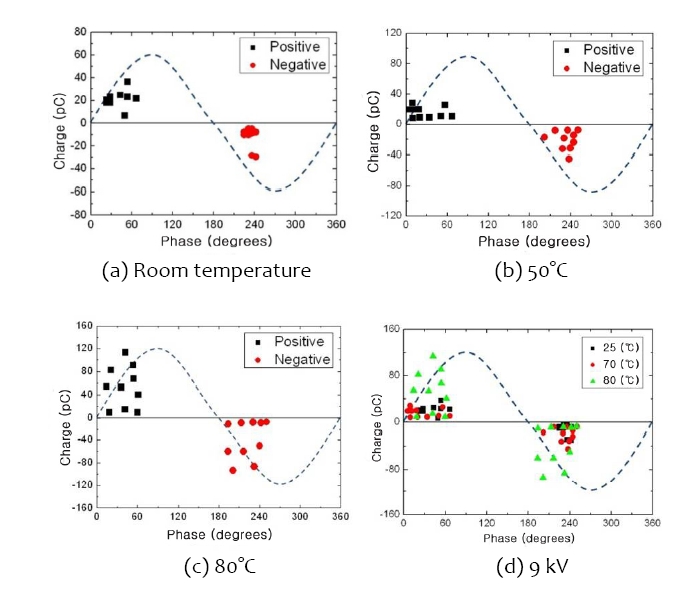
Figures 3(a)?(c) show the K?means simulations of the void at room temperature, 50℃ and 80℃, respectively. Ten clusters were taken from each positive and negative phase area. Fig. 3(a) shows the distribution of the void specimen for 9 kV at room temperature. The mean discharge amount of the positive area was 21.4 pC with a standard deviation of 7.3, while the mean discharge of the negative area was 12.1 pC with a standard deviation of 9.1. Therefore, the clustering characteristics of the positive polarity were superior to those of the negative one. The discharge amount of the phase centroid with positive polarity had coordinates of 51.6 degrees, and 23.1 pC, while the discharge amount of the phase centroid with negative polarity had coordinates of 234.6 degrees and 15.5 pC. Since the positive and negative polarity showed symmetric characteristics, this was an electric discharge phenomenon inside the insulator. The partial discharge quantity of the void specimen at room temperature received a lower inception discharge phase with increasing electric voltage and the partial discharge quantity moved to the change point (90 degrees and 270 degrees).
Figure 3(b) shows the cluster distribution when 9 kV was applied at 50℃. The centroid of the positive phase had the coordinates of 37.6 degrees and 14.4 pC, while the centroid of the negative phase had coordinates of 226.1 degrees and 20.5 pC, showing that they are symmetrical. The maximum discharge amounts had coordinates of 56.3 degrees and 25.4 pC for the positive phase, while the negative phase had coordinates of 237.9 degrees and 44.9 pC. Also, the minimum discharge amounts had coordinates of 9.4 degrees, 8.2 pC, and 250.5 degrees and 7.7 pC, respectively. The average discharge amount in the positive polarity was 15.9 pC with a
standard deviation of 7.3, while that of the negative polarity was 20.7 pC with a standard deviation of 12.4. Therefore, the characteristics of clustering distribution are better in the positive polarity area than in the negative polarity area.
Figure 3(c) shows the discharge clustering distribution graph immediately before the cluster was broken at an applied voltage of 9 kV at 80℃. Coordinates of the discharge amount were 58.9 pC and 61.4 pC at 38.6 degrees and 216.7 degrees, respectively, again indicating symmetric characteristics. This shows that the discharge clustering distribution in the negative polarity is slightly larger than that in the positive one. The maximum values were 113.3 pC and 94.1 pC at 42.2 degrees and 201.3 degrees, respectively. The minimum values were 9.3 pC and 7.2 pC at 18.3 degrees and 250 degrees, respectively. This shows that the positive area is larger than negative area at high temperatures and high voltages, and this is believed to be due to the repulsion of the space charge inside the specimen.
Figure 3(d) shows the K?means distribution when the clustering distribution temperature of the φ?q characteristics is increased from 25℃ to 80℃ at the same applied voltage, 9 kV. The insulation characteristics of the specimen were excellent at 25℃, and there was little discharge. However, when the temperature was increased to 50℃, discharge amount increased 15.4% due to the easier electric charge injection than at room temperature. As the temperature was increased further to 80℃, the physical properties changed and the discharge amount was approximately 5.7 times higher than at 50℃ due to a co?contribution of the electric field and the temperature.
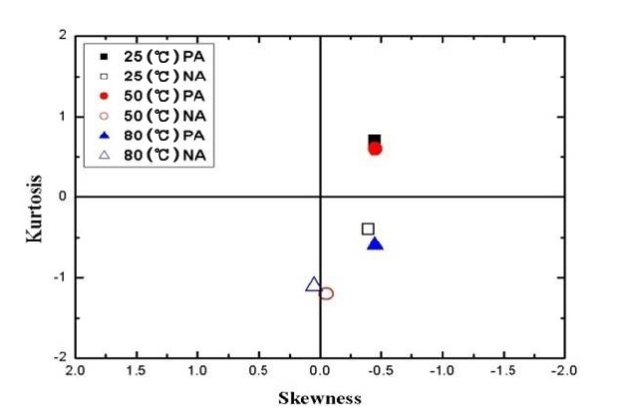
In particular, when the temperature was increased, the centroid phase of positive and negative polarity moved from 51.5 degrees to 38.6 degrees and from 234.6 degrees to 216.7 degrees, respectively. Therefore, the amount of charge and distribution of phase became wider. Fig. 4 shows the skewness with the X?axis and the kurtosis with the Y?axis regarding the void shown in Fig. 3(d). The pattern of the discharge amount in the positive polarity area moved to a counter clockwise curve shape from quadrant 2 to 3 and to quadrant
4, respectively, when the temperature was increased from room temperature to 50℃ and 80℃. The pattern of the discharge amount at the negative polarity area moved clockwise from quadrant 1, which reached to the boundary axis of quadrant 3. Therefore, if a void exists in extra?high voltage cables, a positive polarity and negative polarity area indicates a counter clockwise and clockwise clustering distribution, respectively.
3.2.2 Copper particle specimen
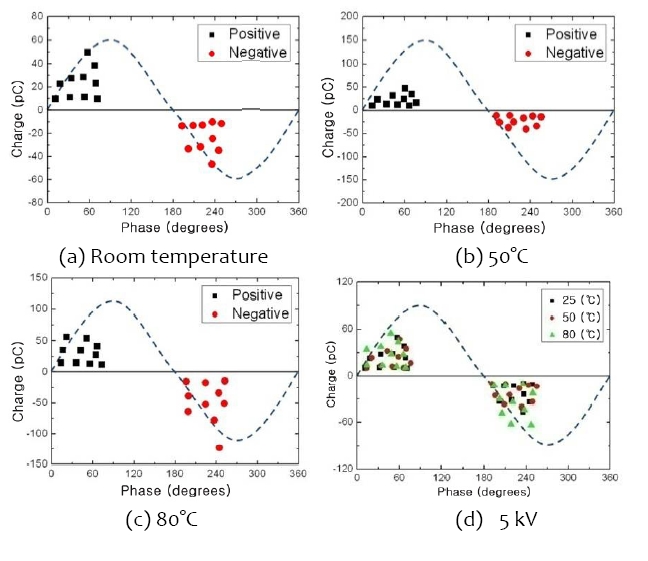
Figure 5(a) shows the centroid distribution graph when the inception voltage of the specimen with copper particles is 5 kV. There were symmetry characteristics, as shown by the positive polarity centroid of 22.9 pC at 46.5 degrees and the negative polarity centroid of 23.5 pC at 220.9 degrees, and the similar discharge amounts. The maximum discharge amounts were 49.7 pC and 46.7 pC at 57.3 and 235.6 degrees, respectively. The minimum discharge amounts were 9.8 pC and 10.3 pC at 71.6 and 236.3 degrees, respectively. Hence, the symmetry characteristics and size were similar. The average positive polarity discharge amount was 23.2 pC with a standard deviation is 13.4, while the negative polarity average amount of charge was 23.3 pC with a standard deviation of 12.7. Fig. 5(b) presents the centroid distribution when 5 kV was applied at 50℃. The centroids of positive and negative polarity were 23.2 pC and 23.7 pC at 46.5 and 224.4 degrees, respectively. Their symmetry was excellent and the amount of discharge was similar. Maximum value of the centroids were 47 pC and 40.7 pC at 60.4 and 233.7 degrees, respectively, while the minimum values of the centroid were 10.3 pC and 11.0 pC at 13.9 and 210.5 degrees, respectively, indicating symmetrical characteristics and similar discharge amounts. The average value of the positive polarity was 22.5 pC with a standard deviation of 12.4. The average value of the negative polarity was 22.8 pC, with a standard deviation of 11.4, the average values and standard deviation were similar. Fig. 5(c) shows the centroid distribution graph when 5 kV was applied. The centers of the positive and negative polarity had coordinates of 39.5 degrees, 27.9 pC and 223.8 degrees, 36.7 pC, respectively. The distribution graph of negative polarity increased 31.5% more than that of the positive polarity due to the active internal discharge of copper particles from the
applied voltage when the physical properties of the specimen had changed due to the high temperature. Maximum values for the positive and negative polarity had coordinates of 47.9 degrees, 54.3 pC and 247.2 degrees, 63.6 pC, respectively, and the minimum values had coordinates of 69.4 degrees, 10.9 pC and 235.2 degrees, 11.4 pC, respectively. The average value of the positive polarity was 27.7 pC, with a standard deviation of 15. The average value of the negative polarity was 34.3 pC, with a standard deviation of 19.8. This shows that the crowding was excellent in the positive area.
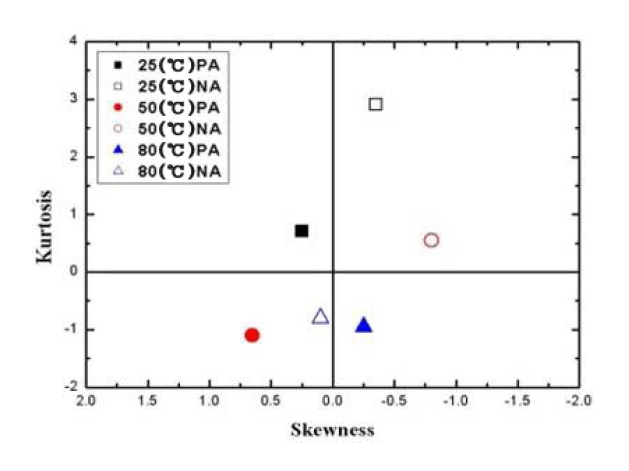
However, when the temperature was increased from 50℃ to 80℃, the phases became 39.5 degrees and 223.7 degrees. This shows that the phase of positive polarity decreases, but the phases remain similar to each other. The amount of charge in the positive and negative polarity cases increased 20.3% and 54.9%, respectively. Crowding of positive polarity is superior to that of the negative polarity. It is believed that discharge becomes easier in conducting copper due to the contribution of temperature. Fig. 6 shows the kurtosis and skewness of copper, which checks patterns of discharge at the positive and negative areas caused by the increasing temperature of the copper particles shown in Fig. 5(d). As shown in the graph, the pattern of the discharge amount at positive polarity area moved to 3rd quadrant from the 4th quadrant when the temperature was increased from room temperature to 50℃ and 80℃.
As shown in Figs. 4 and 6, if the temperature increases and a void exists in the cables, the discharge pattern has a curved shape. The discharge pattern has a straight shape if a conductor exists in cables. It is believed that the types of fault that exist in extra high voltage cables can by classified based on the basis on these discharge patterns.
The partial discharge occurring in an insulating material of ultra high voltage cables, XLPE, was examined by partial discharge statistical analysis.
1) The amount of charge for the negative polarity is larger than that for the positive polarity, and these were symmetrical due to discharge of the void specimen. When the temperature is increased to 80℃, the discharge in the insulator becomes active as an amorphous region and small crystallizations of the specimen are dissolved, reaching breakdown rapidly as a result of the movement of charge caused by the repulsive force with the electrode.
2) The partial discharge characteristics of copper particles made the inception voltage 4 kV lower than that of the void specimen under the same conditions. The applied voltage decreases and discharge amount increases due to the unequal electric field formed by the applied voltage from the conductor with low dielectric strength.
3) When the measuring temperature was increased from room temperature to 80℃, and a voltage of 9 kV was applied, the centroid phase angles of positive and negative polarity were 38.6 and 216.7 degrees, respectively. When 5 kV was applied, the centroid phase angles of the copper particles for positive and negative polarity were 39.5 and 223 degrees, respectively.
4) When K?means clustering was carried out at 9 kV for the void discharge characteristics, the discharge amount at low temperature was small but it increased 5.7 times when the temperature was increased to 80℃, due to easier electric charge injection. Kurtosis and skewness analysis confirmed that the positive and negative polarity had a counter?clockwise and clockwise clustering distribution of the curve, respectively.
5) When 5 kV was applied to copper particles and the temperature was changed from 50℃ to 80℃, K?means showed the amount of charge for the positive and negative polarity increased by 20.3% and 54.9%, respectively. Kurtosis and skewness analysis showed that the positive polarity and negative polarity had a clustering distribution around a straight line.
Overall, voids exist in the insulator if the clustering distribution of the partial discharge amount using the kurtosis and skewness of K?means analysis appears to curve. In addition, faults can be distinguished if a straight distribution appears and the presence of a conductor in insulator can be predicted.