The objective of this study is to share multimedia contents included in existing digital devices and to solve the problems of an increase in installation fees and non- environmentally friendly interiors. This study designed a new digital signal transmitter and receiver using power line transmission and HDMI in order to solve the problems in the existing systems. The transmitter and receiver designed in this study used an AD9867BCPZ PLC chip in which the transmission came from digital signals originating in a PC, and the system architecture was configured so that the outputs signals were connected to a TV from the receiver. The experiment was implemented by adding a Video Test Generator, a USBPre external sound card, and Smaart Live 6 for analyzing the characteristics of the configured system. In the video test results, it was verified that communication was actively implemented, and the image quality showed a constant level from the measurement of the captured video. In the case of the sound, it was verified that more than 90% of the sound signals were normally transmitted and received from the examination of their phases and magnitudes. Thus, the performance of the system designed in this study was verified, which leads to the resolution of some of the problems found in current digital devices.
PLC (Power Line Communication) technology enables one to establish a network that performs a way to communicate with high frequency data signals through power lines, which are already constructed to supply power [1]-[4]. Although the theory of communication based on power lines as communication media has been known since the 1970s, it was only possible to transmit control signals due to the low transmission speed. However, a high speed and cost effective single chip has been designed that uses a computation concentrated algorithm that follows the recent development in PLC technologies [5]. A home networking technology has also been developed due to this development in PLC technology. The home network may become the next issue that has to be solved in the field of consumer technologies. Users of acoustic and video devices and other multimedia contents would like to share these various devices (PCs, game devices, Hi-Fi, and media servers) and media content through a high bandwidth network that provides guaranteed content quality. However, current wireless home network technologies are inadequate. Wireless technologies are able to share Internet access between computers in which the network traffic is unweighted and compressed. However, HD (High Definition) class images require a large bandwidth and an expected QoS (Quality of Service) in order to provide a satisfactory experience. These conditions can be satisfied by a wired network [6]-[9].
In addition, the necessity of home network services has been emphasized due to the recent increase in the number of content users and the development of high speed Internet services [10]. The power line communication method as a home network has lots of advantages; this study reduces the load of construction communication lines through using the power line for short distance communication and small capacity low speed data transfer, and develops a digital signal transmission system focused on its practicality in overcoming some of the difficulties found in the degradation of reliability caused by other electronic products. In addition, this study verifies its performance by applying some tests at a laboratory level using various electronic devices.
Thus, this study proposes to share multimedia devices through a network based on the PLC system, which is a type of wire technology, and to effectively use network resources. This study also conducts a study on the design of the transmitter and receiver, which are used for transmitting the PLC based digital signals to TVs.
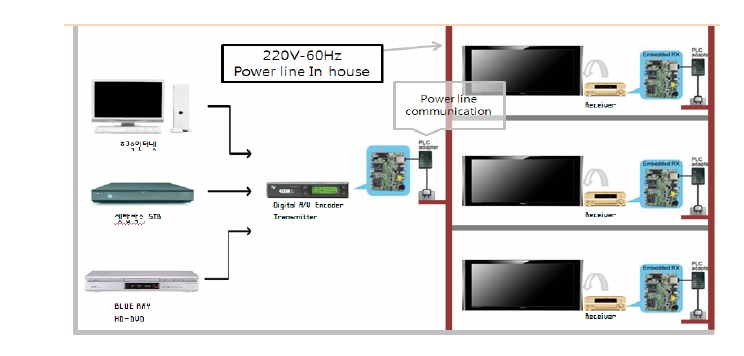
The system that is to be designed in this study is a system that transmits images and sounds simultaneously using the configuration of a network between PCs and TVs using power lines for the communication media. Figure 1 represents the architecture of this system.
In the flow of the system, as shown in Fig. 1, the transmitter transmits the input signals to a specific power line through the processing of these signals as image signals that are inputted to the transmitter. In the receiver, the
signals received from the power line are processed and then the processed signals are outputted to TVs or monitors. The transmitter and receiver used a TF-600-ACL PC- TV chip, an AD9867BCPZ modem chip, and a DVI/HDMI controller. The transmitter and receiver in the system are designed that they are independently operated by their own power. The digital signal input and output were applied by using a computer and monitor, respectively.
The PC-TV main chip (TF-600,630) was used to translate digital images from the Internet, PCs and DVDs to certain image receiving devices, such as TVs or monitors(Ed Note: I found this very confusing. I think I got it right, but please read the edit carefully for correctness). The MN1A94100 chip made by PANASONIC was selected to supply an internal power line modem. The PLC chip (AD9867BCPZ) is a Mixed-Signal Front End and can communicate using 250Msps. It has a 10 bit analog to digital conversion (ADC) function along with a digital to analog conversion (DAC) function. In addition, it is able to perform a plug & play function without any LAN lines. The DVI/ HDMI controllers (EP932E and EP9853) enable the use of the DVI (Digital Visual Interface) and HDMI (High Definition Multimedia Interface) protocols in order to input digitally processed signals.
HDMI inputs have been settled on as a standard in the home appliance businesses; HDMI translates the DVI protocol, which is an interface standard between PCs and displays, to the interface for AV (Audio/Video) products and so is a standard for electric signals, pin outputs, cables, and other connection devices in order to connect various multimedia devices using a single cable. As implied by its name, HDMI includes not only analog/digital(Ed Note: I was under the impression that HDMI operated in the digital domain only) video signals, but also voice and HDCP (High bandwidth Digital Contents Protection) signals. These signals are processed in this block and transmitted to a video driver. This study selected this chip in order to utilyze HDMI.
The HDMI and the power cable were applied as the input and output of the transmitter, respectively. In reverse, the receiver used the power cable and the HDMI as the input and output, respectively.
2.1 The configuration of the transmitter
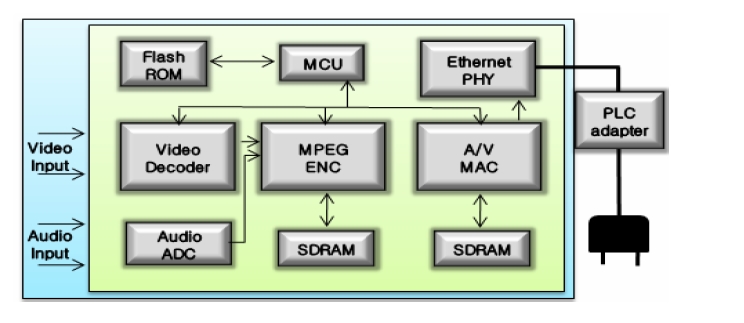
Figure 2 shows the block diagram of the transmitter that transmits the digital signals.
The transmitter used in this study consists of an ADC, a
MCU (Micro Controller Unit), an EEPROM, a DRAM, Flash Memory, the PLC chip, a multimedia network controller, the DVI/HDMI Transmitter, and other components. Digital signals input to the HDMI input port, these signals are then processed through the DVI/HDMI Transmitter and then sent to the PLC chip. The signals are then transformed into analog signals and transmitted through the power line.
2.2 The configuration of the receiver
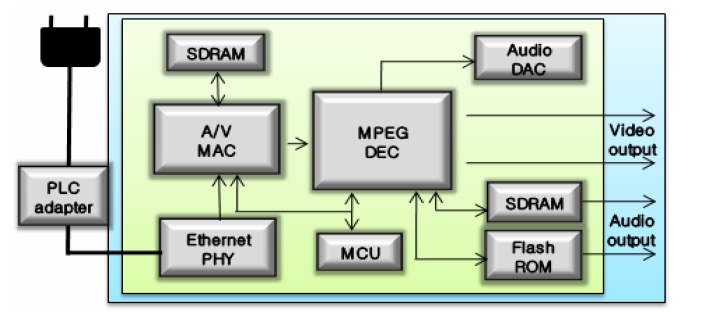
Figure 3 shows the block diagram of the receiver that receives digital signals.
The receiver consists of a DAC, an MCU (Micro Controller Unit), an EEPROM, DRAM, Flash Memory, the PLC chip, a multimedia network controller, the DVI/HDMI Receiver, and other parts similar to the transmitter. The receiver separates only the reproducible signals from the signals input from the power line using the PLC chip, and then converts the analog signals into digital signals. Then, it transmits the converted signals to the DVI/HDMI Receiver in order to process the signals as output signals. The signals are output as images and voices on a monitor.
2.3 The designed transmitter and receiver
Figure 4 illustrates the digital signal transmitter, (a), and receiver, (b), based on the power line communication method that is designed in this study.
3. THE EXPERIMENT AND THE CHARACTERISTIC ANALYSIS
This study performed signal, image, and voice analyses to quantify the characteristics of the system designed in this study. In these analyses, the signals were measured using a Video Test Generator and Wire Shark in which images were analyzed by comparing captured images from both the transmitter and receiver. In addition, this study investigated the characteristics of the voice signal transmission by adding some devices, such as USBPre and Smaart Live 6.
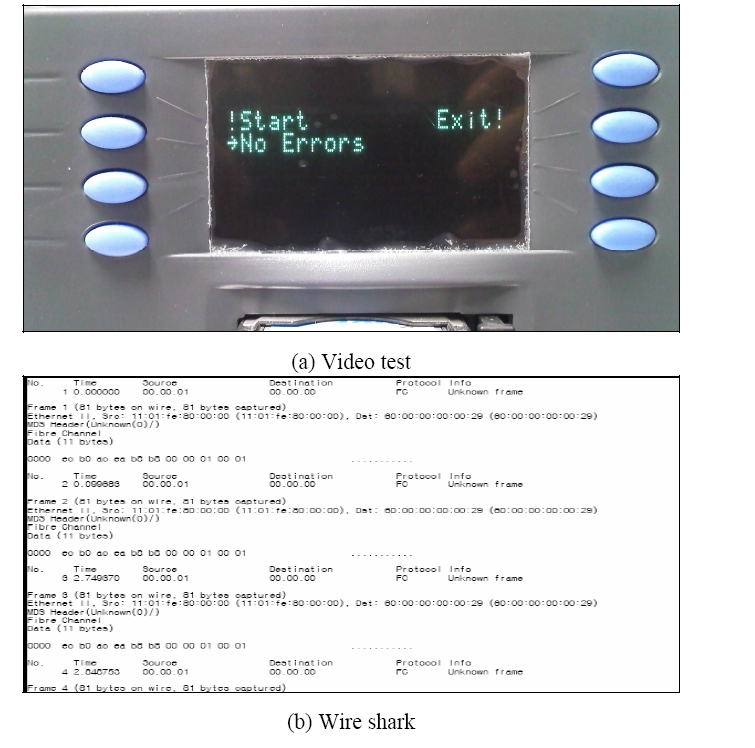
Wire Shark was used to analyze the signal of the designed system and verify the protocol. Also, the Video Test Generator was used to verify the presence of communication after applying standard signals to the HDMI interface. Figure 5(a) shows the results of the measurement of the signal transmission errors in the system, which was tested using the Video Test Generator. It was verified that there were no communication errors. Figure 5(b) represents the capture of the analysis results using Wire Shark. It can be seen that the HDMI is a type of communication that uses fiber optics, based on the results of the analysis of the communication protocol in the interface with the HDMI in which it is determined to be a FC (Fiber Channel).
This study analyzed the characteristics of the image of the system designed in this study by comparing the captured images from two signal sources. Table 1 show the results of
[Table 1.] The measured values for each video.
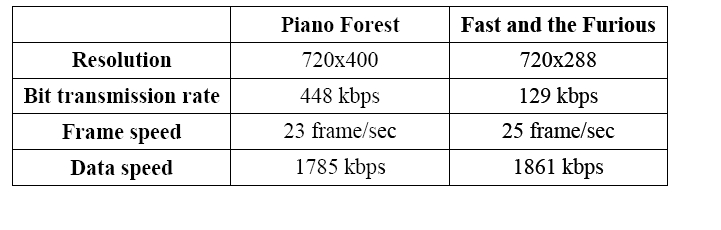
The measured values for each video.
the comparison of the resolution and the characteristics of the video, which is a SD class video with animation and lots of action, used in this experiment.
Figure 6 represents the image on the PC and captured image used in this experiment. The left image is the measured results from the image transmitted by the PC, and the right image is the image captured from the power line.
The images in Fig. 6 illustrate the characteristics as noted in Table 2. As shown in Table 2, the images in Fig. 6 have the same characteristics.
[Table 2.] The measured values for each video.
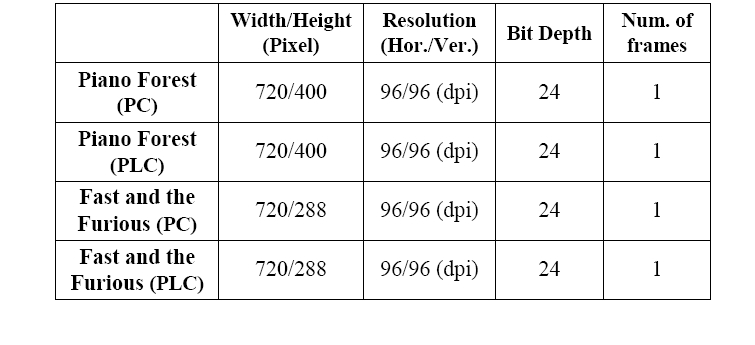
The measured values for each video.
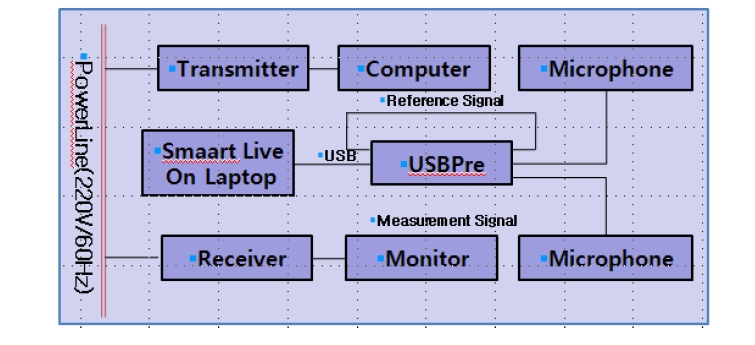
This study measured the voice signals by adding USBPre and Smaart Live in order to analyze the voice characteristics of the designed system. Because the experiment was applied in a regular laboratory instead of in an anechoic chamber, there are some extraneous noises due to the connection between the devices, equipment, and the power line. The block diagram of the experiment is shown in Fig. 7.
USBPre is an external sound card and was used to compare and analyze the original and the transmitted signals. The experiment was done as follows: First, a microphone was installed to the receiver connected to the PC. Then, the voice signals output to the PC were transmitted to the USBPre card as an input through the microphone by using the notebook PC in which Smaart Live 6 was running and the USBPre card.
A part of the signal was transmitted to the transmitter in order to investigate the characteristics of the designed system, and the other part of the signal was transmitted to the input port of the USBPre as a means to loop back the pure reference signals. The signals transmitted by the transmitter and received by the power line are input to the input port of the USBPre through the microphone. Based on the configuration of this experiment, a signal transmitted from the computer becomes the standard reference signal and the other signal becomes the measured signal for the designed system. These two signals make it possible to compare their characteristics.
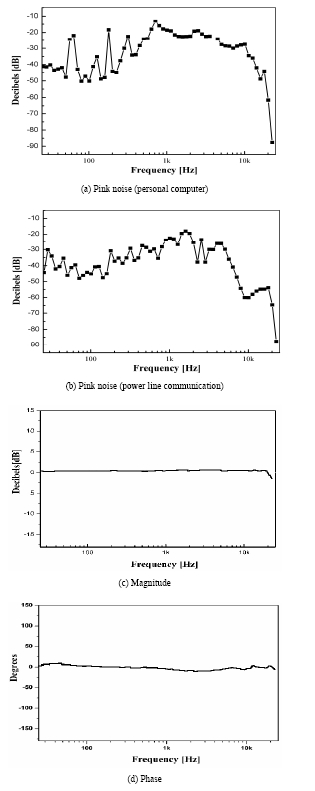
Figure 8 shows the results of the analysis of the signal characteristics using Smaart Live 6.
Figure 8(a) illustrates the results of the measurement of the signals output to the speakers by generating pink noise. Figure 8(b) shows the results of the measurement of the pink noise transmitted by the power line communication. Taking into account that the experiment did not happen in an anechoic
chamber, it can be seen that these two measured signals were normally transmitted and received except for the noise that occurred at the 60 Hz bandwidth along with other factors.
In particular, since the noise is caused by the power line frequency, most regular speakers, having a range of 120 Hz ∼ 20 KHz, will not be affected. However, this fundamental frequency may cause certain troubles in a home theater, as they use high performance speakers, such as subwoofers, and so must be considered.
Figures 8(c) and (d) illustrate the results of the measurement of the frequency and phase response characteristics in the signals, respectively. The phase and frequency characteristics are shown to maintain a phase shift of 0 and a frequency shift 0 dB. In addition, it was verified that the frequency response characteristics are almost the same as the original signals.
As the noise level that occurred at 60 Hz from the audio signals of the designed system represents a very low frequency, it was not investigated in the phase and frequency measurements. In addition, the noise verified in the analysis of the sound signals occurring at different frequency bands was considered to be the noise generated by the equipment and measurement devices configured in this experiment.
In the results of the characteristics of sound signals in this system, it was verified that more than 90% of the signals, were normally input and output. Also, it was possible to verify that the noise that occurred came from the power line and other equipment.
This study designed a digital signal transmitter and receiver based on power line communication and investigated their characteristics in order to solve the problems found in the conventional digital devices using such power lines.
This study configured the transmitter and receiver using a PLC chip, the AD9867BCPZ, and HDMI. The experiment was implemented in a laboratory environment that uses many electrical devices.
The transmitter and receiver designed in this study had no errors in the transmission of digital images and voices from the measurement of the signals by using the Video Test Generator. In addition, in the results of the measurement of resolution and the data from the SmaartLive program, it was verified that more than 90% of the audio signals were normally transmitted and received.
Thus, it was possible to verify that the problems found in the sharing of multimedia contents between devices, the increase of the additional installation cost, and the nonenvironmental friendly interiors that exist in the current systems can be solved.
Studies on the power line noise are required to increase the practicality of the system designed in this study.
This study verified the technical possibility of the network between devices based on the power line communication method and the application of the results of this study to the various ubiquitous fields that are increasingly developing at the present time.