Since piezoelectric phenomenon able to develop an electric charge proportional to a mechanical stress discovered by J. and P. Curie first, this material has been utilized as core material in diversity fields [1]. Generally, material properties of PZT ceramics are measured under the small signal input. Concrete concept and process are stated clearly in the international standards [2]. The various material constants, determined by these methods are accepted as being trustworthy. In high power devices, such as ultrasonic motors and PZT actuators need a high level or great vibration amplitude, large input signals should be provided to the PZT elements. In accordance with many previous researches, material properties of PZT ceramics shows the linear characteristics only limited ranges of input voltages [3-5]. Hence, it is difficult to estimate the suitability of PZT ceramic material in case of high power applications. In Institute of Radio Engineers (IRE) standards, the material properties are able to be acquired from frequency-impedance characteristics of PZT ceramics [2]. Therefore, if these relations are varied with the applied input voltage, the material constants, calculated by the method enshrined in the standards, undergo changes necessarily. This fact signifies that the material properties of PZT ceramics are affected by the applied electric fields. In this study, we fabricated the disk type PZT ceramic specimens by conventional methods and considered the electric field dependence of frequencyimpedance characteristics. And also, we calculated the PZT constant d33 using the resonance method of the IRE standards from those frequencies representatively.
We used PZT - PMNS ceramics as disk type specimens in this experiment. PZT-PMNS ceramics definite composition is shown as follows [6].
0.9Pb(Zr0.51Ti0.49)O3-0.1Pb(Mn1/3Nb1/3Sb1/3)O3+0.05Cr2O3
To increase the dielectric and PZT properties of PZT ceramics significantly, MnO2, Nb2O5, Sb2O3 were added. Mixing ratio was determined by considering morphotropic phase boundary of ceramics. Cr2O3 was added to improve the mechanical quality factor (Qm) and to reduce the dielectric loss (tan δ ). This material shows excellent properties of high mechanical quality factor, high electromechanical coupling factor (kp) and low dielectric loss. The disk type ceramic specimens based on this material were fabricated. It had 28-mm diameter and 1-mm thickness.
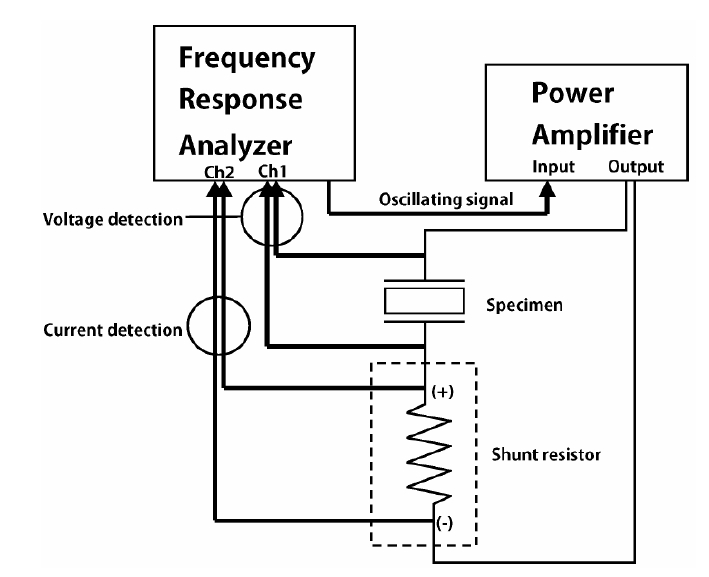
The system for measuring resonance characteristics according to input voltage is presented in Fig. 1. Output signal of the built-in oscillator in the frequency response analyzer(FRA 5087; NF Corporation, Japan) was amplified by a power amplifier to drive the PZT specimen. The voltage was applied to the specimen and measured from Ch1 of FRA. The current flowing through the specimen was converted into voltage multiplied by the shunt resistor and was inputted through Ch2. By setting the analysis mode of the frequency response analyzer to Ch1 / Ch2, the impedance of the PZT specimen was measured. By measuring impedance by sweeping the frequency of the internal oscillator, the frequency characteristics of impedance were obtained. Resonance characteristics of the specimen of PZT ceramics are measured under the input voltage from 1 Vrms to 25 Vrms.
2.3 Calculation process of PZT constants d33
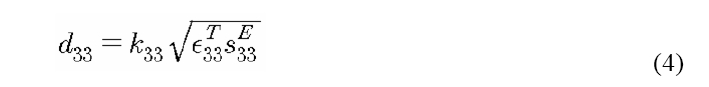
In order to analyze the variation of a PZT constant d33 due to the change of the electric field, we calculated by means of the resonance method of the IRE standards. In accordance with the IRE standards, the value of d33 can be reckoned by the following procedure step by step [2].
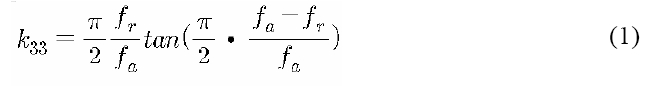
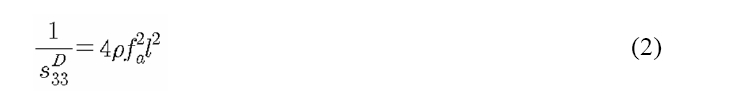
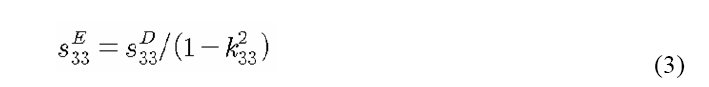
The electro-mechanical coupling factor k33 is determined from the fundamental frequency fa and fr of thin cylinders. Fa and fr mean the anti resonance frequency and resonance frequency respectively. sD 33 is acquired by sample size, density and anti resonance frequency.
3.1 Frequency-impedance characteristics
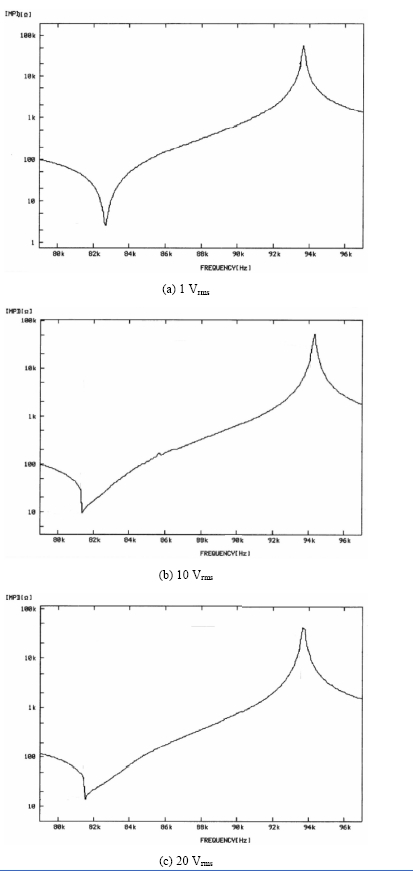
Impedance curves due to the magnitude of the input voltages are shown in Fig. 2. And the resonance and antiresonance frequencies in accordance with the voltage variation are shown in Table 1. Input voltage was from 1 Vrms to 25 Vrms. In the first resonance mode of the specimen, the impedance according to the frequency was measured. When input voltages of 1 Vrms and 5 Vrms were applied, the impedance curve at the resonance and anti-resonance point had a bisymmetric shape and the value of impedance showed relatively large changes. But, when the input voltage was more than 10 Vrms, the impedance curve at the resonance point showed an asymmetric shape. Also, changes of the impedance value were relatively small. And this value varied steeply near the resonance frequency. Uchino et al. [7], explained that this phenomenon happened due to the non-linearity of the PZT characteristics using an electrical equivalent circuit. It seems that the variation of the frequency hardly harmonized with the mechanical vibration as the higher voltage was applied. As a result, the vibration change of dipoles which existed in the ceramic material seems to become sluggish.
[Table 1] Resonance and anti-resonance frequencies in accordance with the voltage variation.
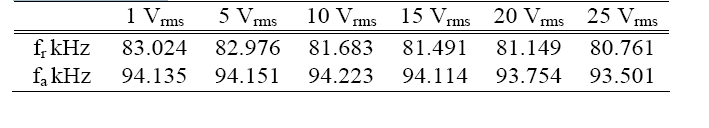
Resonance and anti-resonance frequencies in accordance with the voltage variation.
[Table 2] Calculation values of kp and Qm of specimen.
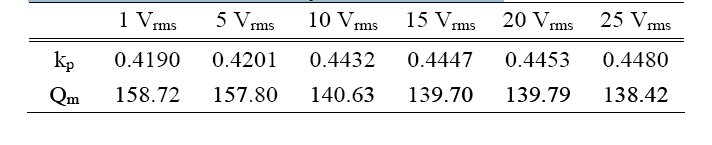
Calculation values of kp and Qm of specimen.
In IRE standards, the kp is obtained from the fundamental mode fr and fa of a thin disk as follows.
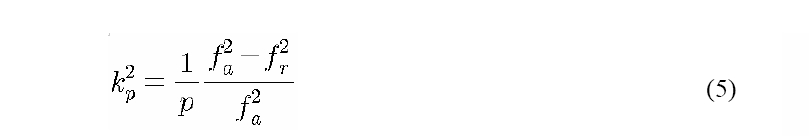
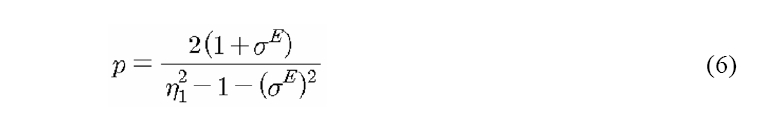
σE is Poisson’s ratio, and η 1 is the lowest positive root of (1+ σE )J1(η ) = η J0(η ). J0 is Bessel function of first kind and zero order, J1 is Bessel function of first kind and first order [2].
The mechanical quality factor Qm is obtained from the determination of the minimum impedance Zr at the fundamental resonance. This measurement is accomplished by substitution of a variable resistance for the test specimen at fr. Qm is given by the follow relation.
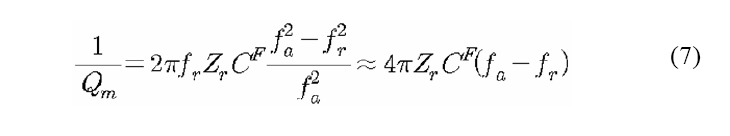
CF is the capacitance measured under the low frequency condition (1 kHz). Table 2 shows the calculation results of kp and Qm by the upper equations. In accordance with the input voltage variation, the electromechanical coupling coefficient kp is increased, but Qm is decreased slightly.
3.2 Electric field - resonance frequencies variation
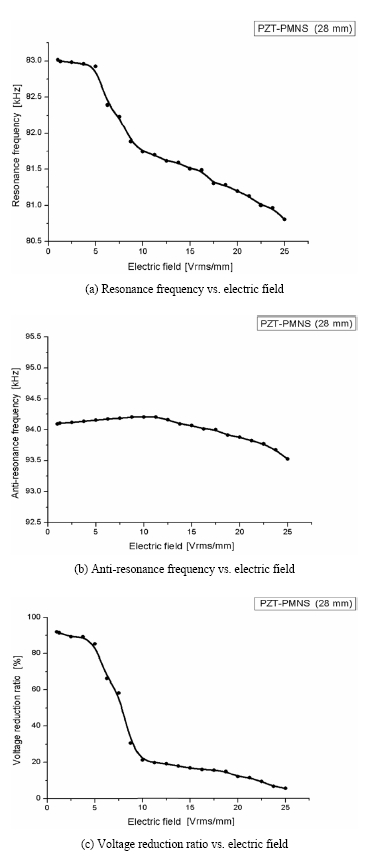
Figure 3 represents the variation of resonance frequency, anti-resonance frequency and the voltage reduction ratio at the resonance frequency, respectively. Specimen in Fig. 3 is 28 mm diameter and 1-mm thickness. When the electric field increased, the resonance frequency and the voltage reduction ratio decreased. The resonance characteristics were very similar tendencies as shown in the graphs. Peculiarity of these graphs was that the resonance frequency and voltage reduction ratio decrease steeply at a specific electric field, 5-10 Vrms/mm in Fig. 3. In case of the resonance frequencies in Fig. 3(a), the measured value at a 1 Vrms/mm was 83.0 kHz. The measured value at 25 Vrms/mm was 80.8 kHz Shift of the resonance frequency was about 2.2 kHz. As the electric field increased, the decrement of the resonance frequency was found. Therefore, the resonance frequency shift may have considerably occurred in the case of high power devices such as ultrasonic motors or micropumps, transformers etc. When the PZT ceramic resonated, the magnitude of the voltage across PZT ceramics decreased. We compared the voltage drop with the actual input voltage and represented the voltage reduction ratio as shown below. This equation relates to the impedance drop characteristics of the specimens.

Reduction ratio of the specimen of 28 mm in diameter shows about 91.7% under 1 Vrms/mm and 5.6% under 25 Vrms/mm.
3.3 Electric field - PZT constants d33 variation
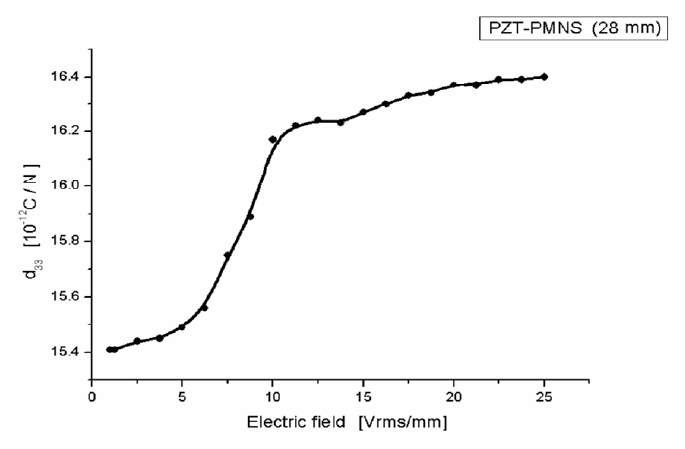
Figure 4 shows variation of PZT constant d33 for two cases. We calculated d33 using the resonance method of the IRE standards [2]. Overall, as the electric field increased, the PZT constants increased. However, a non-linear characteristic was revealed in a portion of range of the magnitude of
the electric field. When the AC electric field, lower than the coercive field, was pushed in the polarized PZT ceramics, the domain of the grain changed and the strain of the PZT ceramics occurred. Hence, from the experimental results, the stacks and tendency which PZT constant increases shows that a difference exists in the shift of grain boundaries under low electric fields of nearly 1 Vrms/mm and over 10 Vrms/mm. The observed increase in the d33 is likely due to the larger extrinsic contribution resulting from increased domain switching under the larger electric fields [8].
Sherrit et al. [9] and Takahashi et al. [10] reported that mechanical factors had greater effects on the non-linearity than the electrical factors. In this experiment, an notable mechanical vibration factor, which exerted its influence on the PZT characteristics, was generated in the specified electrical realm. If the input voltage on the poled PZT ceramics increases, the vibration also axiomatically gets bigger at the resonance point. However, the vibration characteristics of PZT-PMNS ceramics are divided at the range of input voltages between 5 Vrms and 10 Vrms. These could be ascertained by the non-linear change of the frequency, voltage drop and PZT constant d33. Because many applications such as PZT motor, pump and transformer etc. have a higher operational voltage level that the voltage used in this experiment, the variable tendencies of all of the above mentioned factors may be obvious.