Aerosol observation with Raman LIDAR in NIES (National Institute for Environmental Studies, Japan) LIDAR network was conducted from 17 April to 12 June 2008 over Beijing, China. The aerosol optical properties derived from Raman LIDAR were compared with the retrieved data from sun photometer and sky radiometer observations in the Aerosol Robotic Network (AERONET). The comparison provided the complete knowledge of aerosol optical and physical properties in Beijing, especially in pollution and Asian dust events. The averaged aerosol optical depth (AOD) at 675 nm was 0.81 and the Angstrom exponent between 440 nm and 675 nm was 0.99 during experiment. The LIDAR derived AOD at 532 nm in the planetary boundary layer (PBL) was 0.48, which implied that half of the total AOD was contributed by the aerosol in PBL. The corresponding averaged LIDAR ratio and total depolarization ratio (TDR) were 48.5sr and 8.1%. The negative correlation between LIDAR ratio and TDR indicated the LIDAR ratio decreased with aerosol size because of the high TDR associated with nonspherical and large aerosols. The typical volume size distribution of the aerosol clearly demonstrated that the coarse mode radius located near 3 μm in dust case, a bi-mode with fine particle centered at 0.2 μm and coarse particle at 2 μm was the characteristic size distribution in the pollution and clean cases. The different size distributions of aerosol resulted in its different optical properties. The retrieved LIDAR ratio and TDR were 41.1sr and 19.5% for a dust event, 53.8sr and 6.6% for a pollution event as well as 57.3sr and 7.2% for a clean event. In conjunction with the observed surface wind field near the LIDAR site, most of the pollution aerosols were produced locally or transported from the southeast of Beijing, whereas the dust aerosols associated with the clean air mass were transported by the northwesterly or southwesterly winds.
The increasing urbanization and industrialization of the East Asia region, along with the intense dust storm events occurring mostly in spring time, lead to continuously increasing particulate matter particularly in the lower troposphere [1-2]. The air quality in Beijing is drastically affected by both anthropogenic and naturally occurring dust aerosols. The aerosol properties and their spatial and temporal variations over Beijing - especially during Asian dust events - have been studied lately using ground-based radiometer data [1-3]. However, the quantitative observation with Raman LIDAR is still limited [4]. We added the Raman detection channel into National Institute for Environmental Studies (NIES) LIDAR system in Beijing in December 2007, and took continuous observation until now [5]. This paper reports on the typical results of Raman LIDAR observation from 17 April to 12 June 2008 and their comparison with sun photometer and sky radiometer observations in the Aerosol Robotic Network (AERONET) as well as the surface meteorological observations.
II. INSTRUMENTATION AND METHOD
The NIES upgraded Raman LIDAR system is located in the Institute of Atmospheric Physics, Chinese Academy of Sciences in Beijing, China (39.97N, 116.37 E). It operates in a continuous mode (5-min of data acquisition with 10-min intermission) through a window on the roof of the observation room, regardless of weather. The LIDAR system employs two-wavelength laser at 1064 nm and 532 nm for detecting two polarization components (parallel and perpendicular polarization) at 532 nm, nitrogen Raman shifted scattering at 607 nm and elastic scattering at 1064 nm. Though the signals from the Raman channel were recorded both in the day and night, only nighttime data were used in the analysis because of the large background radiation in the daytime. Based on these LIDAR data, aerosol optical properties included extinction and backscatter coefficients, LIDAR ratio and total depolarization ratio (TDR) at 532 nm were derived in the night time. The detailed method to retrieve aerosol optical properties from the Raman LIDAR data was described in the previous paper [5]. Here we only focus on the observed results by Raman LIDAR and their comparison with aerosol measurements in AERONET and the surface meteorological observations.
The sun photometer and sky radiometer observations were performed in AERONET located in Beijing (39 58' 37''N, 116 22' 51''E). The daily aerosol optical depth (AOD) and other AOD-dependent products are derived from the level 2.0 data (cloud-screened and quality-assured). The daily meteorological parameters are observed at the ZBAA station in Beijing. The Air Pollution Index (API) is measured from 1200 LT of the previous day to 1200 LT of the current day, and reported from the Beijing Municipal Environmental Protection Bureau. To determine this API, four chemical substances (SO2, NO2, CO, and O3) and the particulate matter concentration (PM10) are measured; the highest value of these five parameters becomes the API. In China and especially in Beijing PM10 seems always to have been the highest of the five parameters, which means the aerosol particle is the main contribution to API values. Thus the value of API indicates the concentration of particle matter in principle.
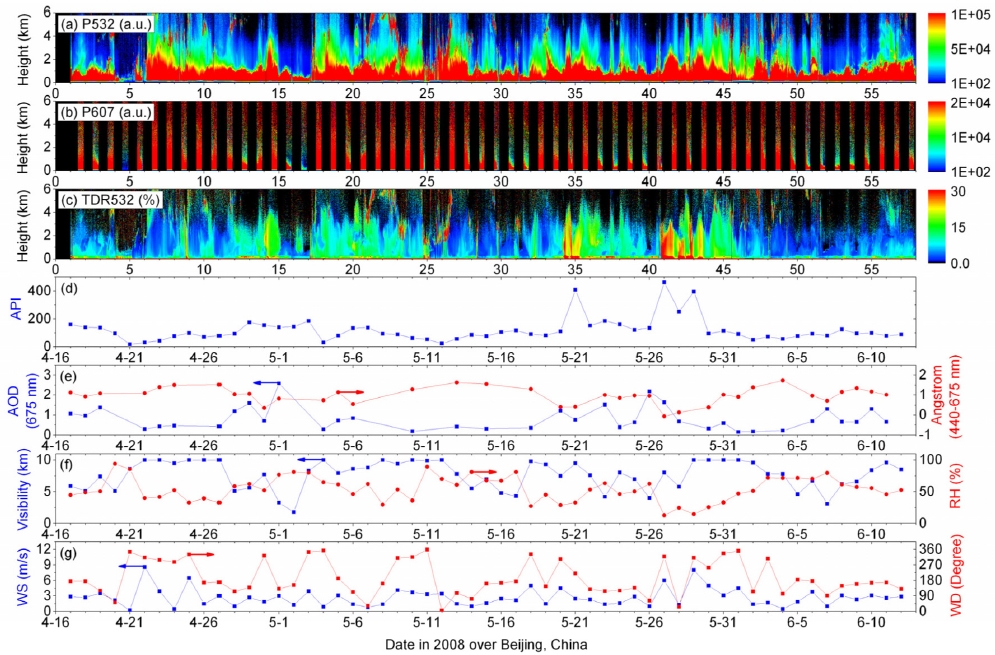
Figure 1 (a) to (c) gives the continuous measurements of aerosol optical properties with Raman LIDAR in Beijing from 17 April to 12 June 2008. Although the range-corrected backscattering intensity at 532 nm (a) and Raman shifted scattering intensity at 607 nm (b) in arbitrary units have no clear physical meaning, it is useful to see the full vertical structure of the aerosol in the atmosphere. The TDR at 532 nm (c) reflects the non-sphericity of the scatterers and is an indicator for identification of ice clouds and dust particles. Figure 1 (d) shows the daily API variation, indicating the content of pollution and dust aerosols near the surface. Figure 1 (e) gives the daily AOD at 675 nm and Angstrom exponent (440-675 nm) observed by the sun photometer in AERONET. Figure 1 (f) to (g) present the daily meteorological parameters during the LIDAR experiment.
On the whole, we can find that there was a close association between Raman LIDAR, sun photometer and surface observations, especially during Asian dust events which occurred on 30 April, 20 to 21 May and 27 to 29 May. The averaged API was 124.3, corresponding to the larger than 0.15 mg/m3 for PM10 mass concentration. The maximal value of 463 (0.5-0.6 mg/m3) on 27 May indicates the occurrence of a heavy dust event. The averaged AOD and the Angstrom exponent were 0.81 and 0.99 during the experiment. The minimum value of the Angstrom exponent was -0.06 on 27 May, indicating the larger dust particles on that day. The simultaneously observed meteorological parameters provide useful information to reveal the ambient conditions of the pollution and dust aerosols and their probable sources.
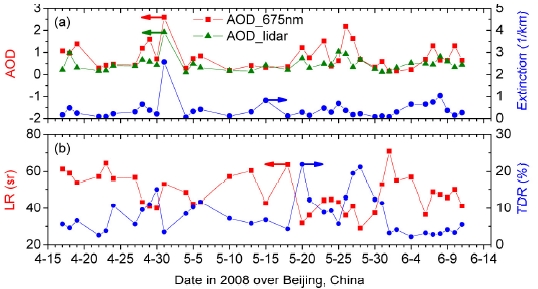
Figure 2 gives the daily variation of aerosol optical properties which includes AOD, averaged aerosol extinction, LIDAR ratio and TDR in the planetary boundary layer (PBL). Sun photometer derived AOD are presented in figure 2 for comparison. These values of AOD are correlated well as a whole, and the disagreement is mainly due to the different observation time, the different wavelength and the different integrated height. The averaged AOD during the period of the experiment was 0.81±0.57 at 675 nm for sun photometer measurement and 0.48±0.34 at 532 nm for Raman LIDAR measurement. Aerosol in PBL contributed about half to the AOD values in total atmosphere, indicating larger amount of aerosols existed in PBL over Beijing city. LIDAR derived aerosol extinction varied from 0.07 km-1 (4 May) to 2.56 km-1 (1 May), and the average value was 0.40±0.44 km-1. The large standard deviation of aerosol extinction demonstrates the large temporal variation of aerosols in PBL.
The LIDAR ratio during the experiment was in the range between 29.0sr (28 May) and 70.9sr (1 June), and the average value was 48.5±9.9sr, which is close to the mean value of 46.7±5.6sr found in south China [6]. The corresponding TDR was 8.1±5.2% with the minimal value of 2.2% (4 June) and the maximum value of 21.9% (20 May). There seems to have been a negative correlation between LIDAR ratio and TDR. One possible explanation is that the high value of TDR indicates the occurrence of a dust event, and the large dust particles decrease the LIDAR ratio. We applied the TDR of 10% as the threshold value for determining the dust particles and spherical aerosols. The result demonstrates that dust events occurred in 12 days during the 37-day experiment, and no dust events in 25 days. The averaged LIDAR ratio, TDR and extinction coefficient in dust events were 40.7±7.8sr, 14.2±4.2% and 0.25±0.11 km-1, respectively. The LIDAR ratio was consistent with the previous observation for Asian dust particles [7-8]. The corresponding values for no dust event days were 52.3±8.6sr, 5.2±2.2% and 0.47± 0.51km-1. The enhanced LIDAR ratio was associated with the small particles and the light-absorption aerosols. The bigger aerosol extinction for no dust events than for dust events suggests that the effect of spherical aerosol mostly produced by anthropogenic sources on air quality in Beijing is greater than that of the dust particles.
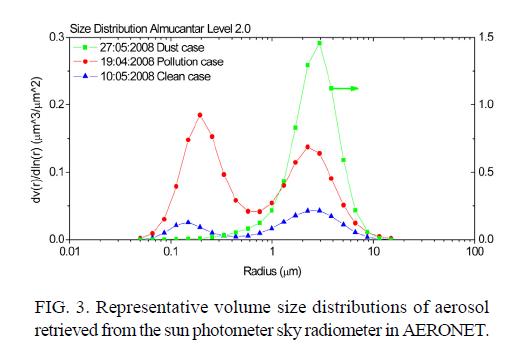
Figure 3 gives the representative volume size distributions in the air columns for dust, pollution and clean case. We can see that the coarse mode radius is commonly located around 3 μm in the dust case, which is consistent with previous reports on the size of Asian dust [7-8]. The retrieved AOD at 675nm was 1.64 and the Angstrom exponent was -0.06, the LIDAR ratio and TDR were 41.1sr and 19.5%, respectively. A distinctive fine mode centered near 0.2 μm is seen in the size distribution for the pollution case, which is characteristic of an urban polluted atmosphere. A coarse mode located near 2 μm is also seen in the pollution case.
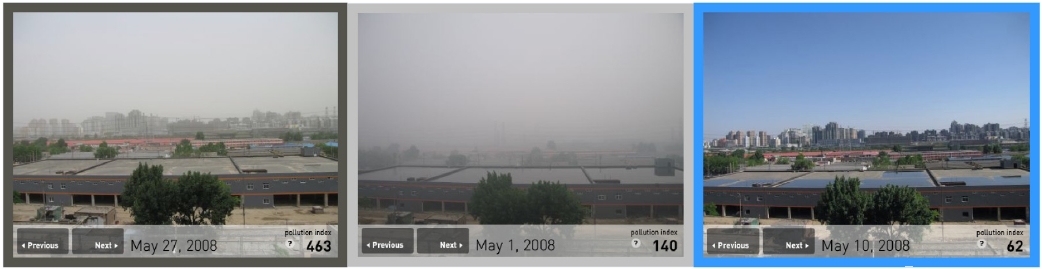
It reflects the presence of large particles which are probably the residue of a dust event or the production of incomplete combustion. The bi-mode size distribution which we have observed is frequently found in the pollution case in Beijing city [9-11]. The corresponding AOD was 1.38, Angstrom exponent 1.08, LIDAR ratio 53.8sr and TDR 6.6%. Although the bi-mode is seen in the size distribution of the clean case, the low volume concentration of aerosol particles indicated improved air quality. The AOD on that day was 0.22 and Angstrom exponent was 1.74. The LIDAR ratio and TDR were 57.0sr and 2.2%, respectively. The photos in dust (27 May 2008), pollution (1 May 2008) and clean (10 May 2008) cases are shown in figure 4 for depicting the air quality visually in Beijing. The value in the bottom right of photos is the API. It is interesting that the worst air quality does not happened for the dust case which has the biggest API (463), but for the pollution case with the middle API (140). It suggests that the observation of API or the mass concentration of particles is not enough to describe the real air quality in Beijing. The Raman LIDAR observation is required and effective supplement to monitor the air quality in Beijing.
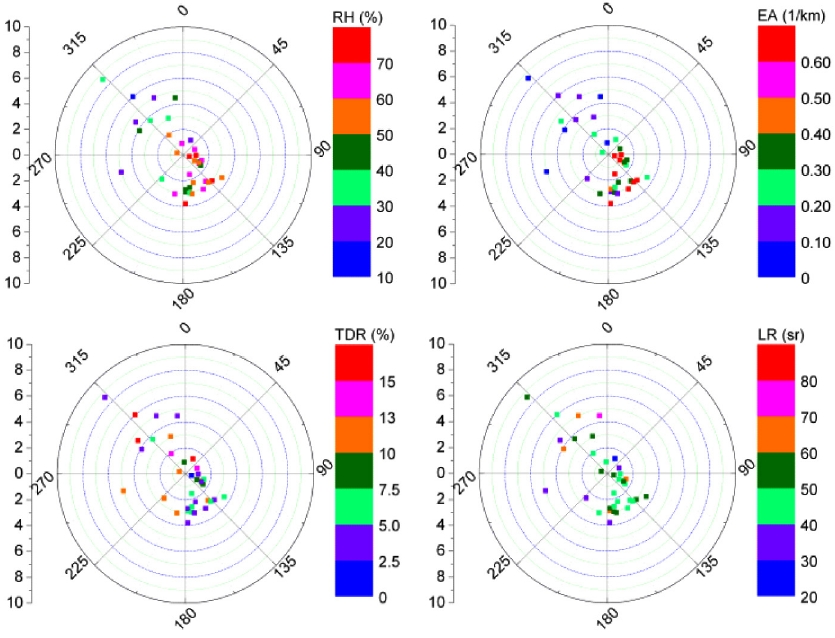
Figure 5 shows the variation of RH, aerosol extinction, TDR and LIDAR ratio as a function of wind speed and direction. It is easy to find that the southeasterly wind and northwesterly wind prevailed during the period of the experiment. For the southeasterly wind or weak wind, most of RH was greater than 50%, aerosol extinction was larger than 0.2 km-1, TDR was less than 10% and LIDAR ratio ranged between 40sr and 60sr. It implies the anthropogenic aerosol was produced locally or transported from the southeast of Beijing city. For the northwesterly wind, there were two different cases. One is the clean air case with RH of 20-50%, aerosol extinction less than 0.2 km-1, TDR smaller than 5% and LR from 50sr to 80sr. The other is the dust case with RH 10-40%, aerosol extinction less than 0.3 km-1, TDR larger than 10% and LR ranged between 30sr and 50sr. Beside the northwesterly wind, figure 5 demonstrates that some dust events were transported by the southwesterly wind to Beijing city. Similar to the results provided by photos in figure 4, figure 5 also indicates that the worst air quality with high value of aerosol extinction (EA) does not appear in the dust cases. The information in figure 5 is very useful to determine the probable sources of air pollution and dust aerosols in Beijing.
The continuous observation with Raman LIDAR at the Beijing site of NIES LIDAR network gave the high spatial variability of aerosol vertical structure and its optical properties such as AOD in PBL, LIDAR ratio and TDR. High TDR obviously resulted from the occurrence of dust events, and high AOD in PBL resulted from the impact of pollutant particles in Beijing. The LIDAR ratio decreased with TDR which implies the small LIDAR ratio mostly associated with the nonspherical and large aerosol, namely dust particles. The retrieved LIDAR ratio and TDR during the experiment were 41.1sr and 19.5% for dust events, 53.8sr and 6.6% for pollution events as well as 57.3sr and 7.2% for clean events. The correlation between the LIDAR ratio and the particle size is proved by the sun photometer and sky radiometer observation at the Beijing site in AERONET. The volume size distribution showed the presence of two modes for different atmospheric conditions, one accumulation mode with median radius 3 μm for the dust case, and bimode with fine particles centered at 0.2 μm and coarse particles at 2 μm for pollution and clean cases. The value of the volume size distribution at 3 μm in the dust case was obviously larger than the values in the pollution and clean cases. Using the observed surface wind field near the LIDAR site, it is found that most of the pollution aerosols were produced locally or transported from the southeast of Beijing, whereas the dust aerosols associated with the clean air mass were transported by the northwesterly or southwesterly wind.
The results above demonstrate that the Raman LIDAR is a very useful tool to observe the temporal variability of aerosol as well as to determine the aerosol types and their sources in conjunction with the data by instruments in AERONET and the surface observations. Beside the Beijing site, two LIDAR systems in Guangzhou and Hefei were upgraded to Raman LIDARs for quantitative and continuous observation of the local aerosol. Moreover, the new polarization and Raman LIDAR system is being developed for the Chinese Academy of Meteorological Sciences and will be installed in Beijing for monitoring the pollutant and dust aerosols in automatic and continuous operation in Oct. 2010. Because both the detecting range and the observing precision of the new Raman LIDAR system will be improved greatly over the one used in the NIES LIDAR network, it will provide detailed and comprehensive information about aerosols in Beijing for better understanding of their impact on the atmosphere and environment.