We present linear particle depolarization ratios (LPDRs) retrieved from measurements with an AERONET Sun photometer at the Gwangju Institute of Science and Technology (GIST), Korea (35.10° N, 126.53° E) between 19 October and 3 November 2009. The Sun photometer data were classified into three categories according to Ångstrom exponent and size distribution: 1) pure Asian dust (19 October 2009), 2) Asian dust mixed with urban pollution observed in the period from 20-26 October 2009, and 3) clean conditions (3 November). We show that the LPDRs can be used to distinguish among Asian dust, mixed aerosol, and non-Asian dust in the atmosphere. The mean LPDR of the pure Asian dust case is 23 %. Mean LPDRs are 13 % for the mixed case. The lowest mean LPDR is 6 % in the clean case. We compare our results to vertically resolved LPDRs (at 532 nm) measured by a Raman LIDAR system at the same site. In most cases, we find good agreement between LPDRs derived with Sun photometer and measured by LIDAR.
Optical and microphysical properties of atmospheric aerosols affect climate by direct and indirect radiative forcing [1-3]. Asian dust in particular represents a large portion of suspended atmospheric particles in East Asia [4]. Yoshino et al [5] show that the frequency of dust outbreaks is not restricted to spring time but can also be observed between summer and autumn. The dust may mix and react with other chemical components (e.g., SO4 2-, NO3 -, sea salt) during transport [6-7], which may lead to a modification of dust optical and microphysical properties. Therefore there has been increasing interest in the characterization and distinction of Asian dust from other aerosol types [8].
Shape, particle size distribution and chemical composition of aerosols influence their scattering characteristics and thus their radiative impact [9]. Linear particle depolarization ratios (LPDRs) can be used to distinguish ice clouds from water clouds [10]. LPDRs also allow us to unambiguously discriminate desert dust from other aerosols [11-13]. So-called depolarization LIDARs can be used to measure vertical profiles of LPDRs in a straightforward manner [14-15].
Aerosol Robotic Network (AERONET) Sun photometers are useful instruments for retrieving spectral aerosol optical, microphysical and radiative properties [16]. The AERONET inversion algorithm [17-19] that is used to retrieve aerosol properties from AERONET Sun photometer data has been developed in the past decade. Dubovik et al [18] show that particle size distribution and complex refractive index can be retrieved by means of fitting procedure that uses radiances measured with Sun photometer in the whole angular (almucantar) and spectral range (measurement channels).
For the case of mineral dust particles a specific lightscattering model for non-spherical particle geometry has been developed [16, 19]. This model is based on a shapemixture of randomly oriented polydisperse spheroids. A detailed explanation of the most recent version of the dust light-scattering model can be found in Ref. [19].
Muller et al [20] present for the first time LPDRs of Saharan dust derived with the AERONET dust light-scattering model. Up to now there exists no standard method to derive LPDRs for Asian dust from AERONET Sun photometer. In this contribution we introduce the LPDR retrieval method for Asian dust. We use AERONET Sun photometer data and the AERONET dust light-scattering model. We compare the LPDRs from Sun photometer to vertically resolved measurements of the LPDRs measured by our institute's multiwavelength Raman LIDAR system which is collocated with the AERONET Sun photometer.
An AERONET Sun photometer is operated on the rooftop of our institute's building at GIST (35.10° N, 126.53° E). Column-integrated spectrally-resolved aerosol measurements and sky-brightness observations (almucantar measurements) were made with the CIMEL 318-1 automatic tracking Sun and sky-scanning radiometer. Measurements of direct Sun radiation are conducted once every 15 min at 440, 675, 870, and 1020 nm wavelength. In the present study aerosol optical depth, aerosol phase function, complex refractive index and particle volume size distribution (for the radius range from 0.05 to 15 μm) are retrieved by the AERONET algorithm at the 4 standard measurement channels (440, 675, 870, and 1020 nm) [18-19]. Ångstrom exponents follow directly from the optical depth measurements. In the case of dust observations the AERONET dust-retrieval algorithm [19] is used.
Measurements with the GIST multiwavelength Raman LIDAR system were carried out at the same site [28]. Our system uses a Nd:YAG laser (Surelite III-10) for generating laser pulses at 355, 532 and 1064 nm with a repetition rate of 10 Hz. The emitted energy is 140 mJ at 355 nm, 154 mJ at 532 nm, and 640 mJ at 1064 nm. All three laser beams are aligned on the same optical axis. We use a Schmidt-Cassegrain telescope (focal length = 3910 nm) to collect the return signals. The laser beam is coupled from the side into the field-of-view of the receiver telescope, i.e., bi-axial configuration. Photomultipliers are used for signal detection. Interference filters and beam splitters are used to separate the atmospheric return signals according to wavelength. We detect the elastic backscattered signals at 355, 532 and 1064 nm, and signals from Raman scattering at 387 and 607 nm from nitrogen molecule, and at 407 nm from water vapor. The parallel-polarized and perpendicular- polarized signal components (with respect to the plane of polarization of the emitted laser beam) are measured at 532 nm.
In this work we present vertical profiles of the aerosol scattering ratio, the linear volume depolarization ratio (LVDR) and the LPDR measured at 532 nm. The minimum observation height is 500 m because of the incomplete overlap between the emitted laser beam and the field of view of the receiver telescope.
2.2. Particle depolarization ratio
2.2.1 AERONET Sun photometer
Dubovik et al [19] introduced kernel look-up tables for oblate and prolate particle shapes. These particle shapes serve as an approximation for describing the optical properties of mineral dust particles. The kernel look-up tables are used to infer the LPDRs from the Sun photometer data. The details of the AERONET inversion algorithm are given by Ref. [19]. Briefly the retrieval of the depolarization ratios works as follows.
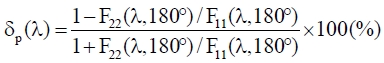
The elements F11(λ) and F22(λ) of the so-called Muller scattering matrices [27] are computed from the retrieved complex refractive indices and particle size distributions. The two parameters strongly depend on the angular and spectral distribution of the radiative intensity which is measured with the AERONET instrument [19]. For unpolarized incident light, F11(λ) is proportional to the flux of the scattered light [21]. Another input parameter that is needed for the retrieval of the LPDR is the so-called aspect ratio distribution. The aspect ratio describes the ratio of a particle's longest axis to its shortest axis. In case of prolate particles, its polar diameter is greater than the equatorial diameter, in contrast to oblate particles. The aspect ratio distribution is kept to a fixed distribution in the AERONET model, since scattering elements are nearly equivalent for all spheroid mixtures [19].
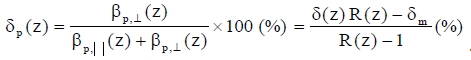
From the ratio of the elements F11(λ) and F22(λ) at the scattering angle 180° the LPDR σp(λ) can be computed as [19]
2.2.2 LIDAR
Our LIDAR system measures the LVDR (σ) from the linearly and perpendicularly polarized components of the Mie/Rayleigh backscatter signals at 532 nm wavelength [22]. The value of σ(particles + molecules) is defined as
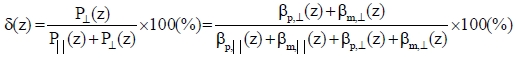
where P(z) is the backscattered signal with respect to height z; βp and βm are the volume backscatter coefficients of aerosol particles and air molecules. The symbol '' denotes the component of the return signal polarized parallel to the state of polarization of the emitted light.
The symbol ⊥ describes the perpendicularly polarized backscatter signal.
The LPDR σp can be calculated according to [22]
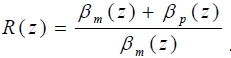
The backscattering ratio R is the ratio of the sum of the aerosol backscatter signal (βp+βm) to the pure molecular backscatter signal (βm), which is expressed by [23]:
The molecular depolarization ratio σm is assumed to be 1.4 % [24]. The column-mean LPDRs at 532 nm are computed on the basis of the geometrical depths of the aerosol layers, respectively.
AERONET Sun photometer measurements were performed at GIST from 19 October to 3 November 2009. During this measurement period we collected data on 8 days (19-21, 23-26 October and 3 November).
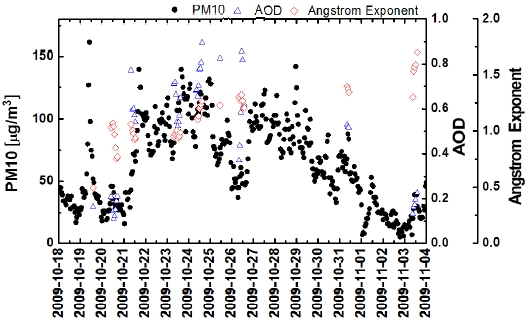
Figure 1 shows the temporal variation of the PM 10 concentration obtained by a beta gauge [25] at the Gwangju regional meteorological administration. Also shown are optical depth at 440 nm and the particle Ångstrom exponent (440-870 nm wavelength range) measured with the AERONET Sun photometer during this period.
Figure 1 shows high concentrations of PM 10 of 161 μg/m3 on 19 October. After that day the concentration of PM 10 decreased rapidly to a minimum value of 18 μg/m3 on 20 October. PM 10 values then increased again to relatively high concentrations from 33 to 142 μg/m3 between 22 and 31 October 2009. The lowest value of PM 10 concentration of 7 μg/m3 was measured on 3 November.
We have no AERONET data on 22, 27, 28, 29, and 30 October, and on 1 and 2 November because of the presence of clouds. We measured a low value of 0.16 (at 440 nm) for aerosol optical depth in the afternoon of 19 October when the dust concentration already decreased. Higher optical depths were measured from 20 to 31 October (0.56 ± 0.2). A comparably low optical depth was measured on 3 November (0.18 ± 0.04). Ångstrom exponents increased during the measurement period. The minimum values were 0.5, measured on 19 October. The highest values were 1.7, measured on 3 November.
In summary, Figure 1 shows the highest PM 10 concentration, but relatively low optical depths and Ångstrom exponents on 19 October. One reason for the low optical depths (despite the highest PM 10 concentrations) is the fact that the Sun photometer was operated after 5:00 UTC when the PM 10 concentration had already decreased. The peak of the PM 10 concentration occurred at 1:00 UTC on 19 October. Asian dust was reported by the Korea Meteorological Administration (KMA) on that day. The increased values of PM 10 concentrations and optical depth and the comparably low Ångstrom exponents measured from 20 to 31 October indicate the presence of a mixture of Asian dust and urban/industrial pollution. Low values of the PM 10 concentration and low optical depths were measured on the clean reference day on 3 November. The Ångstrom exponent was relatively high on that day, indicating the predominance of particles in the fine mode fraction (particle radius is less than 0.5 μm) of the particle size distribution.
On the basis of the previous numbers we divide our measurement period into 3 groups: the first group is the pure Asian dust case (19 October 2009), the second group is the mixed dust/pollution case (20, 21, 23, 24, 25, and 26 October 2009), and the last group is the clean case (3 November 2009).
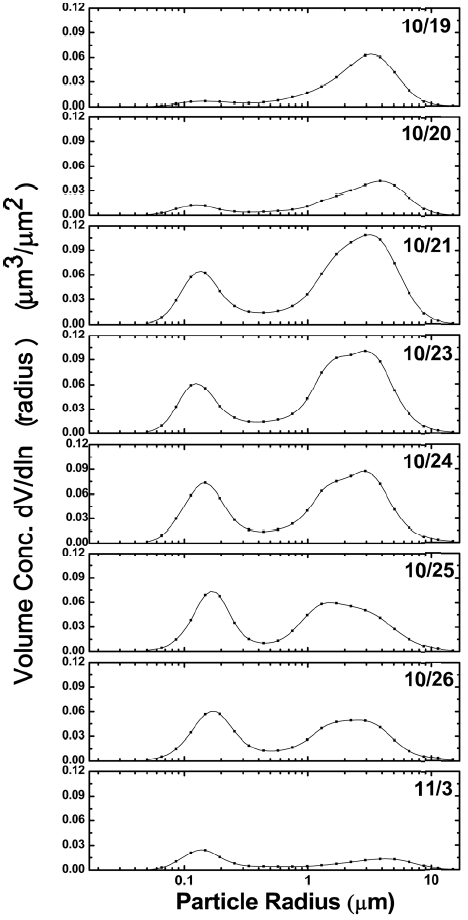
Figure 2 shows the particle volume size distributions which were derived from the AERONET measurements. The size distribution on 19 October shows a significant contribution of particles in the coarse mode fraction (particles radius larger than 0.5 μm) of the particle size distribution. We find a maximum value of 0.063 μm3/μm2 which makes up for 17 % of the total volume of the particle size distribution measured at that time.
The mixed Asian dust/urban cases which describe the period from 20-26 October, are represented by a high contribution of particles in the fine mode fraction (particle radius < 0.5 μm) of the particle size distribution. The highest values for the fine and coarse mode fractions are 0.074 μm3/μm2 and 0.108 μm3/μm2, respectively during 20-26 October.
We find a lower concentration of particles in the coarse mode fraction of the size distribution of the pure Asian dust case (19 October) compared to what was retrieved for the mixed cases. As mentioned before a possible explanation is that the peak concentration of atmospheric particles had already decreased on 19 October when the Sun photometer started operation; optical depth had already passed the peak value.
We find a concentration of 0.024 μm3/μm2 for the particles in the fine mode fraction on 3 November. The concentration of particles in the coarse mode fraction was comparably low on that day.
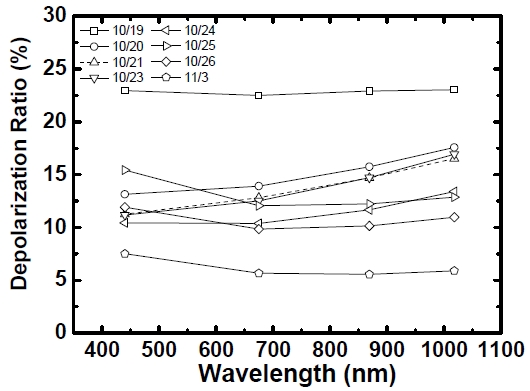
Figure 3 shows that the LPDR strongly depends on particle shape. The period when anthropogenic (urban/industrial) pollution was mixed with Asian dust (20 to 26 October) is characterized by a lower mean value of 13 % of the LPDR compared to the value for the pure Asian dust case (19 October) for which we find a LPDR of 23 %. This value is around 45% higher than the LPDR of the mixed pollution cases, indicating a comparably high share of particles of non-spherical shape on 19 October.
The LPDR averages to 6 % for the clean case (3 November), which is significantly lower compared to the numbers on the other days. The clear differences among the three cases can be used to distinguish whether we measured Asian dust, or a mixture of Asian dust with anthropogenic pollution, or pollution that contains a comparably low share of Asian dust particles.
Raman LIDAR observations were carried out at GIST during nighttime on 19, 20, 21, 23, 24, 25, and 26 October, and 3 November 2009.
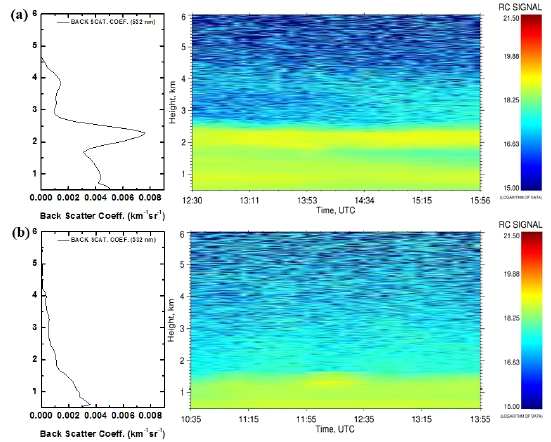
Figure 4 shows the time-height plot of the range-corrected backscatter signal at 532 nm for 23 October, and 3 November. The measured backscatter signals were summed to calculate the backscatter coefficients. The calculated profiles of the particle backscatter coefficients for each day are also shown. Figure 4 shows that the top height of the aerosol layer is approximately 4.6 km above sea level (asl) on 23 October. We find a high concentration of particles between 1.8 and 2.5 km asl (Figure 4(a), right panel). Backscatter coefficients are comparably high, approximately 0.008 km-1sr-1 in this height range (Figure 4(a), left panel). Figure 4(b) shows that the plume is rather well mixed on 3 November. The height of the plume is 1.7 km asl.
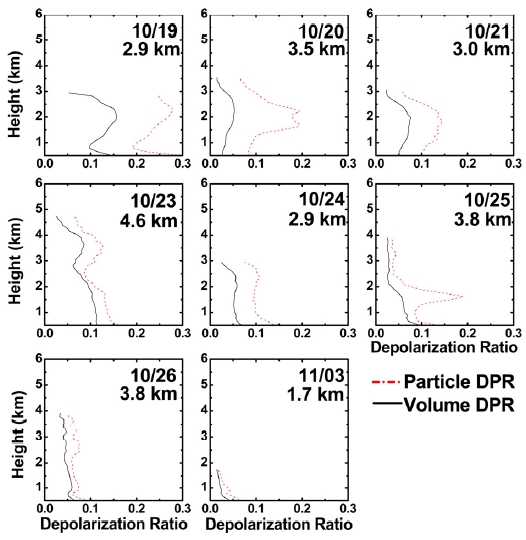
Figure 5 shows the LVDR and LPDR profiles. The LPDRs were approximately 28% between 1.5 and 2.5 km height on 19 October indicating a high concentration of nonspherical particles in this height range. We find a maximum value of 15% during the period of Asian dust-pollution that prevailed from 20 to 26 October. Figure 5 also shows low LVDRs and LPDRs of less than 0.6 % on 3 November, presenting the predominance of particles of nearly spherical shape.
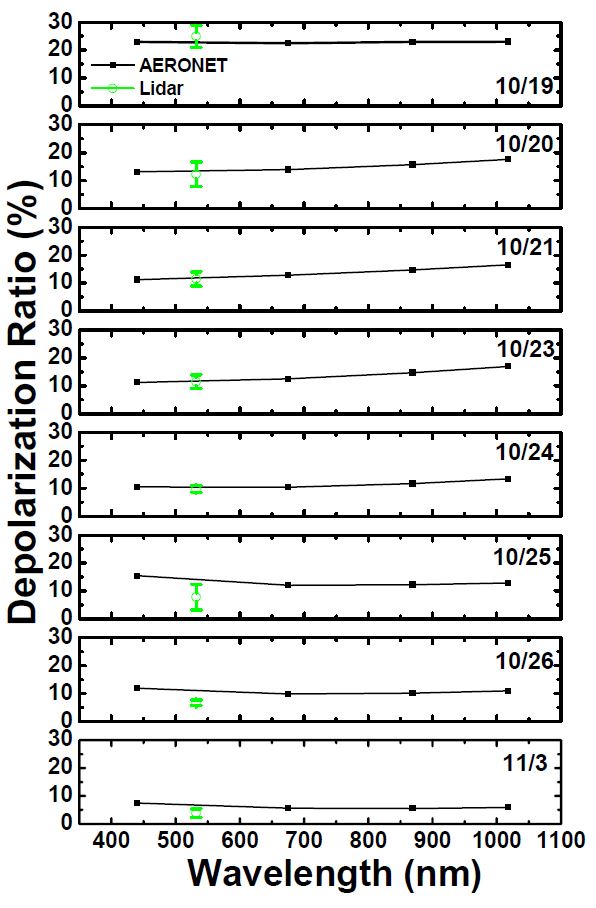
Figure 6 shows the LPDRs retrieved from the AERONET Sun photometer observations and the LPDRs (at 532 nm) measured with the GIST Raman LIDAR, see Table 1. The error bars (in terms of one-standard deviation) of the column-averaged LIDAR data represent the variation of the individual measurement points of the profile.
The LPDRs from the two instruments agree very well on 19, 20, 21, 23, and 24 October. Figure 6 shows discrepancies between LIDAR and Sun photometer derived values on 25 and 26 October. The LIDAR measured lower column-mean LPDRs than what was inferred from the AERONET observations. One possible reason for the differences may be the different measurement times of LIDAR and Sun photometer. The mineral dust/urban haze plume may have varied in its depolarization properties during the different measurement periods.
Another reason may be a data averaging effect. The LIDAR measures depolarization on a vertically resolved scale, and we need to reduce this information to a column-mean value in order to compare it to the Sun photometer results. It is known that such an averaging may lead to a different mean value, compared to a measurement that considers only a column integrated signals (from Sun photometer) if the profile is varying with height.
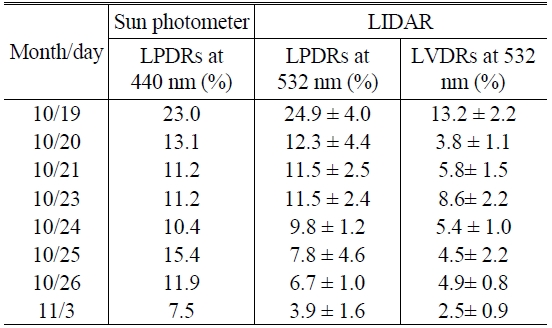
Values of the mean LPDRs retrieved with the AERONET Sun photometer, and LPDRs and LVDRs measured with the GIST LIDAR system.
Moreover we need to keep in mind that the LIDARderived data do not take account of the optical properties of the plume below 500 m height above ground. The incomplete overlap between the laser beam and the field of view of the receiver telescope does not allow for a reliable retrieval of LIDAR profiles in this height range.
We have only a very limited set of data available. Our LIDAR observations provide us with LPDRs at one wavelength, 532 nm, only. Therefore we must be very careful with drawing a general conclusion on the match or mismatch of the depolarization values from LIDAR and Sun photometer at the current stage of our data analysis.
Similar conclusions on a possible mismatch of LPDRs are presented in [29]. That study presents deviations of LPDRs measured with LIDARs at four wavelengths to LPDRs derived from AERONET Sun photometer. These observations were made during the Saharan Mineral Dust Experiment (SAMUM) in Morocco in 2006 [9, 20 ,26].
One possible explanation for this more general problem of matching LPDRs from AERONET Sun photometer observations to LIDAR measured LPDRs may be rooted in the fact that the AERONET light-scattering model has never been developed for applications to particle light-scattering properties at a scattering angle of 180°. The AERONET model has only been developed for describing the lightscattering properties of mineral dust for scattering angles up to 150°. In this sense our study of the AERONET light-scattering model enters a new stage of model development.
Linear particle depolarization ratios (LPDRs) were derived from Sun photometer measurements at Gwangju, Republic of Korea, with the AERONET desert-dust light-scattering model. We show that the AERONET retrieved LPDRs can be used for distinguishing between periods of Asian dust, mixtures of dust with urban haze, and non-Asian dust (urban haze) observed in the atmosphere over Gwangju on several days in October/November 2009.
We present a comparison of LIDAR-measured LPDRs and AERONET-derived LPDRs for 19 October (pure Asian dust case), 20-26 October (Asian dust-pollution mixed case), and 3 November (clean case). We find good agreement of the LPDRs between the AERONET-derived data and the LIDAR-measured values in most cases of Asian dust mixed with anthropogenic pollution. We find disagreement for a few measurements. A clear explanation cannot be provided. However, we emphasize that the AERONET lightscattering model has never been designed for applications to LIDAR-derived optical data which describe signals scattered at an angle of 180°. We will develop a lightscattering model that accounts for Asian dust properties.