Digital holography (DH) is a potentially disruptive new technology for many areas of imaging science, especially in microscopy and metrology. DH offers a number of significant advantages such as the ability to acquire holograms rapidly, availability of complete amplitude and phase information of the optical field, and versatility of the interferometric and image processing techniques. This article provides a review of the digital holography, with an emphasis on its applications in biomedical microscopy. The quantitative phase microscopy by DH is described including some of the special techniques such as optical phase unwrapping and holography of total internal reflection. Tomographic imaging by digital interference holography (DIH) and related methods is described, as well as its applications in ophthalmic imaging and in biometry. Holographic manipulation and monitoring of cells and cellular components is another exciting new area of research. We discuss some of the current issues, trends, and potentials.
Digital holography (DH) is a potentially disruptive new technology for many areas of imaging science, especially in microscopy and metrology. By replacing the photochemical procedures of conventional (analog) holography with electronic imaging, a door opens to a wide range of new capabilities. Although many of the remarkable properties of holography have been known for decades, their practical applications have been constrained because of the cumbersome procedures and stringent requirements on equipment. In DH, the holographic interference pattern is optically generated by superposition of object and reference beams, which is digitally sampled by a CCD camera and transferred to a computer as an array of numbers. The propagation of optical field is completely and accurately described by diffraction theory, which allows numerical reconstruction of the image as an array of complex numbers representing the amplitude and phase of the optical field. DH offers a number of significant advantages such as the ability to acquire holograms rapidly, availability of complete amplitude and phase information of the optical field, and versatility of the interferometric and image processing techniques. Indeed, digital holography by numerical diffraction of optical fields allows imaging and image processing techniques that are difficult or infeasible in real space holography [1, 2].
Dennis Gabor invented holography in 1948 while attempting to improve upon the resolution of electron microscopy, where the correction of electron lens aberrations posed increasing technical difficulty [3]. Instead of attempting to perfect the electron imaging lens, Gabor dispensed it altogether and realized that the diffraction pattern of the electron beam contained complete information regarding the amplitude and phase of the electron wave. The holography principle was immediately applied to recording and imaging by visible light [4]. But it had to wait for two critical inventions before the full potential was to be realized. One was the powerful coherent source of light in laser to provide high quality interference contrast. The other, due to Leith and Upatnieks in 1962, was the off-axis illumination with a separate reference wave, thus eliminating the problem of the zero-order and twin images of the Gabor’s on-axis configuration [5]. Soon many new techniques and applications of holography began to develop.
Although microscopy was a critical motivator for the invention of holography, its development in biological and medical imaging applications has been very limited, compared, for example, to holographic interferometry of mechanical systems. The first holographic microscopy of living organism was obtained by Knox in 1966, demonstrating the ability to record the optical field of a whole sample volume [6]. Another example is the analysis of the tympanic membrane vibrations in cats [7]. The cumbersome procedures, inability to view and process real time images, and the speckle noise problems all likely have contributed to the lack of enthusiasm, these factors perhaps being more crucial in biomedical microscopy than in mechanical interferometry and metrology.
Digital holography replaces the physical and chemical recording processes with electronic ones and the optical reconstruction with numerical computation. In 1967, J. Goodman demonstrated the feasibility of numerical reconstruction of an image from a Fourier hologram detected by a vidicon camera [8]. Schnars and Jueptner, in 1994, were the first to use a CCD camera directly connected to a computer as the input and compute the image in a Fresnel holography set up [9]. In the last decade or so, many powerful and useful techniques and applications of DH have been developed. A single hologram is used to numerically focus on the holographic image at any distance [10, 11]. Direct access to the phase information leads to quantitative phase microscopy with nanometer sensitivity of transparent or reflective phase objects [12, 13], and allows further manipulations such as aberration correction [14]. Multi-wavelength optical phase unwrapping is a fast and robust method for removing 2π-discontinuities [15]. Suppression of the zero-order and the twin images by phase-shifting digital holography allows efficient use of the pixel array [16]. Holography of low coherence light is an important issue and DH again provides novel solutions in this regard [17, 18]. Optical scanning holography (OSH) is capable of producing holograms of fluorescence [19-22].
The quantitative phase microscopy by digital holography has been applied to imaging various cell types, including SKOV-3 ovarian cancer cells [23], fibroblast cells [11], testate amoeba [24], diatom skeletons [25], and red blood cells [26]. It is also used to investigate various cellular dynamics such as drug-induced changes in cells [27-29]. In [30], digital holographic microscopy (DHM) is used to monitor laser microsurgery on cells, for quantitative evaluation of the damage and repair of cells and cellular organelles in real time. In [26], live erythrocyte (red blood cell) membrane fluctuations were measured. Deformation of phospholipid vesicles in a microchannel flow was measured as a model of red blood cells in capillary flow [31]. Time-varying cellular and subcellular features are imaged with sub-micron, diffraction-limited resolution, and movies of holographic amplitude and phase images of living microbes and cells are created from a series of holograms and reconstructed with numerically adjustable focus [11]. Digital Gabor holography (DGH) is excellent for imaging 3D distribution of particulate microbes [32, 33]. Underwater instruments have been constructed for monitoring marine planktons and particulates [34, 35]. DGH was used to investigate the flow field generated by the appendages of a copepod [36]. Deformation of tissues under mechanical impact has been imaged using double pulse digital holography [37]. Recognition and identification of biological cells by digital holography was studied [38]. The continuing unabated advances in digital imaging and computing technologies assure increasing ranges of applications and capabilities of digital holography.
This article provides a partial overview of the digital holography, as well as a description of some of the recent efforts from the author’s laboratory, with an emphasis on its applications in biomedical microscopy. We start in Sec. 2 with a summary of the basic principles of digital holography. In Sec. 3, the quantitative phase microscopy by DH is described including some of the special techniques such as optical phase unwrapping and holography of total internal reflection. Section 4 describes techniques of holographic tomography including digital interference holography and its applications in ophthalmic imaging and in biometry. Holographic manipulation and monitoring of cells and cellular components is another exciting new area of research, described in Sec. 5. We discuss some of the current issues, trends, and potentials.
II. PRINCIPLES OF DIGITAL HOLOGRAPHY
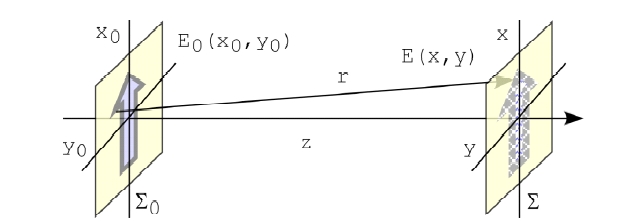
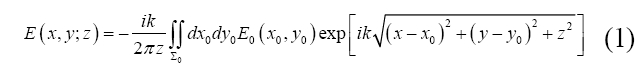
The theory of holography have been considered by many authors for both analog [39] and digital implementations [10, 40-46]. For DH, a main issue is efficient and accurate computation of the diffraction integral. For general purpose, three most common approaches for DH calculation are the Huygens convolution, Fresnel transform and angular spectrum methods. We start by writing down the Fresnel-Kirchoff diffraction formula for the general problem of diffraction from a two-dimensional aperture depicted in Fig. 1 [47]. Given the optical field E0(x0, y0) over the input plane 0 at z = 0, the field E(x, y) over the output plane at z is, with the wavelength λ2π/k,
This is a convolution integral
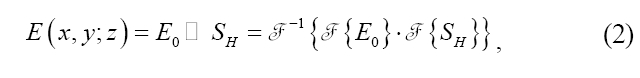
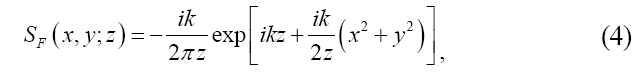
where the point spread function (PSF) is
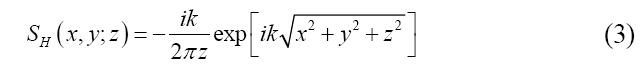
representing the Huygens spherical wavelet. The Huygensconvolution is usually computed with three Fourier transforms [48]. Fresnel or paraxial approximation of the PSF is
and the diffraction field is
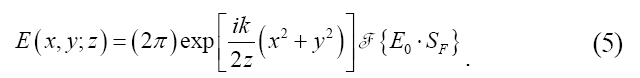
The Fresnel transform method therefore involves a single Fourier transform [49]. An alternative approach to describe diffraction is by analysis of the angular spectrum, as
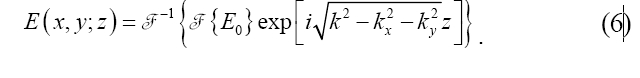
where F {E0} is the angular spectrum of the input field, and the exponential is the propagation phase factor. The angular spectrum method, or plane wave expansion, requires two Fourier transforms [50, 51].
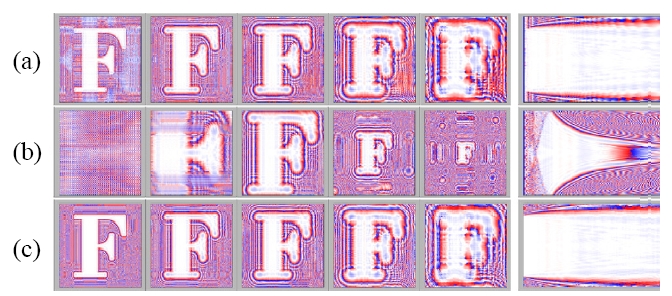
The numerical diffraction methods of Huygens convolution (Eq. 2), Fresnel transform (Eq. 5), and angular spectrum (Eq. 6) are compared using simulation examples in Fig. 2,
where the diffraction phase images of the letter “F” are calculated at several propagation distances. It also shows yz-cross sections of the propagation over a range of distance. Several observations can be made. The pixel resolution does not change with distance for the convolution and angular spectrum methods, whereas the the pixel size and the output plane size grows linearly with the distance for Fresnel transform method. Also evident is that there is severe distortion at distances shorter than ? for the Fresnel method. The short-distance behavior is better for the convolution method, but the angular spectrum method yields valid diffraction images for all short distances, including zero. The angular spectrum method is based on propagation of plane waves. Sampling of the plane waves by the discrete pixels of CCD does not vary with the distance, and therefore the angular spectrum method does not have any distance limitations. On the other hand, the Fresnel transform method is based on the propagation of spherical wavefronts(or its parabolic approximation). When the center of curvature is too close to the CCD array, local fringe frequency on the CCD plane may be higher than Nyquist frequency. Moreover, there also is a maximum distance that yields correct diffraction pattern for Fresnel transform method. For large enough distances the fringe period becomes larger than the entire CCD array, failing to record any diffraction information. Angular spectrum does not have this limitation either. It is to be noted that the terminology and relevant approximations of the various methods in the literature are not uniform and comparison of results, such as the minimum and maximum distances, must be made with some care.
The effect of digital sampling on the PSF of holographic image formation is proportional to
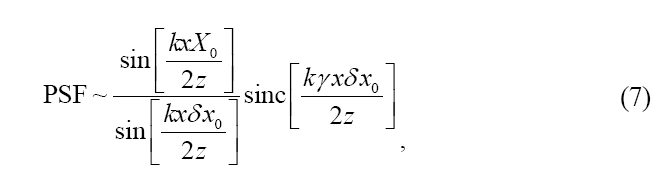
where X0 and [Equation Ommited] are the size of the CCD array and the pixel pitch, respectively [40, 44]. The sinc function, having a width of [Equation Ommited], is due to the finite fill factor, 0 < γ < 1, of the light-sensitive area of each pixel. For a small fill factor, γ→0, the image is uniform in amplitude throughout the image plane. On the other hand, integration over the pixel area with larger fill factor results in vignetting, especially for shorter image distance z. The sine-over-sine factor gives the lateral resolution of a point image to be [Equation Ommited], which shows the expected dependence on the numerical aperture of the camera array[52]. The axial resolution is given by [Equation Ommited] ?
Other methods of numerical diffraction include wavelet or Fresnelet approach [53], fractional Fourier transform for highly astigmatic systems [54], and windowed Fourier analysis [55]. The Wigner space diagram is utilized for spacebandwidth analysis of holographic image formation [41]. Three-dimensional (3D) optical transfer function (OTF) for DHM is given in [56]. Numerical techniques are also available for addressing specific purposes such as dc and twin term removal [57-59] diffraction onto an inclined planes [51, 60, 61], automatic focus detection [62, 63], two-step Fresnel diffraction method for pixel resolution control [64], and aberration compensation [65].
III. QUANTITATIVE PHASE MICROSCOPY BY DIGITAL HOLOGRAPHY (DHQPM)
Many biological specimens, such as living cells and their intracellular components, are mostly transparent, making it difficult for conventional bright field microscopies. Current methods for imaging transparent objects, such as dark field microscopy, Zernike phase contrast, and differential interference contrast, are not capable of quantitative imaging and analysis. Digital holographic microscopy, because of the direct access to the phase profile, provides highly efficient and versatile phase imaging modality and it is undergoing rapid development. Subnanometer resolution of optical thickness has been demonstrated [13], the refractive index and physical thickness can be separated from the optical thickness [66], and optical phase unwrapping using three LEDs of different wavelengths has been demonstrated [67, 68]. The ability to emulate various microscopy methods - including bright field, dark field, phase contrast, and DIC, from DHM has also been demonstrated [69]. Commercial holographic microscopes are coming on to market.
Figure 3 illustrates typical processes for quantitative phase microscopy by digital holography, with images of a layer of onion cells. Interference of object and reference optical fields results in the hologram, Fig. 3(a), which is what the CCD camera records. The holographic microscopy apparatus typically consists of an interferometer, based on Michelson or Mach-Zehnder configurations, with microscopic imaging optics, to project on the camera a magnified image of the holographic interference pattern. The angular spectrum normally contains a zero-order and a pair of first-order components, corresponding to the twin holographic images, as in Fig. 3(b). One of the first-order components can be separated from the others with a numerical band-pass filter if the off-axis angle of the reference beam is properly adjusted. Numerical diffraction of the hologram results in the reconstructed optical field as a matrix of complex numbers, yielding the amplitude (Fig. 3(c)) and phase (Fig. 3(d)) images. The phase image has 2π -discontinuities, if the object thickness variation is more than a wavelength. The phase image can be unwrapped using a phase-unwrapping numerical algorithm, as is done in Fig. 3(e), and rendered as a pseudo- 3D graphics in Fig. 3(f).
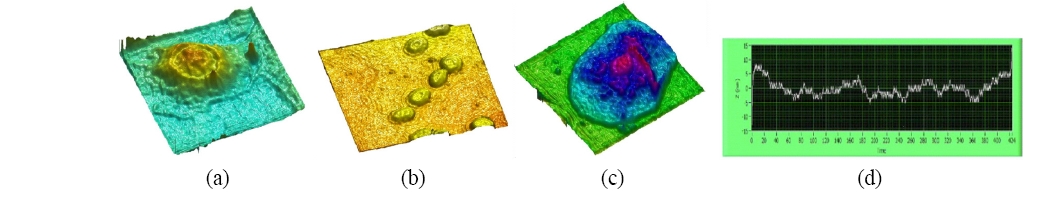
A few more examples of digital holographic phase microscopy are presented in Fig. 4 [23]. These images represent profiles of optical thickness for light transmitted through the cells on slide glass. In particular, Fig. 4d) is an optical thickness profile of a glass substrate surface, where the full vertical scale is 30 nm. The rms noise is about 3 nm in optical thickness or less than 2 degrees in phase. Such high precision in optical thickness allows imaging of subtle variations in physical and biochemical conditions in cellular and intracellular structures. For example, an index variation of Δn = 0.0003 of a 10 ㎛ thick layer can be readily
discerned by digital holographic phase microscopy.
3.1. Multi-Wavelength Optical Phase Unwrapping (OPU)
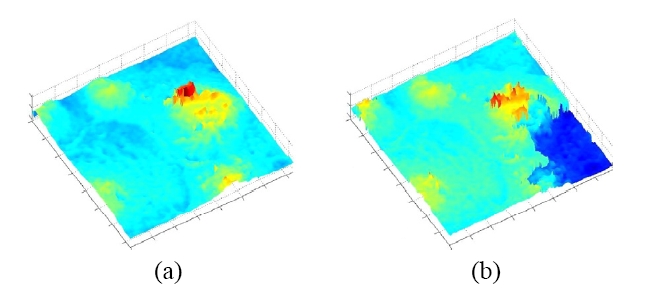
The digital holography is thus capable of high resolution quantitative phase microscopic imaging. On the other hand, the phase images contain 2π-discontinuities for objects of optical depth greater than the wavelength. Most of the phase unwrapping algorithms require subjective assumptions for detection of phase discontinuity, cannot properly handle certain types of phase topology, and are highly computationintensive. We have previously introduced a dual-wavelength phase-imaging technique that removes the 2π-discontinuities by using two different wavelengths for generating two phase maps and comparing them. The result is a new phase map with a synthetic wavelength A12= [Equation Ommited] . We have applied the dual-wavelength phase imaging method to 3D imaging of SKOV-3 ovarian cancer cells [70]. Figure 5(a) shows the intensity image, which is similar to what one can see using the ordinary microscope, while Fig. 5(b) displays a single wavelength wrapped phase image, and Fig. 5(c) shows the dual-wavelength unwrapped phase image. Finally, Fig. 5(d) displays a pseudo-3D rendering of the unwrapped phase map. The images in the Fig. 6(a) and (b) shows a different confluent area of the same sample generated by optical and software unwrapping, respectively. Notice that the software unwrapping algorithm erroneously
created a phase step on the lower right corner, where lack of light intensity caused excess phase noise. The optical unwrapping, however, still renders correct unwrapped profile.
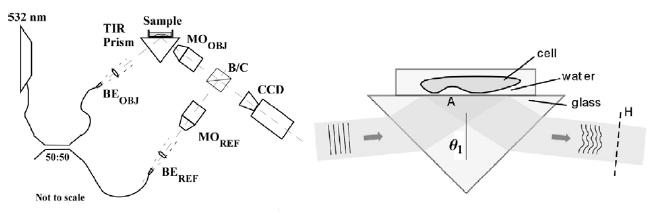
3.2. Total Internal Reflection Holographic Microscopy (TIRHM)
The microscopy of cellular adhesion is important for a deeper understanding of cellular motion and morphogenesis. Cell-substrate interactions, including attachment, spreading, morphology changes, and migration, require a complex series of events to occur in a regulated and integrated manner. Currently, the primary tools for imaging and studying these surface processes have been total internal reflection fluorescence microscopy (TIRF) and interference reflection microscopy (IRM). The TIRF images reveal localization of fusion protein in cell focal adhesions at the substrate interface in contrast to the blur produced by out-of-plane fluorescence in the epi-illumination image. While this provides for excellent functional imaging, information on the morphology of the cellular membrane surface is largely absent in TIRF. In IRM, light waves reflected from two surfaces of the cellsubstrate interface produces interference fringes, thus allowing estimation of the interface thickness profile. While this allows for a qualitative interpretation of the surface profile, the interference image of the interface is usually complicated by the reflection image of the cell body and its contents.
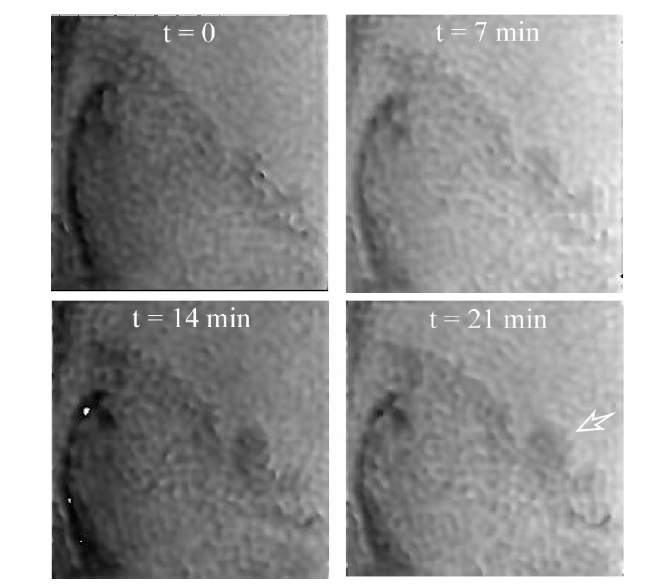
In order to address these issues and characterize the cell substrate interface, evanescent wave surface profiling is incorporated with digital holographic microscopy (DHM) into a new imaging technique termed total internal reflection holographic microscopy (TIRHM) [23, 71]. TIRHM uses a prism in TIR as an imager in the object arm of a Mach- Zehnder digital holographic microscope. As depicted in Fig. 7, the presence of microscopic organisms, cell-substrate interfaces, adhesions, and tissue structures on the prism’s TIR face causes modulation of the phase front of the TIR-reflected light, and the digital holography is used to image the modulated phase profile, allowing for quantitative imaging of the sample’s focal adhesions at the samplesubstrate interface. Figure 8 is an example of TIRHM of live Amoeba Proteus, placed in a covered reservoir directly on the hypotenuse face of the prism, where psuedopod move
ment may be discerned. Based upon the analysis of phase images, one can evaluate which portions of the cell membrane are within the range of the evanescent field, measure the phase shift for those portions of the cell, and use this phase shift for quantitative imaging of the sample’s focal adhesions at the sample-substrate interface.
IV. 3D MICROSCOPY AND TOMOGRAPHY
One of the important challenges for biomedical optics is noninvasive three dimensional imaging, and various techniques have been proposed and available. For example, confocal scanning microscopy provides high-resolution sectioning and in-focus images of a specimen. However, it is intrinsically limited in frame rate due to serial acquisition of the image pixels. Another technique, optical coherence tomography (OCT), is a scanning microscopic imaging technique based on low coherence interferometry to coherently gate backscattered signal from different depths in the object
[72]. Tomography by holography is possible through diversity of wavelengths as in digital interference holography (DIH) [73-75] or diversity of angles as in optical diffraction tomography [25, 76-78]. Optical sectioning has also been demonstrated using optical scanning holography (OSH) [79, 80].
4.1. Digital Interference Holography (DIH)
Digital holography, like any general holography methods, reproduces a three-dimensional optical field, but it does not directly provide topographic or tomographic information - i.e., a three-dimensional distribution of scattering centers of the object. To accomplish this, one needs a means to measure the distance to the object points. Optical coherence tomography extracts the distance information by interference of low-coherence light. We have developed digital interference holography (DIH) for synthesizing the low coherence by superposition of many holograms using a range of wavelengths [73].
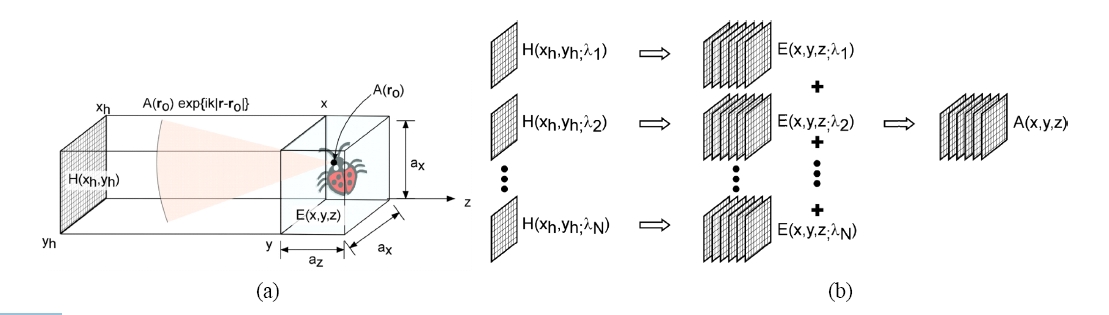
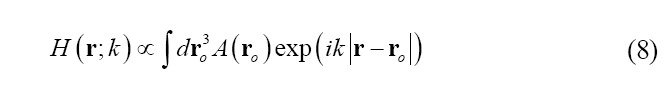
Briefly, suppose A(r0) represents the amplitude of the optical field scattered or reflected by an object point at r0, Fig. 9(a). According to Huygens’ principle, each of the object points emits a spherical wavelet, which arrives at the hologram plane to contribute to the hologram formation. The object field at an arbitrary point r is a superposition of these wavelets from all the object points:
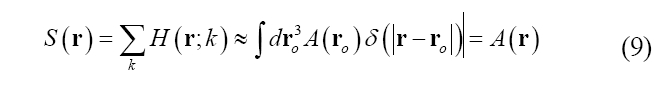
For tomography, the scattering amplitude A(r0) needs to be unraveled from the total field H(r; k). Noting that H(r; k) depends on the wavenumber k, superposition of many H-fields with a range of k results in:
In practice, a finite number NH of holograms are acquired using a range Δk of wavenumbers at equal intervals ?=Δ k/NH, Fig. 9(b). Then the resulting tomographic/topographic image has axial resolution z δ = 2 2 / / k π λ λ Δ ? Δ , where
and are the average wavelength and wavelength range, respectively. The maximum axial size of the object that can be imaged unambiguously is Δz =2π /δ k ?λ 2 /δλ
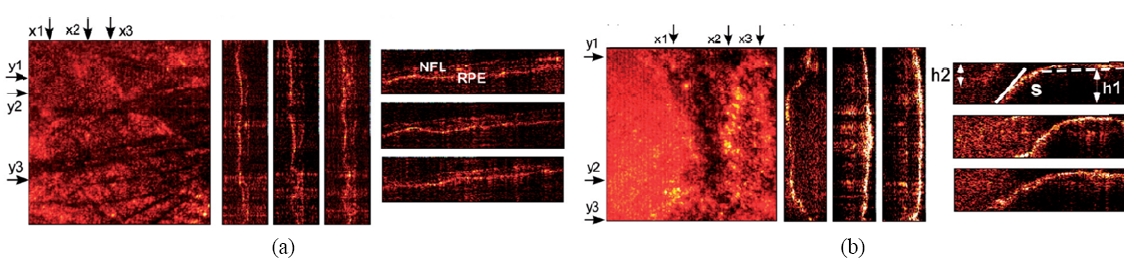
The DIH instrument consists of a Michelson interferometer illuminated by a tunable laser such as a dye laser, together with imaging optics to form an image of the object on the CCD camera. Polarization optics is used to control illumination ratio between the object and reference beams, as well as for minimizing stray reflections from optical surfaces. The images presented here were obtained from an excised human eye supplied to us by the Lions Eye Institute for Transplant & Research of Tampa, FL [81]. The holographic image acquisition and computation of the optical field of the macula sample are carried out for about 50 wavelengths in the range of 560-600 nm. Superposition of images, in the DIH processes described above, reveals the tomographic mapping within the macular tissue, Figure 10(a), and clearly delineates borders of blood vessel segments. The imaged surface area is 5020×5020 ㎛2 with an axial range A=209.75 ㎛. The 3D pixel resolution is x×y×z = 19.6×19.6×4.2 ㎛3 The optical thickness between the retinal nerve fiber layer (NFL) and the retinal pigment epithelial layer (RPE) is measured to be about 84 ㎛. Another example is given in Fig. 10(b), where the optic nerve disk height and slope are measured with precision to be 355.11 ㎛ and 47℃, which are important parameters in clinical ophthalmology. Digital Interference holography (DIH) offers rapid 3D imaging with theoretically higher resolution than OCT, and without the need to reassemble images from scans. Our research has already demonstrated that, in vitro, DIH can measure the dimensions of the scleral ring and provide a definitive answer regarding the size of the optic disk, a clinically important parameter that is not provided by current OCT instruments.
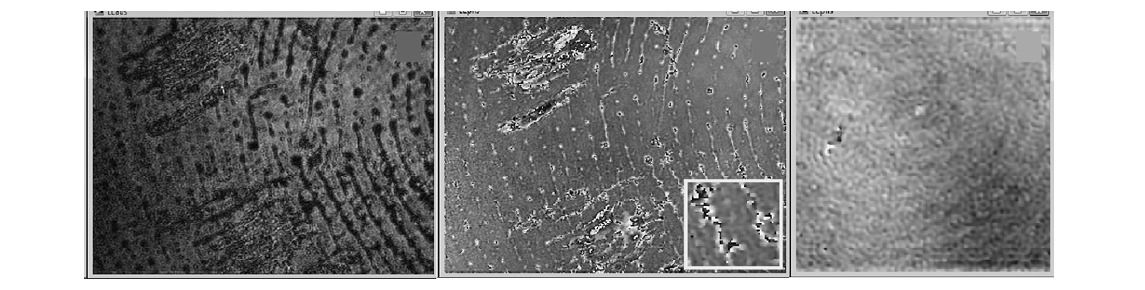
Though it has a long history, fingerprinting continues to develop in many aspects. New developments include small and inexpensive fingerprint capture devices, fast and less expensive computing hardware, and higher authentication rate to meet the needs of many applications. Reliability can be improved in widening application areas and diverse operating environments by increasing the information content of the acquired data through multi-modal imaging, multi-spectral imaging, and three-dimensional imaging. We have studied the feasibility of using digital holography and interferography to acquire two- and three-dimensional fingerprint images [82]. Figure 11 shows latent fingerprint image obtained by holographic phase microscopy. Both the amplitude and phase images clearly display the friction ridge patterns. The sample was prepared simply by pressing a finger onto a clean slide glass and the images are acquired within a few minutes. There appear to be some smudges of the oily film as well. Closer examination of the two images reveal that
the phase image has significantly quieter background than the amplitude image. Coherent noise in conventional holograms is a significant issue, but it is much less of a problem in phase images of digital holography. The ridge marks left by the water and oily film of fingerprint is still liquid and appear to have several wavelengths, or microns, of thickness, which is evidenced by wrapped phase discontinuities within many of the ridge lines, as shown in the inset. The phase image from a fingerprint sample prepared in a similar manner but left in open air for several days is also shown. In this case, the watery substance appears to have mostly evaporated, but one can still discern the whorl pattern of residues left behind, a small fraction of a micron thick.
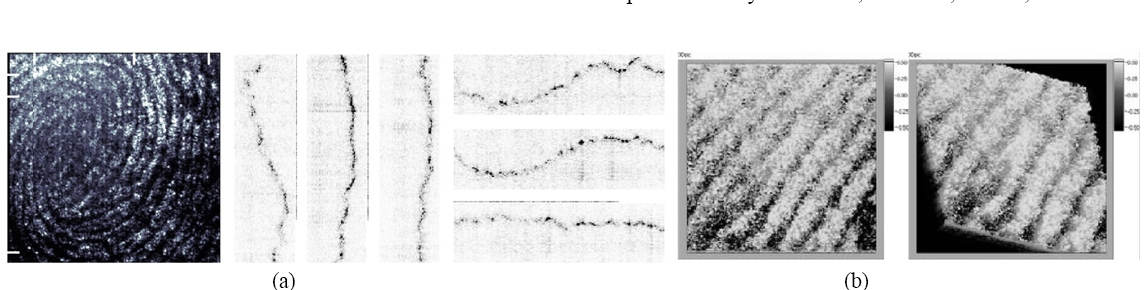
Next we apply the digital interference holography (DIH) for imaging the three-dimensional surface of plastic prints. For example in Fig. 12, the laser wavelength is scanned over the range 559~599 nm at 50 intervals. The cross-sectional views clearly depict the crests and valleys of the friction ridges, with about 750 ㎛ ridge periodicity and about 50 ㎛ depth of grooves. Notice in Fig. 12(b) an important level 2 (minutiae) feature called crossover, which is a short ridge that runs between two parallel ridges. The length of the ridge between the end points is 1700 ㎛.
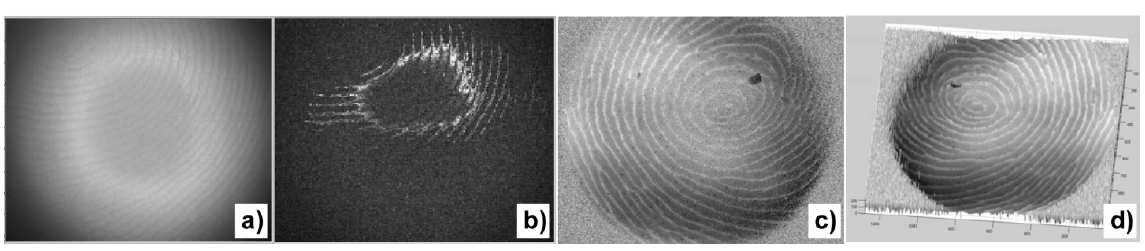
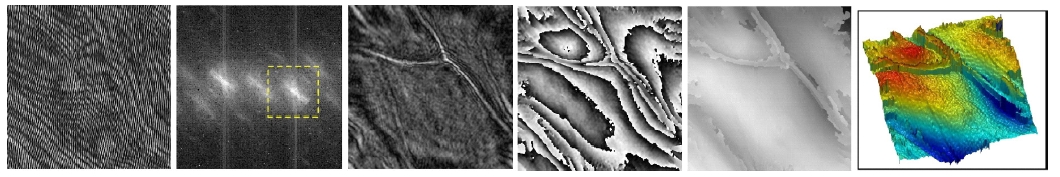
We also present LED-based wide-field optical coherence tomography for imaging of plastic prints on MikrosilTM. Figure 13(a) is an example of an interferogram with FOV = 15×12 mm, where coherent interference speckles are barely visible. Phase-shifting method extracts a contour section of the surface that is within a coherence length with respect to the reference mirror, as shown in Fig. 13(b). The object z-position is then scanned over a distance of 700 ㎛ to accumulate the surface contours. This fingerprint sample displays level 1 whorl pattern, as well as many of the level 2 and level 3 features, including the bifurcation, ending, cross-over, and pores.
V. LASER MANIPULATION OF CELLS
Manipulation of particles and cells through optical force leads to a new technology to elucidate, interrogate, and model the role of physical forces on varying cellular functions, including metastasis, metastatic potential, or motility [83-86]. This is coupled with the capability of digital holography to quantitatively and temporally model, monitor, track, and characterize changes that occur at the cellular level. Marriage of the holographic optical tweezers (HOT) [87] and digital holographic microscopy (DHM) is particularly attractive. DHM provides three-dimensional location and imaging of cells while HOT controls the location and movement. From the fusion, a host of new capabilities are expected to emerge, such as smart tracking and trapping, artificially patterned growth and motion, and automatic control of cellular micromanipulation and microsurgery [88].
5.1. Laser Microsurgery of Cells
Microscope-based laser scissors uses a focused laser beam to alter and to ablate cellular and tissue samples, as well as intracellular organelles. It has become an important tool for cell biologists for studying the molecular mechanism of complex biological systems. Visualization of transparent microscopic biological specimens such as living cells and their intracellular constituents being manipulated by a laser scissors is difficult using conventional bright-field microscopy. We have combined the laser scissors and off-axis digital holographic microscopy to record quantitative phase images during the process of laser microsurgery. The introduction of quantitative phase imaging with laser scissors makes it possible to evaluate quantitatively the damage or the repair of the cells and organelles in real time [30].
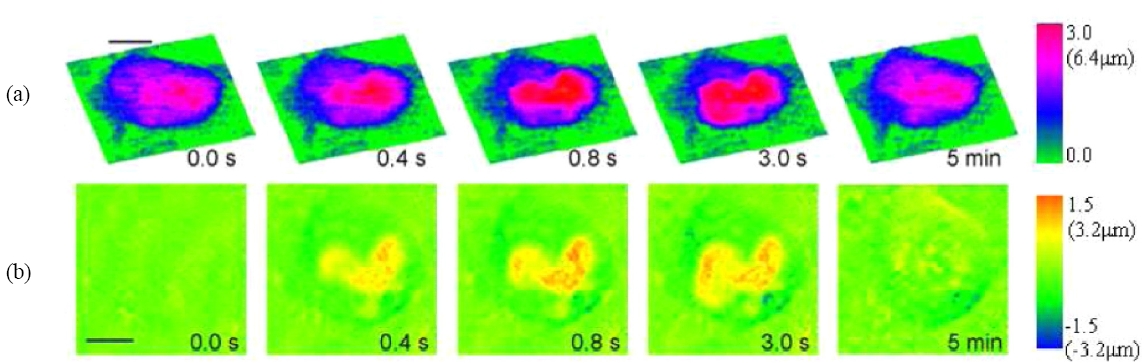
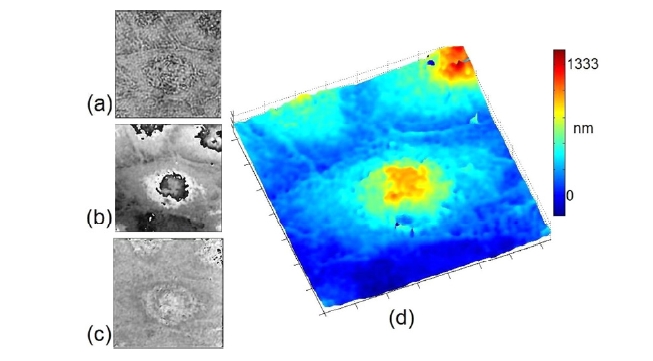
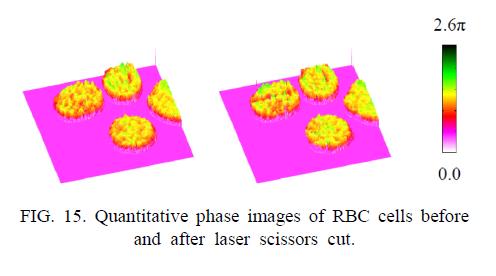
Figure 14 shows images of rat kangaroo kidney epithelial (PTK2) cells ablated with a laser microbeam, where the laser was targeted at a spot on a chromosome. The top row of images are quantitative phase microscopy images by digital holography, while the second row depicts difference of the phase images relative to the initial state. Evidently, the laser ablation is accompanied by a swelling of the cell, whose quantitative analysis is possible. The cell swelling is about 6.4 ㎛, assuming a refractive index of 1.38 for the cell and 1.33 for the buffer. The swelling dissipates in less than 5 minutes and the cell recovers its original shape. For another example, Fig. 15 shows DHQPM images of red blood cells before and after a laser scissors cut.
5.2. Characterization of Optical Pressure and Optical Trapping by Digital Holography
In order to study cellular characteristics, it is important to use techniques that affect the subject as little as possible. Using a focused laser beam to directly trap portions of the cell can lead to problems of overheating as well as unintentional local mechanical property changes due to large refractive index materials being pulled toward the focus. Our approach is to apply optical pressure using a broad wavefront over the surface of the cell without the use of intermediate materials or invasive focus. We then observe and measure the resulting deformation using a Mach-Zehnder configured digital holographic microscope. This provides us with a noninvasive tool to produce quantitative phase images and movies of the cell throughout the process. We can therefore measure the deformation of the cell with nanometric precision enabling the possibility of studying cell mechanical properties using “light-only” manipulation and imaging techniques. Some proof-of-principle experiments have been carried out, whose results are presented below [89, 90].
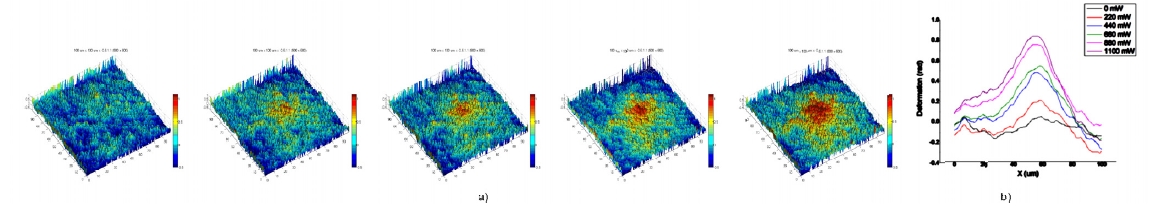
Figure 16 demonstrates the deformation of a liquid interface under optical pressure. The sample material is a suspension of micelles in toluene and silicone grease. Under certain conditions, the toluene and silicone parts separate into distinct phases of different indices of refraction forming an interface with relatively low surface tension. A loosely focused laser impinges on the interface causing a deformation due to momentum transfer according to
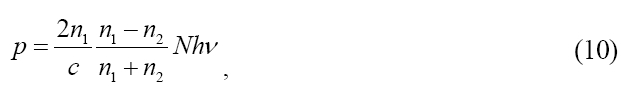
which also shows that the deformation of the interface is always toward the direction of smaller index regardless of the direction of propagation. The data in Fig. 16 indicates
approximately linear increase in deformation with the incident light power. Deformations as small as 40 nm were readily measured using DHQPM. From such data the surface tension of the interface can be determined.
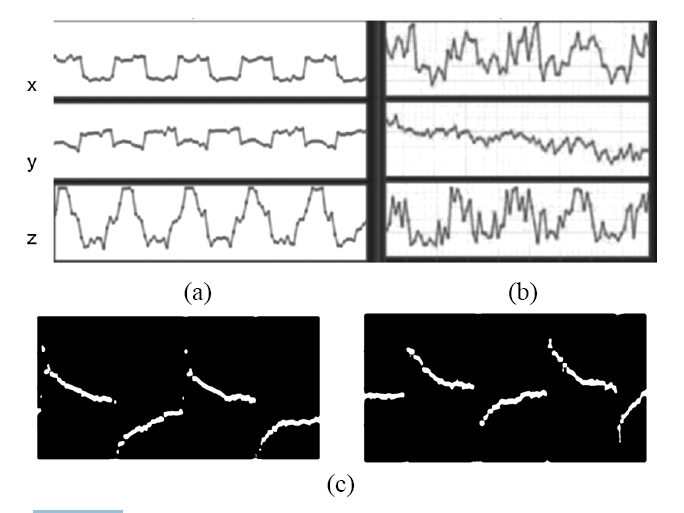
In another experiment, we have used digital Gabor holography to calibrate a optical trapping system. DH reconstruction followed by 3D low-pass filtering, thresholding, and centroid calculation allowed determination of the 10 ㎛ microsphere’s positions with 50 nm precision in all three directions. Figure 17(a) displays 3D position measurements while the cover slip, on which the spheres are dry-fixed, is shifted by piezo transducers with 500 nm square wave for horizontal (xy) direction and 1200 nm sine wave for vertical (z) direction. Each panel’s scale is 1500 nm×10 s. In Fig. 17(b) the motion is 100 nm horizontal and 120 nm vertical, and the scale is 100 nm×10 s.
The system can also be used for calibration of optical trap strength. In Fig. 17(c), with a microsphere in water trapped in the trapping laser focus, the coverslip containing the water drop is shifted with piezo-driven square wave. The microsphere momentarily shifts with the water medium but relaxes back to the trap focus. Each panel’s scale is 4.0 ㎛×4.0 s. Measurement of the relaxation time can be used to determine the trapping force if the viscosity is known, or vice versa.
This article provided an overview of the digital holographic microscopy and its biomedical applications. Exciting new capabilities are illustrated using examples from the author’s research results, which are a small sampling of impressive progress being made by many researchers throughout the world. Commercial holographic microscopes have been developed. DHM has started attracting serious attention from biomedical researchers. Researchers from many different areas in physics, biology, engineering, are medicine are involved in the research, development, and applications. It is easy to predict that the continuing advances in computer and imaging technologies will only accelerate the development of powerful instruments and wider applications. Hopefully, this article has conveyed some of the progressive energy in this young technology and have whetted the curiosities of more capable students and researchers.