It is well known that we can reconstruct the threedimensional (3-D) image of objects from a hologram. Recently digital holograms have been proposed in which the hologram of objects is recorded as a digital signal and reconstructed using numerical computation of wave propagation [1-3]. One of the most promising techniques in digital holography is Optical Scanning Holography (OSH) [4-6]. OSH records a complex hologram of an object’s intensity and as a result, we can record the complex hologram of the objects without speckle noise [5]. This intensity recording property of OSH gives the potential for 3-D fluorescence microscopy applications [7]. OSH is reconstructed digitally by convolving the complex conjugate of Fresnel zone plate (FZP) with the hologram. This is the same as conventional digital holography, in which the FZP’s distance parameter is set according to the depth location of the objects. However, since the depth location of the objects is unknown, digital reconstructions with different distance parameters are required until we get a focused image. Unfortunately, this searching process is time consuming and requires a manual process. Recently several numerical techniques that extract the distance parameter directly from the hologram without reconstructions have been proposed [8-10]; however, these involve a search algorithm [9, 10] or a tracking process [8]. Most recently, an auto-focusing technique based on the Wigner distribution analysis of a hologram has been proposed [11]. In the proposed technique, we extract the distance parameter directly from the hologram without any searching or tracking process. However, a manual process that measures the slope of the Wigner distribution output is required in order to determine the distance parameter. In this paper, we propose to extract the distance parameter directly from the hologram using axis transformation without any manual processes. In section 2, we will briefly review 3D holographic microscopy using OSH in which the 3D image of a specimen is extracted as a form of a complex hologram. In section 3, we propose an algorithm that extracts the distance parameter.
First, the complex hologram of a specimen is recorded by OSH. Next, the real-only spectrum hologram is synthesized using the complex hologram. The power fringe adjusted filtered output of the real-only spectrum hologram becomes a FZP which contains the information of the distance parameter as a form of chirp signal. Then a new frequency axis which increases evenly along the square root of the original frequency axis is generated. The FZP is relocated along the new frequency axis using interpolation. The FZP in the new frequency axis becomes a signal with single frequency that is directly proportional to the distance parameter. The inverse Fourier transformation of the FZP reveals a delta peak pair whose location corresponds to the distance parameter. Finally, we extract the distance parameter by detecting the location of the delta peak pair. Reconstruction with the distance parameter gives a focused image of the specimen without a searching process. The advantage of extracting the distance parameter directly from the hologram is to reconstruct the hologram through convolution starting from the distance parameter, thereby bypassing the blind convolution starting at the origin of the hologram.
II. 3D MICROSCOPY USING OPTICAL SCANNING HOLOGRAPHY
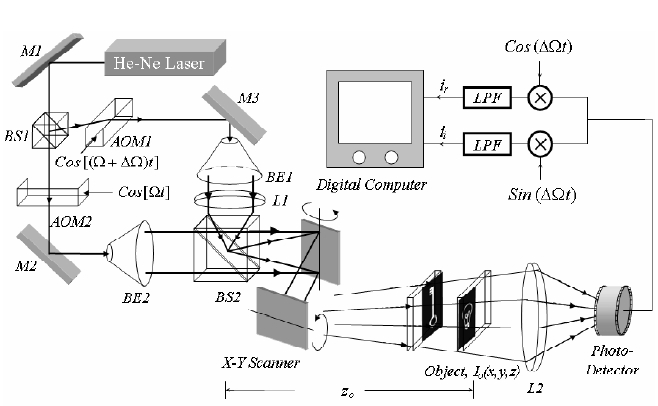
The details of OSH shown in fig. 1 have been intensively investigated previously[12], and the potential of OSH for 3D microscopy imaging has been demonstrated[5]. Thus, in this section, we will briefly review the principles of OSH. As shown in fig. 1, a time-dependent Fresnel zone pattern (TD-FZP) is created by the interference of a plane wave and a spherical wave, both frequencies shifted by acousto-optic frequency shifters (AOFS1 and AOFS2). The OSH scans a specimen of intensity reflectance, I0(x, y; z) with the TD-FZP and the reflected light from the specimen is collected by space integrating photo-detector (PD). At each scanning location, the In-phase and Quadrature-phase output currents iI(x, y; z) and iQ(x, y; z) are generated by a phase sensitive detection scheme and stored in a digital computer according to the scanning locations. A complex hologram is constructed subsequently by adding the two stored outputs in the following manner [12, 13]
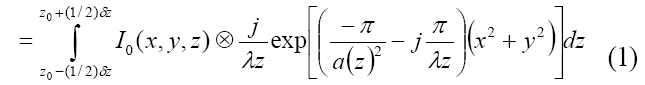
spherical wave to the middle of the specimen (described as a distance parameter) [11], and ? is the depth range of the specimen. Here, a(z) = NA × z determines the radius of the TD-FZP where represents the numerical aperture defined as the sine of the half-cone angle subtended by the temporally modulated FZP. The symbol ? in Eq. (1) denotes the two dimensional convolution operation defined as ( , ) ( , ) ( ', ') ( ', ') ' ' 1 2 1 2 g x y ? g x y = ∫∫ g x y g x ? x y ? y dx dy . Note that the distance parameter is encoded in the phase of the hologram, but the phase is intermixed with phases of the FZPs along the depth range of the specimen. In the following section, we will separate the phase that contains only the information about the distance parameter using Gaussian low pass filtering and synthesis of a real-only spectrum hologram. Next, the distance parameter will be extracted using axis transformation.
III. EXTRACTION OF A FZP WHICH CONTAINS THE DISTANCE PARAMETER
In 3-D microscopy application of OSH, the phase of the hologram is intermixed with the phases of each cross sectional image which is encoded with the FZPs at corresponding depth locations. Therefore, we need to extract the FZP which contains only the information concerning the distance parameter from the hologram. This can be accomplished by using the Gaussian low pass filter, synthesis of real-only spectrum hologram, and power fringe adjusted filtering. The algorithm that extracts the FZP has been described previously in the context of digital filtering [11]. Accordingly, we will briefly review the proposed digital filtering technique. First, the complex hologram as in Eq.(1) is filtered by a Gaussian low-pass filter with transfer function, The Gaussian low-pass filtered hologram is given by the following equation:
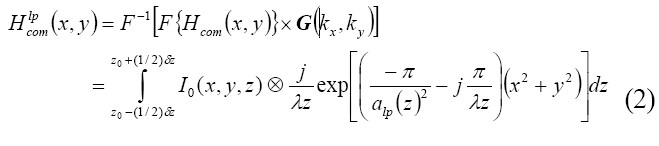
where F{.} represents the Fourier transform operator defined as [Equation Ommited] denoting spatial frequencies and F-1{.} represents its inverse. In Eq. (2), a (z) [Equation Ommited] determines the radius of the Gaussian low pass filtered hologram. Hence, the Rayleigh range of the Gaussian low pass filtered hologram evolves into the following equation:[Equation Ommited] . In Gaussian low pass filtering, we set NAg such that the Rayleigh range of the FZP is larger than the depth range of the object, i.e. Δz ≥δz . The radius of the scanning beam pattern is approximately constant within the depth range of the object, i.e., [Equation Ommited]. This makes the phase of the Gaussian low pass filtered hologram stationary within the depth range of the specimen [11, 14]; thus, we can extract the FZP which contains the information only about the distance parameter from the hologram. Next, a real-only spectrum hologram in the frequency domain is synthesized and is given by the following:
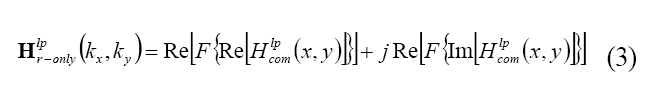
where Re[ ] and Im[ ] are operators that extract the real and imaginary parts of a complex number, respectively. After projecting the real-only spectrum hologram onto the ky direction, we filter the square of the projected real-only spectrum hologram by a power-fringe-adjusted filter [15-18]. The power-fringe-adjusted filtered output is given by:
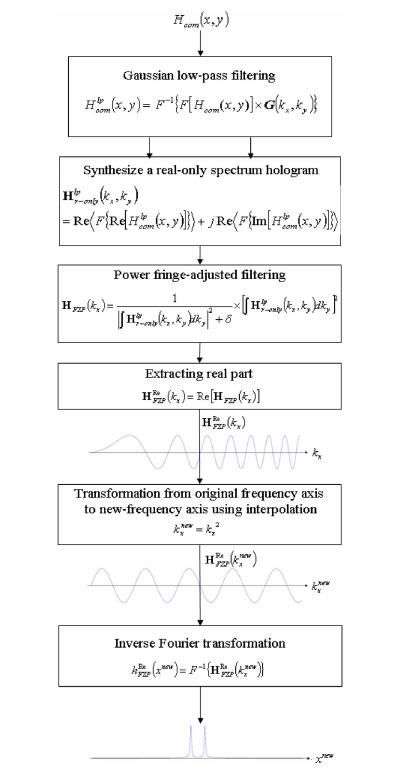
Note that the filtered output is the one-dimensional FZP with the distance parameter. Figure 2 shows a flow chart of the proposing algorithm and its first three blocks illustrate the procedures discussed so far.
IV. AXIS TRANSFORMATION AND EXTRACTION OF THE DISTANCE PARAMETER
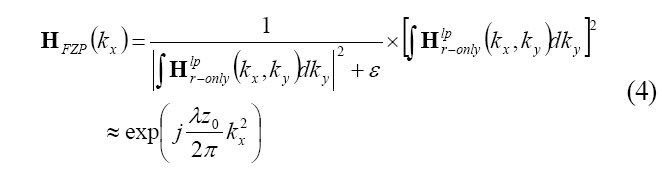
In this section, we propose a frequency flattening technique to extract the distance parameter directly from the power fringe adjusted filtered output. As in Eq. (4), the filtered output is a chirping signal whose chirping rate is determined by the distance parameter. In the previously proposed technique, the chirping rate is extracted using the Wigner distribution [11]. However, the Wigner distribution reveals the distance parameter as the slope of a delta line on a space-frequency map. This requires measuring the slope of the delta line to achieve the distance parameter. Unfortunately, this is processed manually; it is also a tedious process. Therefore, in this section, we introduce a new frequency axis in which the frequency of the chirp signal is flattened; accordingly, the inverse Fourier transformation of the chirp signal in the new frequency axis reveals the distance parameter directly. For the sake of simplicity, we limit our analysis to the equations in the continuous domain. First, the real part of Eq. (4) is extracted and is given by the following:
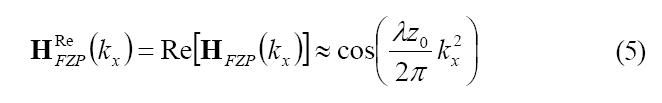
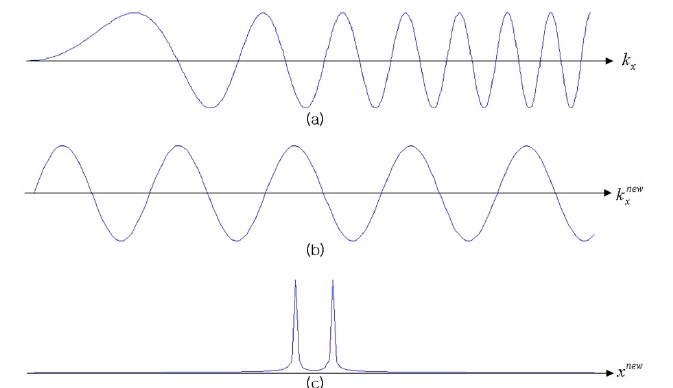
Note that the interval between zero crossing points is linearly reduced as the frequency axis increases as shown in fig. (3a). Here, we introduce a new frequency axis that is transformed from the original frequency axis in which the interval between zero crossing points is constant, as shown in fig. (3b). The new frequency axis is given by the equation [Equation Ommited] . The transformation from original frequency axis to new-frequency axis for ?≥ is achieved by the interpolation of Eq. (5) to the new
frequency axis. Using the interpolation, the chirp signal in the new-frequency axis emerges as a sinusoidal signal:
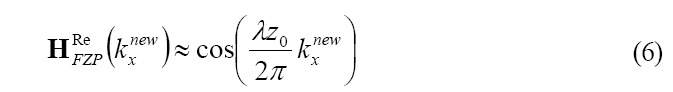
Note that this sinusoidal signal has a single frequency and the frequency of the signal is directly proportional to the distance parameter. Hence, the inverse Fourier transformation of Eq.(6) expresses the delta function pair in the new spatial axis:
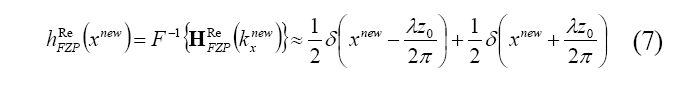
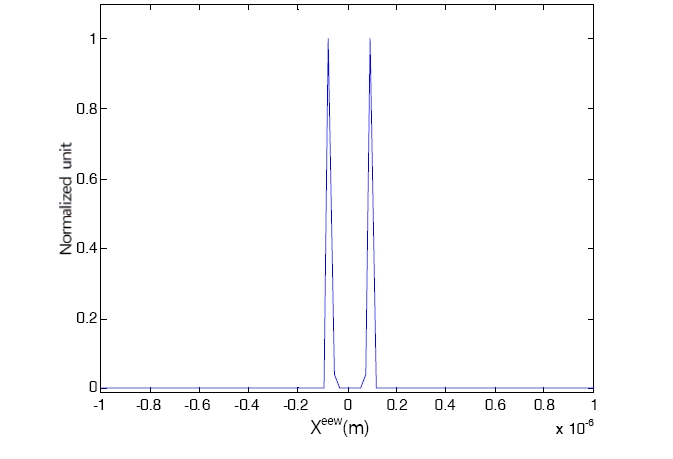
Note that the location of the delta function pair gives the distance parameter. This can be extracted directly by detecting the location of the maximum value of Eq. (7). Figure 2 shows the flow chart of the proposing algorithm; its last three blocks illustrate the axis transformation procedures discussed so far. Just as for the previously proposed techniques, the accuracy of the distance parameter depends on the signal-to-noise ratio of OSH [18]. Using the distance parameter, z0, we reconstruct the full 3D image of the specimen through convolution starting from the distance parameter, thereby bypassing the blind convolution beginning at the origin of the hologram.
We record the complex hologram of a specimen that consists of two slides using OSH as shown in fig. 1. The front and back slides are transparencies of a “light bulb” and a “key.” The size of both transparencies is approximately 1.1 cm × 1.1 cm and the depth distance between the two slides is 20 cm. In the experiments, we use a HeNe laser with the wavelength, λ = 633 nm. The radius of the scanning beam is r = 7.5 mm while the focal length of the lens used to make a spherical wave is f = 500 mm.
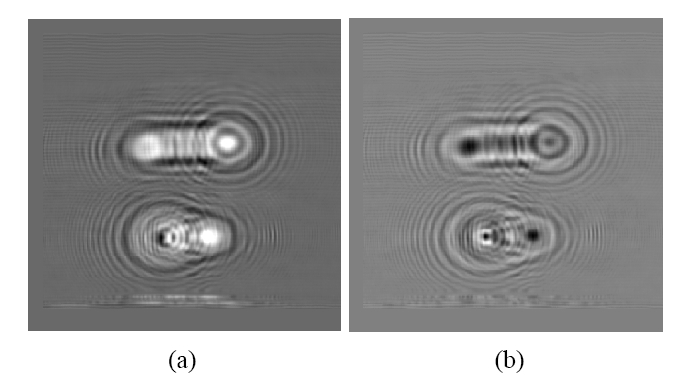
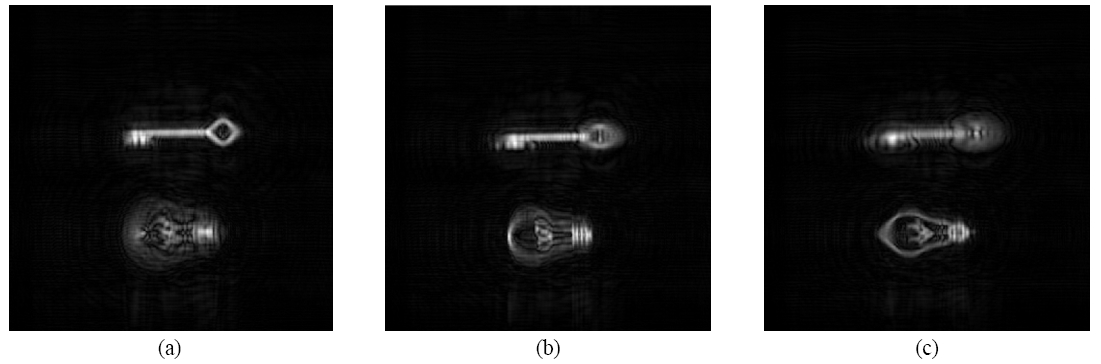
The numerical aperture of the scanning beam is given by NA = r / f = 0.015. The numerical aperture and the wavelength of the scanning beam determine the Rayleigh range of the scanning beam, that is z[Equation Ommited]. The specimen is located 85 cm away from the focal point of the spherical wave. Described in figure (4), one can see how the OSH gives the specimen’s cosine and sine holograms. The complex hologram is recorded by adding the cosine and sine holograms as in Eq. (1). The chirp signal is extracted according to the first three blocks of the flow chart shown in fig. (2). Here, we set the NAg = 0.00116. This generates [Equation Ommited] cm which is larger than the depth range of the specimen. Next, the chirp signal is processed according to the last three blocks of the flow chart. The final output of the block diagram then becomes the delta function pair and the location of the delta function pair gives the depth location of the specimen. Figure (5) shows the exponential of final output, [ ( new )] FZP exp hRe x . According to Eq. (7), the depth location is calculated by z x cm new [Equation Ommited] nm is the location of the delta function pair shown in fig. (5). The subsequent reconstructions of the hologram along the depth range of the specimen, i.e.[Equation Ommited] , using the distance parameter are shown in fig. (6).
In this paper, we proposed an axis transformation technique that reveals the distance parameter directly without any manual process. In the previously proposed auto-focusing algorithm, we extract the distance parameter using Wigner distribution. This requires measuring the angle of the delta line on a space-frequency map manually [11]. However, in the newly proposed technique, we transform the chirp signal to the single frequency signal by axis transformation and thus, the simple inverse Fourier transformation of the signal in the new frequency axis gives us the delta function pair. From the location of the delta function pair, we can extract the distance parameter directly without any manual process. The full 3D image of the specimen is reconstructed through convolution starting from the distance parameter, thereby bypassing the blind convolution starting at the origin of the hologram.