Optical-coherence tomography (OCT) is a highly pro-mising method for the high-resolution, noninvasive imaging of tissue morphology in vivo [1]. Conventional OCT systems are constructed based on low-coherence interfero-metry, and the axial-image resolution is determined by the spectral bandwidth of the light source employed. This means that ultrabroad-bandwidth light sources must be used so that systems can obtain higher in-depth-resolution tissue images. The commonly employed broadband light sources include semiconductor-based superluminescent diodes (SLDs) [2], amplified spontaneous emission (ASE) from semicon-ductor optical amplifiers [3], rare-earth-doped-fiber ASE [4], and supercontinuum (SC) sources [5].
Even if good-performance OCT imaging can be achieved with the use of the light sources mentioned above, there is still a need to develop new types of light sources to improve the OCT performance. One high potential candidate is the optical-fiber-based SC source. Conventional fiber-based SC sources have been realized by using the combination of a high-peak-power subpicosecond pulse laser and a highly nonlinear optical fiber [6]. When high-peak-power pulses propagate through a highly nonlinear optical fiber, their optical spectrum is broadened due to a variety of nonlinear effects, and the spectrum is finally converted into an SC. In generating an SC from ultrashort pulses, the use of normally dispersive nonlinear fibers is essential to suppre-ssing significant spectral modulation and amplitude fluctuations, which are caused by the nonlinear amplification of input pulse noise [7]. The pulse-mode SC has been widely investigated as a broadband source for high-resolution OCT imaging [8, 9].
On the other hand, SC was also found to be generated in the continuous-wave (CW) mode by using a partially-coherent CW pump beam [10-13]. The physical mechanism for CW SC evolution in optical fiber is slightly different from pulse-mode SC evolution [10-13]. Modulation insta-bility (MI) converts an initial, partially-coherent CW beam coupled into a nonlinear anomalous-dispersion fiber into large numbers of ultrashort soliton-like pulses. When the noisy pulses of random peak powers and durations propagate through the fiber, stimulated Raman scattering (SRS) trans-forms the time-averaged spectrum of the noisy pulses into a broad and flat spectral continuum [13]. Various types of partially-coherent light sources have been proposed for the generation of CW SC; for example, a high-power Raman fiber laser [10, 14, 15], a rare-earth-doped-fiber amplifiedspontaneous- emission (ASE) source [16, 17], a low-coherencesemiconductor laser diode [18], and a rare-earth-doped-fiber laser [19, 20]. It is evident that recent technological advances in implementing high-quality nonlinear optical fibers as well as high-power fiber amplifiers enable the practical implementation of stable CW SC sources. The applicability of CW SCs to OCT imaging has been investigated by Hsiung et al. [20]. They performed an experimental demonstration, using a CW SC source that had been generated from a high-power Yb fiber laser.
A series of investigations of CW SCs have also been carried out by our group [15, 17, 21, 22, 23]. In particular, the research has focused on CW SCs seeded by erbiumdoped fiber (EDF)’s ASE in telecommunication bands because low-cost, all-fiberized optical components commonly employed for telecommunication systems can be readily used. Through our investigations, it was concluded that such applications as photonic microwave filters [22] and wavelength- division-multiplexed passive optical networks (WDMPONs) [23], where spectrum-sliced incoherent beams are employed, could benefit from using the CW SC due to its ultrawide bandwidth and high spectral-power density.
In this study, the potential of the depolarized, incoherent CW SC in another application area (OCT imaging) is explored. More specifically, the use of an EDF’s ASE-seeded CW SC for the high-performance OCT imaging of a human tooth sample is experimentally demonstrated. The implemented all-fiberized CW SC source exhibits a 3-dB spectral bandwidth of ~110 nm, covering the range from 1565~1675 nm, which corresponds to the telecommunication bands of the L-band (1565~1625 nm) and U-band (1625~1675 nm). It is known that the telecommunication band covering 1.4~1.7 ㎛ can also be attractive for OCT imaging due to both its reduced optical scattering and its increased penetration depth at longer wavelengths [24-28]. One benefit of using telecommunication band light sources is that low-cost, all-fiberized optical components designed for telecommunication systems can be easily used. In this work, it is experimentally demonstrated that imaging of ahuman tooth sample can be readily achieved using aspectral-domain (SD)-OCT system incorporating the CW SC.
2.1 CW Supercontinuum Seeded by Erbium-doped Fiber’s ASE
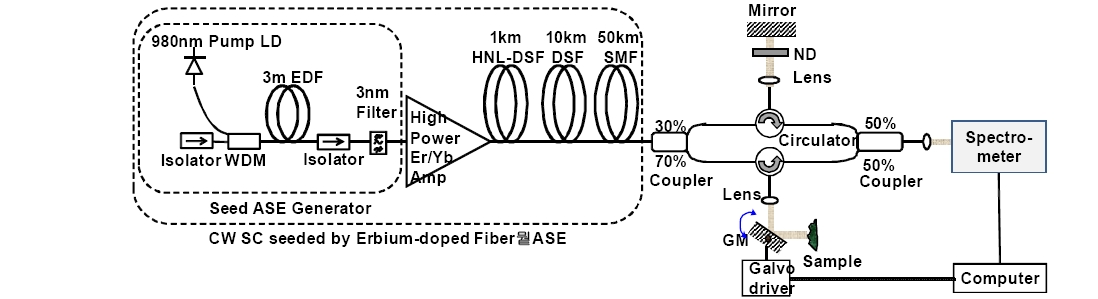
The experimental setup of an SD-OCT system that incorporates the proposed ASE-based CW SC source is shown in Fig. 1. The broadband, incoherent, ASE-based CW SC was composed of a seed ASE generator based on a pumped EDF, a high-power Er/Yb amplifier, a cascade of a 1-km highly nonlinear dispersion-shifted fiber (HNL-DSF), a 10-km conventional DSF, and a 50-km standard SMF. A seed ASE beam generated from a pumped EDF was spectrum-sliced using a 3-nm bandpass filter at 1560 nm. The 3-nm ASE beam with ~-13 dBm power was amplified up to ~32 dBm using the high-power Er/Yb amplifier and was subsequently coupled into the 1-km HNL-DSF. The 10-km DSF was cascaded to the HNL-DSF. The 1-km HNL-DSF, the only available highly nonlinear optical fiber in our laboratory, is not long enough to generate sufficient nonlinear effects. The HNL-DSF and DSF, both of which had a zero dispersion wavelength (λ0) of 1550 nm exhibited nonlinearity parameters () of ~28 and ~2 W-1. km-1, respectively, and their narrowband ASE beam was converted into a depolarized spectral continuum due to the combined effects of MI and SRS [13, 14]. MI leads to soliton-like structure formation that experiences subsequent self-Raman interaction. The Raman soliton formation is induced by the random phase and intensity fluctuations of the pump beam propagating through an anomalous-dispersion optical fiber. The large numbers of noisy solitonic structures randomly distributed in space and time give rise to a broad spectral continuum. The 50-km SMF was used as a broadband attenuator to reduce the SC power output to ~15 dBm as a broadband inline attenuator covering the L- and U-bands was not available in our laboratory. Further details on the CW SC source are provided in Ref. [17].
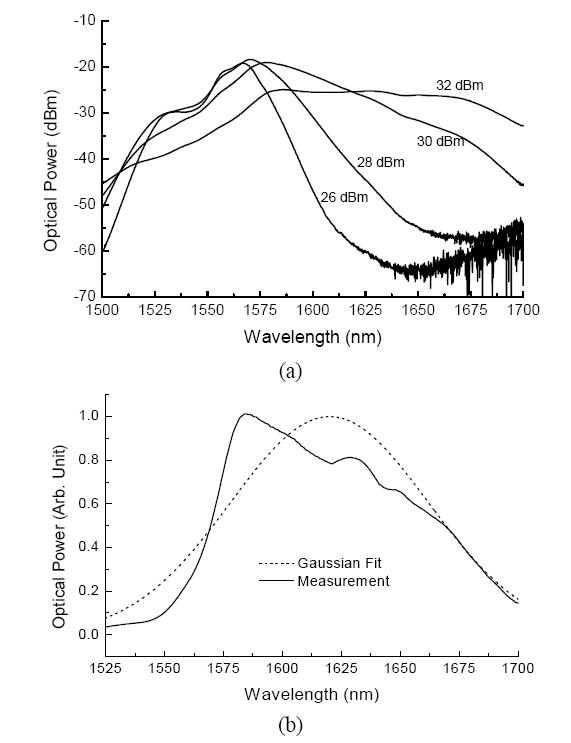
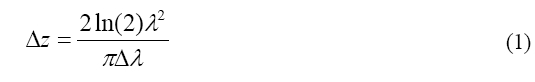
Fig. 2(a) shows the output spectra measured as a function of the amplified 3-nm-bandwidth ASE beam that was coupled into the HNL-DSF. The output spectrum from the 50-km SMF was observed to broaden and flatten as the amplified 3-nm-bandwidth ASE beam power was increased. A linear scaled view of the output SC spectrum at an amplified 3-nm-bandwidth ASE beam power of 32 dBm is shown in Fig. 2(b). As a matter of fact, the sharp spectral edge, which was observed at short wavelengths, is undesirable as it causes side lobes in the axial point spread function (PSF). At present, attempts are being made to improve the SC spectral shape without using external spectralshaping filters as external spectral shaping may result in the decrease of the spectral bandwidth. The full-width halfmaximum of the SC bandwidth was determined to be ~110 nm, centered at ~1595 nm, and the corresponding theoretical axial resolution (△z) of imaging was estimated to be 10.2 ㎛ using the following simple relation [1]:
where λ and λ are the center wavelength and the spectral bandwidth of the broadband source, respectively.
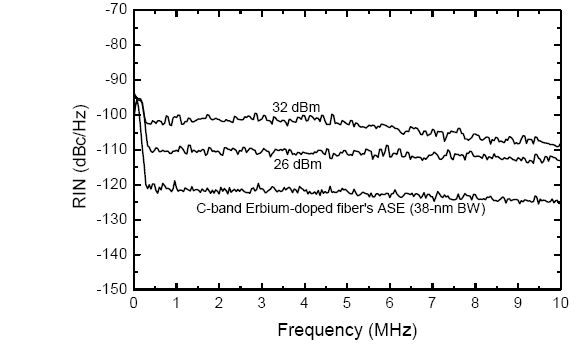
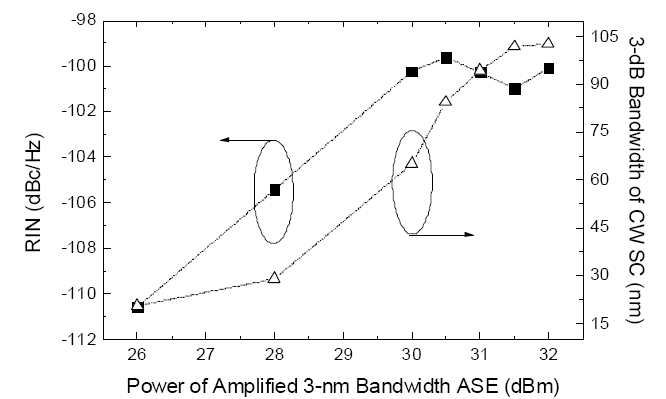
One concern in investigating the applicability of CW SC to OCT imaging is its relative-intensity-noise (RIN) level because RIN can affect the sensitivity and dynamic range [29]. First, RIN measurement of the SC output was performed as a function of the amplified 3-nm-bandwidth ASE beam power by launching the SC output onto a low-noise photodetector with a bandwidth of 10 MHz, which was AC-coupled into an electrical spectrum analyzer. The measured RIN spectra are shown in Fig. 3 together with that of the full C-band EDF’s ASE. As we were interested in RIN within the typical demodulation range of OCT systems, the RIN measurement was carried out within the range of 0.01~10 MHz. The RIN level of the CW SC was found to be much higher than that of EDF’s ASE even if the CW SC was seeded by EDF’s ASE. Specifically, the CW SC RIN level at an amplified 3-nm-bandwidth ASE beam power of 32 dBm was found to be ~20 dB larger than that of the full C-band ASE. Furthermore, contrary to the well-known fact that the RIN of an incoherent broadbandwidth light source is inversely proportional to its spectral bandwidth [30], the RIN of the CW SC was found to increase with the spectral bandwidth, as shown in Fig. 4. Such a high RIN level is believed to be due to stimulated- Raman-process-induced, amplified pump-to-stokes RIN transfer [31]. Note that the CW SC is generated mainly by the combination of the MI and SRS processes. The high RIN level of the CW SC might degrade the OCT imaging performance. The impact of RIN on the imaging quality can be indirectly inferred from the estimation of signal-tonoise ratio (SNR) of the light source. Note that the SNR estimation is commonly used for the evaluation of signal quality in telecommunication systems. The SNR limitation caused by RIN can be expressed as [32]

where
2.2 Experimental OCT Setup Incorporating the CW Supercontinuum
Bearing in mind that the high RIN level of the CW SC may significantly affect the OCT imaging performance, we executed an exemplary demonstration of the use of the developed CW SC. As shown in Fig. 1, the OCT imaging setup was based on a Mach-Zehnder interferometer. A crosssectional image was produced by transversely scanning the beam across a sample using a galvanometer (GM), and by collecting a reflected profile at each point. The reflected intensities were recorded on a grayscale image as a function of the transverse and axial distances. An optical spectrum analyzer (OSA: AQ6317B, produced by ANDO Electronic Co.) was used in place of a spectrometer to obtain most of the OCT experimental data in this experiment, because an InGaAs-type CCD spectrometer for a 1550-nm region was not available in our laboratory [2]. The acquired data from the OSA was transferred to a computer through a shielded general-purpose interface bus cable (GPIB, produced by National Instruments) [33]. The maximum GPIB transfer rate was more than 7.2 Mb/s. The acquired data was processed and visualized using the customized software written with LabView®.
A human tooth sample was carefully prepared for the experimental demonstration. As enamel and dentin possess ~2 and ~18% water concentrations, which are substantially lower than that of the skin, their dominant light loss factor is scattering rather than water absorption. Furthermore, the fact that smaller scattering exists at the 1500~1700 nm bands than at the 800 or 1300 nm band allows for low-noise imaging. Note that scattering decreases at longer wavelengths in proportion to (1/λ), indicating that the magnitude at the 1500~1700 nm wavelengths is over 30 times lower than that at the visible wavelengths [28].
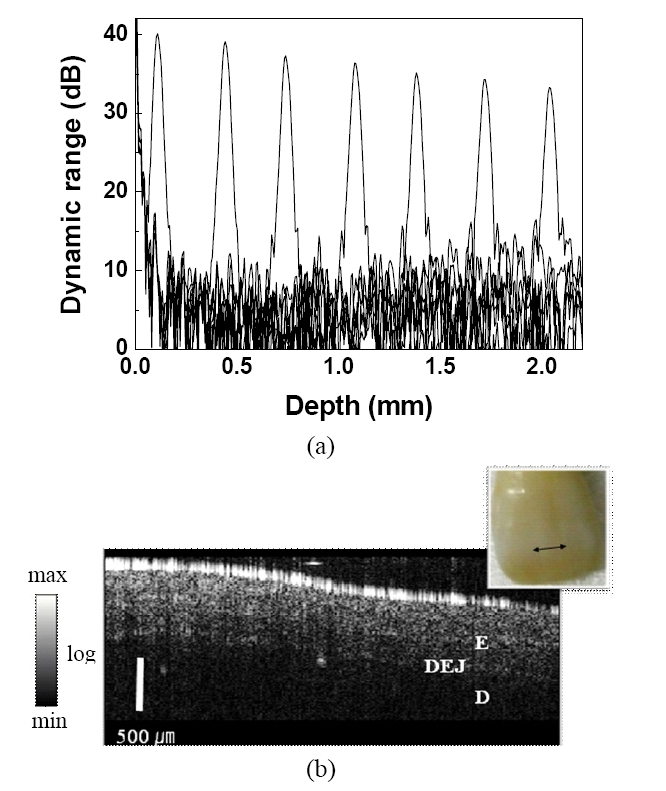
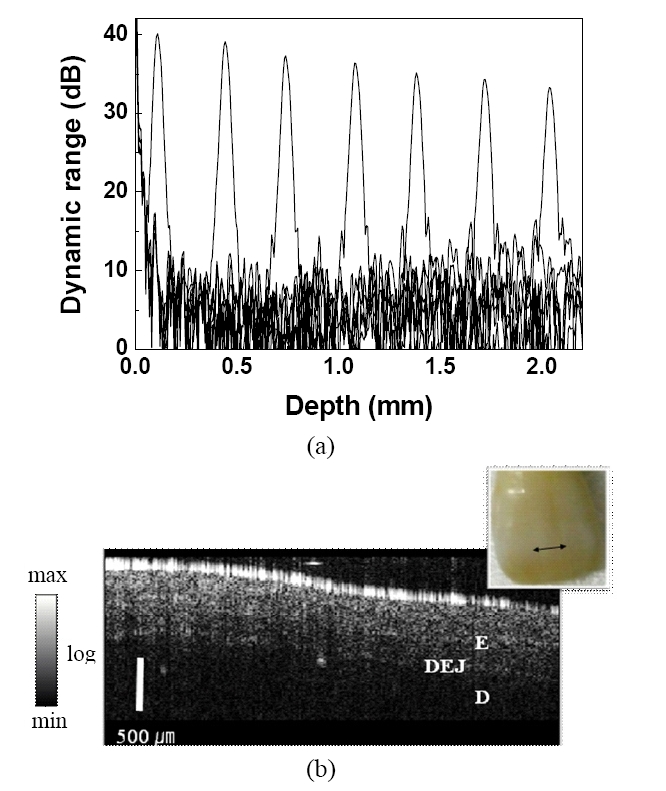
The shorter the coherence length of the source, the more closely the sample and reference arm group delays must be matched for constructive interference to occur. The OCT system performance was characterized by measuring the PSF using a mirror as a sample. At the 1.2-mm imaging axial distance measured in air, the experimentally determined axial resolution was ~12.2 ㎛ whereas the theoretical resolution with the Gaussian spectrum was ~10.2 ㎛ for the output CW SC spectrum at an amplified 3-nm-bandwidth ASE beam power of 32 dBm. The degradation of the axial resolution can be attributed to various factors, such as the non-Gaussian spectral shape of the light source, the use of a Hamming spectral window before discrete Fourier transform (DFT), and the wavelength dependence of the fiber-optic components employed. To analyze the changes in the dynamic range from the SC source, the point spread functions (PSFs) for variable lengths of the reference arm were measured as presented in Fig. 5(a). Since the proposed OCT system using an OSA showed a larger optical-saturation power limit, it was not easy to define the overall sensitivity value of this SD-OCT system. The maximum dynamic range of the logarithm-scaled PSFs at the optical length of 110 ㎛ was found to be ~40 dB, which was determined by detecting the minimum visible intensity of a mirror reflection at the position of the sample with the incident source power of 30 mW.
Fig. 5(b) shows the obtained OCT image of the sample human tooth sample. The image had 256 transverse pixels and 512 axial pixels. Due to the data acquisition mechanism that was used, the quality of the OCT image acquired using an OSA could not be as high as that acquired using a conventional CCD spectrometer, as explained in Ref. [2]. It is expected that a higher-quality OCT image can be obtained with the proposed light source only if an InGaAstype CCD spectrometer for a 1550-nm region is employed in the proposed OCT imaging system. The required time for acquiring the interference signal of an A-line using the OSA over a 130 nm bandwidth in a high-sensitivity-mode resolution bandwidth of 0.05 nm is more than 1.3 s. One of the critical factors contributing to the production of
significant signal distortion in the SD-OCT system is the fringe washout phenomenon, which is caused by a very slow readout process. This means that an OCT system using an OSA cannot produce an image with quality as high as that of the images acquired using a conventional CCD spectrometer. Variability in enamel morphology was still evident, however, with a sharp drop in the coherent backscattered intensity clearly delineating the junction between the enamel and dentin layers, as shown in Fig. 5(b). The inset shows a surface picture of the human tooth sample. The double-headed arrow in the inset indicates the scan range of the light source which traverses the direction for the OCT image.
The possibility of using a depolarized, incoherent CW SC seeded by EDF’s ASE as a broadband source for SD-OCT imaging was investigated. Such a CW SC showed a smooth and flat spectrum as well as long-term stability. It was experimentally shown that the CW SC could be readily applied to the OCT imaging of a human tooth sample. As a matter of fact, several high-quality works on the OCT imaging of human teeth have already been carried out with ~800- and ~1300-nm light sources [34-37]. Even if the image quality obtained with the CW SC in this work is not superior to that obtained in the previous demonstrations using conventional light sources, it can be concluded from our feasibility demonstration that higher-quality OCT images can be achieved through the further optimization and improvement of the OCT setup using a CCD spectrometer, or through the Gaussian spectral shaping of the output CW SC beam.