The joint transform correlator (JTC) has shown remarkable achievements for real time pattern recognition and target tracking applications. Especially for pattern recognition, it can be applied to facial appearance, fingerprints, handwriting, and character recognition [1-7]. The typical advantage of the JTC is that it uses a type of real time optical system which quantitatively analyzes and compares the images by measuring a correlation peak and peak signal to noise ratio (PSNR). This kind of optical pattern recognition system goes through a double random encryption and double-encryption process using the JTC method. However, it also has drawbacks in that it is sensitive to rotation or shifting of images. Moreover, it has some problems with nonlinearity of the optical components such as a digital camera, and with weak correlation discrimination caused by noise. Recently many methods for solving such problems in the JTC have been studied [8-9]. Among them, the nonlinear joint transform correlator (NJTC), which can solve the problem of the nonlinear components in the JTC system, may be the most typical [9-10]. In addition, an essential technique in pattern recognition and identification is that of finding an accurate recognition method when the input images are rotated in angle and translated in position [11-12]. In spite of such efforts, weak correlation discrimination and noise problems still remain.
Such kinds of weak correlation discrimination and noise problems originate from the interference fringes constructed with a Fourier transformed reference and a sample image in the Fourier transform plane. Some attempts to improve the discrimination ratio as well as the optical efficiency have been made in the spatial domain or in the frequency domain. However, most attempts are divided into two groups, one group uses an intensity or a phase threshold and the other group uses some kinds of filtering. Karim successfully applied the synthetic discrimination function (SDF) filter concept to a JTC system and use a Fourier plane image subtraction technique [13-15]. Although this technique successfully improved the correlation peak and reduced the side-lobe noise, it adopts a simple image normalization and filtering process or spatial domain iterative filtering process. Thus it has problems finding suitable parameter values to adjust the fringe with a minimum error function. In order to solve these problems, this paper proposes a new technique of modifications of the interference fringes by adopting a frequency domain iterative filtering technique which can find the optimum condition with minimum error for a highly improved discrimination ratio and reduced sidelobe noise. This paper deals with a fringe-adjusted method by inserting an iterative filtering step in the Fourier transform plane where the interference fringes are constructed with Fourier transformed reference and sample images. Experimental results are presented to show that the proposed techniquecan successfully improve the correlation peaks and thelevel of discrimination.
In the follow sections, the proposed new method of fringe-adjusted JTC system and its algorithm, including the iterativefiltering technique, are described in detail. Section III describessimulation results for a pattern recognition enhancementand, finally, some comments are contained in theconclusion.
II. NEW FRINGE-ADJUSTED JTC SYSTEM
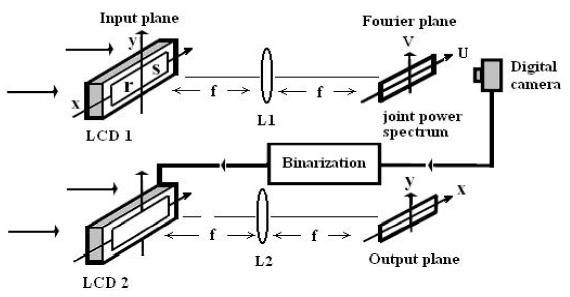
Figure 1 shows the optical structure of the basic NJTC system which compensates for the nonlinear optical components such as a CCD camera. JTC uses a two-stage process. In both stages the image of a coherently illuminated input passes through a lens to take its Fourier transform. In the first stage of JTC the basic operation is to get the information of the Fourier transformed object from the Fourier transform lens L1 onto the Fourier plane. Let us call the reference image
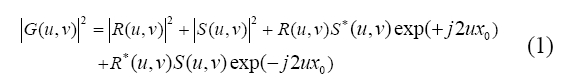
Here, * is the phase conjugate, u and v are independent spatial frequency variables adjusted in their size by 2π f λ and λ is the wavelength of input light and f is the focal length of the Fourier transform lens L1. The JPS contains noise and DC components which degrade the correlated signal obtained on the output plane in the second stage. To obtain a good correlated signal, DC components are blocked. Equation (2) indicates the JPS excluding the DC terms.

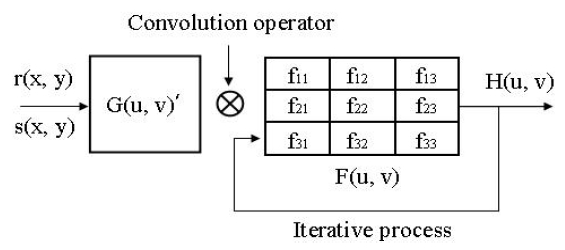
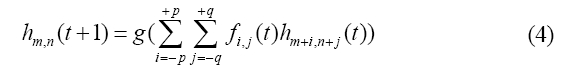
This paper proposes a new technique of modifications of the interference fringes by adopting frequency domain special iterative filtering. We introduced a fringe-adjusted method by inserting the Fourier plane as a filtering step in the frequency domain, where the JPS of the interference fringe appears. The proposed iterative filter has frequency domain variables and it convolves with the JPS excluding the DC terms, namely
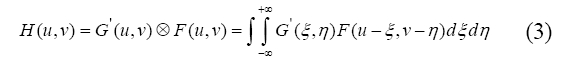
Here, ? denotes convolution. The output
Here,

Here,
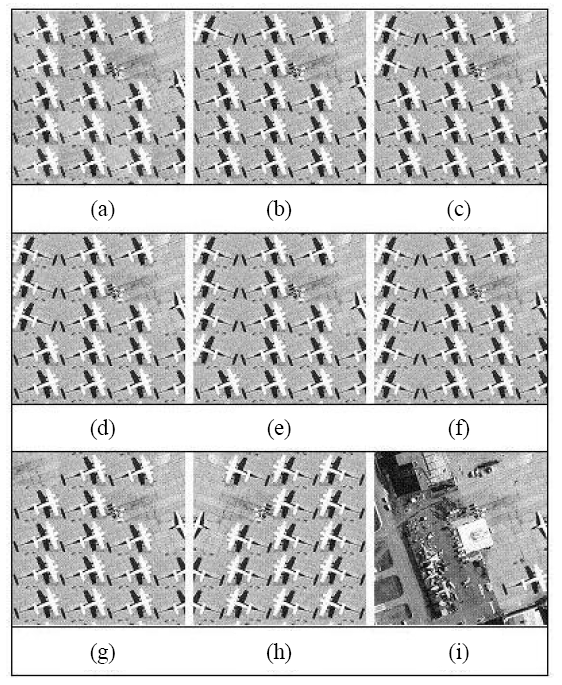
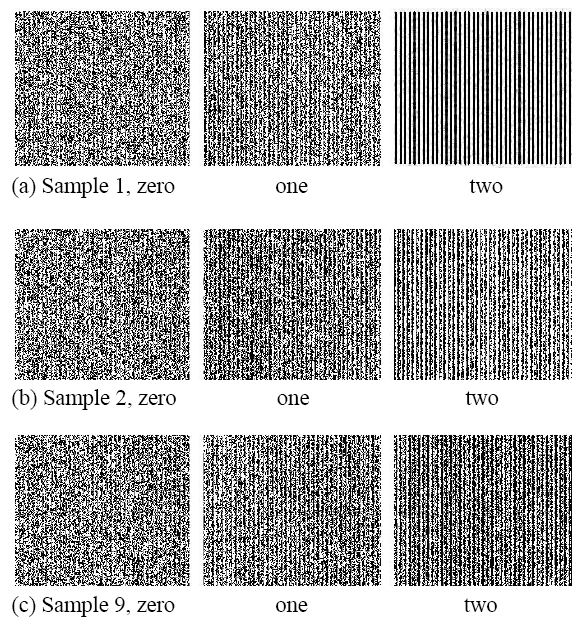
To evaluate the performance of the proposed special filter modifying the interference fringe pattern, we arranged 9 sample images. For this purpose, we prepared various types of 256 × 256 gray images of an airfield which show many aircraft formed in the order shown in Figure 3. In addition, we investigated how possible exact comparison is when the reference image and the sample image are made slightly different by subtracting or changing a small part of the image step by step. In this paper, we introduced two widely used parameters; the correlation peaks and PSNR. Correlation peaks are the peak magnitudes of the correlated signals. If we let the correlation peaks be |p(x,y)|, then the PSNR can be defined as Equation (6).
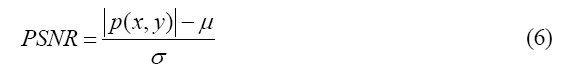
Where μ represents the mean value, and σ represents the standard deviation. Figure 3 shows 9 airfield images, and these images can be divided into 4 groups for convenience. In Group A, we arrange Sample 1 shown on Figure 3(a) which is the reference image. In Group B, we arranged samples from Sample 2 to Sample 6 shown on figures from 3(b) to 3(f) which differ from the reference image by changing the directions of the aircraft one by one. In Group C, we prepared Sample 7 shown on Figure 3(g) which differs from the reference image by subtracting one upper left side aircraft from Figure 3(a). In Group D, we prepared Sample 8 and Sample 9 shown on Figure 3(h) and Figure 3(i) which differ from Figure 3(a). Sample 8 is the mirror image of the reference image, and Sample 9 is totally different from the reference image.
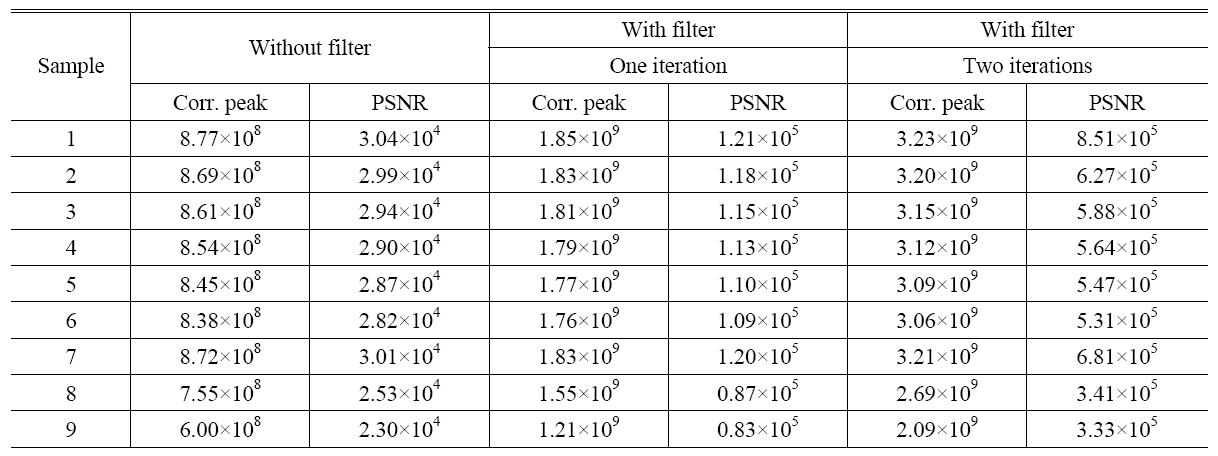
Table 1 shows the correlation peak and PSNR of various airfield images obtained using the conventional NJTC without a filter, and with a filter specially designed to enhance the interference fringe pattern shown on the Fourier plane. We presented the results of filtering with an iterative process on the right side of Table 1. Table 1 indicates that all of the correlation peaks and PSNR increased when the special iterative filter was used, and that the more iteration times the better its performance of recognition was. Let us pay attention to the obtained values of the correlation peaks and PSNR, and we can find that PSNR shows more rapidly increased values than the correlation peaks each time the filter iteration proceeds. Thus, we can say finally that the noise contained in the interference fringe pattern is considerably reduced through the filter iteration process.

Correlation peak and PSNR for both cases of the JTC adopting an iterative filter process and not adopting it
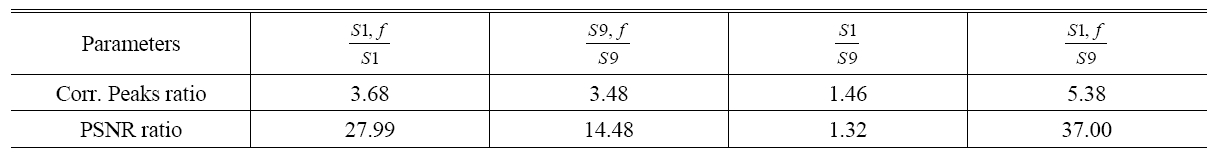
Table 2 shows the performance parameters of the correlation peaks and PSNR for the cases of adopting the iterative filter processing and for not adopting it. First, concerning the PSNR, the iterative filter process yields enhanced results that are a maximum of 27.99 times better than those for the case without the iterative filter processing. Second, concerning the correlation peaks, the iterative filter process yields enhanced results that are a maximum of 14.48 times better than those for the case without the iterative filter processing. In addition, Table 2 shows obvious enhancement of the discrimination results when the JTC adopts the iterative filter processing. Here, the discrimination, namely comparison ability between match and non-match, is defined as the ratio of the correlation peaks and PSNR of Sample 1 to those of Sample 9. Let us pay attention to the obtained ratio of the correlation peaks and PSNR, namely S1S9 and S1,f S9 . Here, S1S9 and S1,f S9 means the ratio without and with the iterative filter processing, respectively. First, concerning ratio of correlation peaks, the iterative filter process yields an enhanced ratio that is 5.38, better than the value of 1.46 for the case without the iterative filter processing. Second, concerning the PSNR, the iterative filter process yields an enhanced ratio that is 37.00, better than the value of 1.32 for the case without the iterative filter processing. These results reveal an important fact that the comparison ability between match and non-match was enhanced considerably when we adopted the iterative filter processing. Moreover, improvement in the ratio of PSNR is superior to that of the correlation peaks, thus we can conclude that this is caused by the considerable reduction of side-lobe noises.

Enhancement parameters for both cases of the JTC adopting an iterative filter process and not adopting it
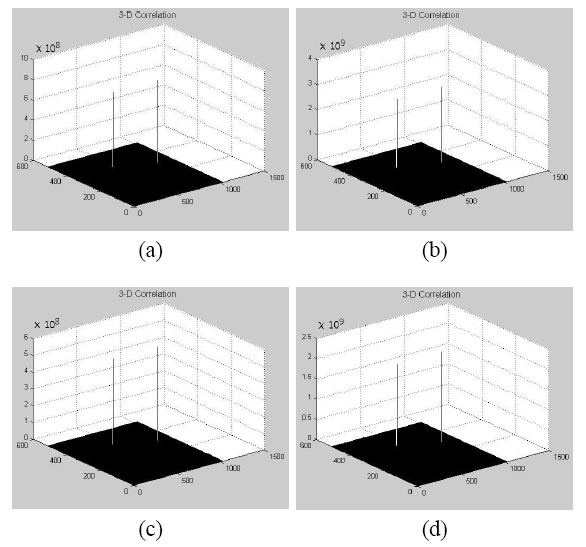
Figure 4 shows the interference fringe pattern of three samples, that is, Samples 1, 2, and 9 comparing the changes in shape without the filtering and with the filtering process. Figure 4 proves the conclusions mentioned above, that is, the proposed special iterative filter successfully achieved good enhancement of interference fringe shape reducing the noise but increasing the contrast. In addition, Figure 4 backs up the results shown in Table 1, that when we gradually change the reference image by shifting the direction of the aircraft one by one, the correlation peaks and PSNR decrease. One interesting point is that Sample 7 has higher value of the correlation peaks and PSNR than Sample 2, thus we can conclude that Sample 7 resembles the reference image more than Sample 2 does. Moreover, we can conclude that the ratio of the correlation peaks or PSNR of Sample 1 to Sample 9, totally different from the reference, becomes higher as the filter iteration proceeds. Thus, the discrimination ability between match and non-match images increases by adopting our new filtering process. Figure 5 shows the three dimensional pictures of the correlation peaks of Samples 1, 2, and 9 comparing the changes in values without the filtering and with the filtering process.
In this paper, we presented a new technique of modifications of the interference fringes by adopting special iterative filters. We introduced a fringe-adjusted method by inserting a filtering step in the frequency domain, namely the Fourier plane, where the JPS of the interference fringe appeared. The proposed iterative filter has frequency domain variables and it convolves with the JPS excluding the DC terms. Experimental results were presented to show that the proposed technique can successfully increase the correlation peaks and PSNR and thus improve the level of discrimination between match and non-match images, especially between images that closely resemble each other.