

This paper describes a development of a fiber optic common-path optical coherence tomography (OCT) based imaging and guided system that possess ability to reliably identify optically transparent targets that are on the micron scale; ability to maintain a precise and safe position from the target; ability to provide spectroscopic imaging; ability to imaging biological target in 3-D. The system is based on a high resolution fiber optic Common-Path OCT (CP-OCT) that can be integrated into various mini-probes and tools. The system is capable of obtaining >70K A-scan per second with a resolution better than 3 μm. We have demonstrated that the system is capable of one-dimensional real-time depth tracking, tool motion limiting and motion compensation, oxygen-saturation level imaging, and high resolution 3-D images for various biomedical applications.
In order to perform microsurgery or diagnostic procedures on a delicate tissue, a high quality visualization tool such as a binocular surgical microscope is an essential item [1]. The ability to view critical parts of a tissue and to work in micron proximity to the fragile tissue surface requires excellent visibility, precision micro-instruments and a highly skilled surgeon. At present the surgeon must function within the limits of human sensory and motor capability in order to visualize targets, steadily guide microsurgical tools and to execute all surgical objectives [2]. These directed surgical maneuvers must occur simultaneous with the minimization of surgical risk and the expeditious resolution of complications. Most microsurgeries and procedures are currently performed with freehand techniques and manually operated precision micro-instruments. Progress from the present state of the art is in part restricted by fundamental human physical limitations. This effort is therefore directed at providing micro-surgeons with practical and usable enabling tools that will enhance their freehand ability to achieve surgical objectives, diminish surgical risk and improve outcomes. As a new method of microsurgical guidance, optical coherence tomography (OCT) has been implemented and studied [3]. Compared to other image-guiding modalities such as MRI, CT and ultrasound, OCT is more compact and portable allowing for integration with hand held surgical tools.
Recently attempts at developing OCT guided neuro-surgical tools have been made using small rodent models [4]. Current OCT systems generally exhibit limited imaging depths, on the order of 1~3 mm. Although the retina is only approximately 0.25 mm thick the limited depth of penetration still restricts its clinical applications when the tissue surface’s topological variance is larger than the imaging depth range [5]. Moreover, involuntary motion affecting the target tissue (e.g. secondary to respiratory efforts, cardiac activity or pulsation in vessels) compounds the imaging difficulty with OCT imaging artifacts [6]. These considerations are especially critical in delicate surface operations such as occur in cerebral cortex during neurosurgery [7] and the retina during retinal microsurgery [8]. In such operations, the tissue’s axial involuntary motion is a primary concern and a very high level of dexterity and skill is required to offset motion on the order of hundreds of microns that may negatively impact results or even prevent procedure completion. A logical and efficient means by which to overcome the difficulties presented is through application of adaptive ranging. With adaptive ranging the target tissue surface is detected and located by the imaging system itself. This information is then fed back in order to adjust the coherence gate and range on the reference arm [9, 10]. The topological variance and motion is thereby compensated for and the resulting image is now obtained on a virtually “plain and static” surface.
Since first application to clinical retina in the field of ophthalmology, OCT scanning has emerged as one of the most utilized diagnostic applications in the field [11]. In the last decade numerous technological breakthroughs have been made and OCT now offers unparalleled resolution in real time where such progresses have been performed both in system level and component level [11-31]. These progresses include but are not limited to: fabrication of new broader light sources for achieving finer resolution (wavelength swept source, ultra high speed pulsed laser); building of faster spectrometers; development for compact two-dimensional lateral scanning tools; design for miniaturized probe; manipulation of various noises on the obtained images; optical control based on OCT system; adaptive morphological imaging (polarization sensitive OCT, Doppler OCT); functional imaging (blood flow, oxymetry, cell functions); fields of applications (clinical and non-clinical fields); and image processing for obtained images. One relatively unexplored yet promising application of OCT is in the area of endoscopic 3-D imaging and optical sensing. Endoscopic optical coherence tomography (EOCT) is however associated with technical challenges that force a compromise decision between reducing imaging sensitivity and significantly increasing the level of technical complexity and costs of the required system [32]. Ultrahigh resolution EOCT is even more difficult to implement because of the issues of polarization and dispersion mismatch (over a wide range of wavelengths) between the two arms of the Michelson interferometer [33]. However, each of these difficulties has been largely addressed via a strategic choice of components and ingenious system design.
Despite great progress in the development of Michelson interferometer based technologies there remains significant interest in further development of common-path interferometer based OCT technology. The common-path approach utilizes a simple interferometer design where the sample and reference arms share a common path. This allows a much simpler system design, lower associated costs and the ability to use interchangeable probes as well as the freedom to use any arbitrary probe arm length. A common-path interferometer based frequency-domain OCT (FDOCT) has been reported [34, 35] and other common-path interferometer based approaches for time-domain OCT, using a free space interferometer, have also been demonstrated with limited success [36, 37]. In the last several years, there has been rapid development in the fiber optic based technologies that is applicable to both frequency-domain and time-domain common-path OCT systems [38-44]. So far, analyses of the system performance (complete noise model considering optical beat noise / limited spectrometer parameters) have been reported and various new kinds of miniaturized probe (conical lens integrated probe / side viewing probe / gold-coated probe) and sources (multiple sources / swept sources) have been applied to the common path OCT for either time-domain or Fourier-domain system for imaging and sensing applications (cancer or benign tumor sensing). Especially, as mentioned, due to the numerous distinctive features described above, a common-path OCT system has a great potential for many applications not only in terms of efficient functional (blood flow / neuron activation / oxymetry) and morphological (structural) biological sample imagings but also in surgical applications such as micro-retinal and neurological surgeries. For surgical applications, the fiber optic probe could be integrated with a motorized driver in the form of a compact hand-held device that could be used to assist surgical procedures. Nevertheless, one of the main disadvantage of using common path system is the dependence of the fixed reference reflectivity where it is typically from the Fresnel (partial) reflection at the probe interface. Thus, for in situ or in vivo imaging, it would require dielectric or metal thin-film to obtain appropriate reference amplitude that is independent to the interfacial media [45].
The fiber optic common-path OCT is compatible with existing endoscopic medical instrumentation. The system described in this paper incorporate optical sensing and imaging tools that can perform real-time depth tracking, tool motion and motion compensation, oxygen saturation level detection and high resolution 3-D imaging. Due to the simplicity and robustness of the CPOCT, various simple fiber optic probes can be easily integrated into delicate micro-surgical tools and probes. In this work, the feasibility of the common-path OCT not only as a structural (morphological) imager but also as a spectroscopic tool, motion tracking, and scan-free imager has been investi-gated and presented.
II. COMMON-PATH OPTICAL COHERENCE TOMOGRAPHY
The system is based on CP interferometer based surface topology and motion compensation (CPOCT-STMC) [46, 47], and imaging and sensing [43] in the axial direction will be used to control the axial motion of the surgical tools and proves in order to provide surgical accuracy beyond current human physical ability. Each set of A-scan data obtained from the probe is transferred into the CPOCT-STMC system and analyzed to locate the surface. In addition, spectroscopic information and tissue images canbe obtained simultaneously. In order to simplify the probedesign and to reduce cost, we will investigate and developmulti-fiber based fiber optic probes that eliminate the needfor the physical scanning at the distal end of the fiberprobe.
CPOCT is a rational and reasonable approach for topology and motion compensation because the reference and sample signals share the same path [15], thus the reference offset can be changed directly by adjusting the distance between the probe and the tissue surface. No additional synchronization control is needed in the reference arm as in prior work [9, 10]. In addition, the CPOCT approach requires no alignment and has higher imaging stability [34]; it is relatively insensitive to vibration as well as fiber induced polarization and dispersion mismatch [47]. These properties logically predict ideal features when implementing an allfiber probe for integration with microsurgical tools. A tiny fiber optic CPOCT probe or fiber array can be integrated into different microsurgical instruments with relative technical ease and be used to adjust their axial motion in real time to compensate the subject tissue’s topological variance and motion. The probe can be connected to a main CPOCTSTMC frame via standard fiber optic connectors for easy replacement of the tools.
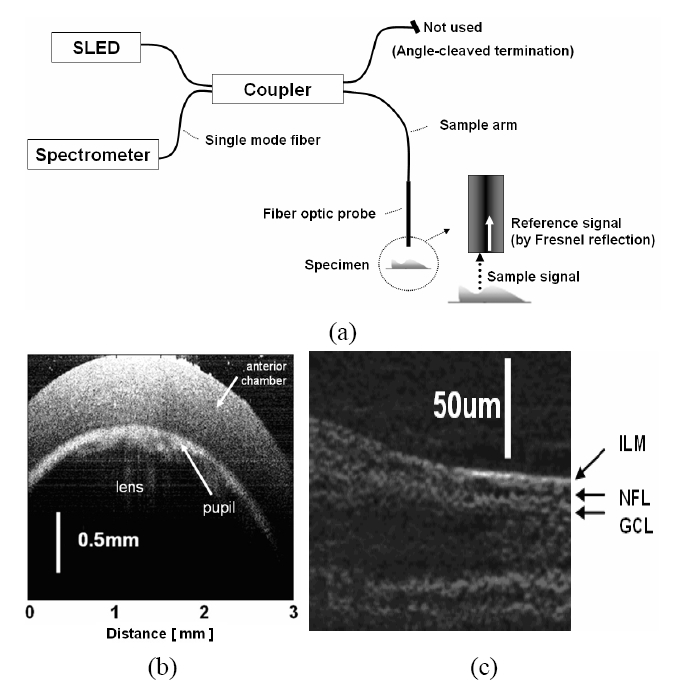
In order to ensure that the system has the required axial resolution to accomplish the task, we have built a CPOCT system capable of axial resolution of ~2 μm range by multiplexing 3 SLEDs and a broadband spectrometer to a bandwidth in excess of 150 nm. The proposed system is based on the center wavelength around 790 nm. We have picked 790 nm as a center wavelength for several reasons: (1) this wavelength gives reasonable penetration depth; (2) the availability of SLEDs near that spectrum will allow us to combine several SLEDs to achieve ultra-wide bandwidth; and (3) 790 nm is very close to the crossover wavelength for oxygenated hemoglobin absorption and while not the focus of this effort an additional rational for a center wavelength near 790 nm is that it will allow us to perform standard oximetry as an added capability. Obtaining OCT images starts with the interrogation of a target using a broadband source which couples to one of the arms of a fiber coupler and exits out to the probe arm, which acts as both the sample and the reference arm. The reference signal is directly obtained from a partial reflector near the distal end of the probe by the Fresnel reflection which depends on the interface media at the distal end of the sample arm. The unused remaining fiber arm has been terminated in an angle-cleaved end to avoid back-reflection from that port. The reference and the sample signal couple back to the fiber and exit out of the 3rd arm of the fiber coupler to the optical spectrometer and the resultant spectrum is analyzed to obtain a longitudinal image (See Fig. 1(a)). The transverse or B-mode scanning was achieved by laterally translating the probe using a computer controlled transducer [48] Commercial superluminescent diodes (SLED) from Exalos were used as broadband sources. The spectro-meters are either based on a 2048 pixel line scan CMOS or CCD cameras that are capable of up to 70,000 or 24,000 line scan per second, respectively. High resolution OCT images taken by a CPOCT system is shown in Fig. 1(b) and (c) are images of a rat cornea and a porcine retina, respectively. We were able to observe a relatively large pupil area (the light is transmitted through the lens area) as well as the anterior chamber below the cornea in Fig. 1(b). A high resolution image of a porcine retina is shown in Fig. 1(c) where retinal structure around the nerve fiber layer (NFL) is shown. In order to obtain these images we multiplexed up to three SLEDs to obtain higher axial resolution. By adjusting the ratio of output power of each source, we are able to optimize the overall spectral shape of the source. The Full Width Half Maximum (FWHM) of the combined source was 106 nm and central wavelength of 800nm. The broad bandwidth of the combined source results in a very narrow PSF. The theoretical PSF has 2.7 ㎛ FWHM but we have obtained the experimental PSF of 3.0 ㎛ FWHM.
III. SO2 SENSING AND SPECTROSCOPIC IMAGING
The measurement of hemoglobin (Hb) oxygen saturation level (SO2) is important for clinical diagnosis. Pulse oximeter [49] is widely used; however, pulse oximeter cannot measure one critical parameter, which is the photons’ mean path length. As a result, pulse oximeter requires empirical calibration and has an inadequate spatial resolution. As an alternative, spectroscopic OCT, one of the functional OCTs that extracts sample’s spectroscopic information, shows potential in the measurement of oxygen saturation level, because spectroscopic OCT can measure this localized spectra that lead to an improved spatial resolution. As well known, in spectroscopic analysis, an increased spatial resolution is always achieved by sacrificing spectral resolution. However, a decreased spectral resolution is not an issue in this study, since using absorption spectrum to extract SO2 does not need fine details in the spectrum.
In D. J Faber et al. study, they measured different absorption properties of Hb and oxy-hemoglobin (HbO2) in non-scattering [50] and scattering blood samples [51]. A spectroscopic time-domain OCT with dynamic focusing system was used. Because of the dynamic focusing system, the imaging speed was slow, which limited the clinical application of this technique. Without dynamic focusing, C. Lu et al. adopted another approach using spectroscopic OCT to measure SO2 [52]. In their study, the OCT signal’s attenuation coefficients in long and short wavelength range were calculated and this ratio was correlated with oxygen saturation level. However, their result didn’t exhibit high spatial resolution spectroscopic information. In this work, we assessed blood SO2 using a spectroscopic Common Path Fourier Domain OCT (CP FD OCT). In processing the spectroscopic OCT signal, we used a novel normalization technique to eliminate the influence of OCT system induced spectral distortion. Without dynamic focusing, we obtained the absorption spectra of blood samples that have 100% and 0% SO2 level.
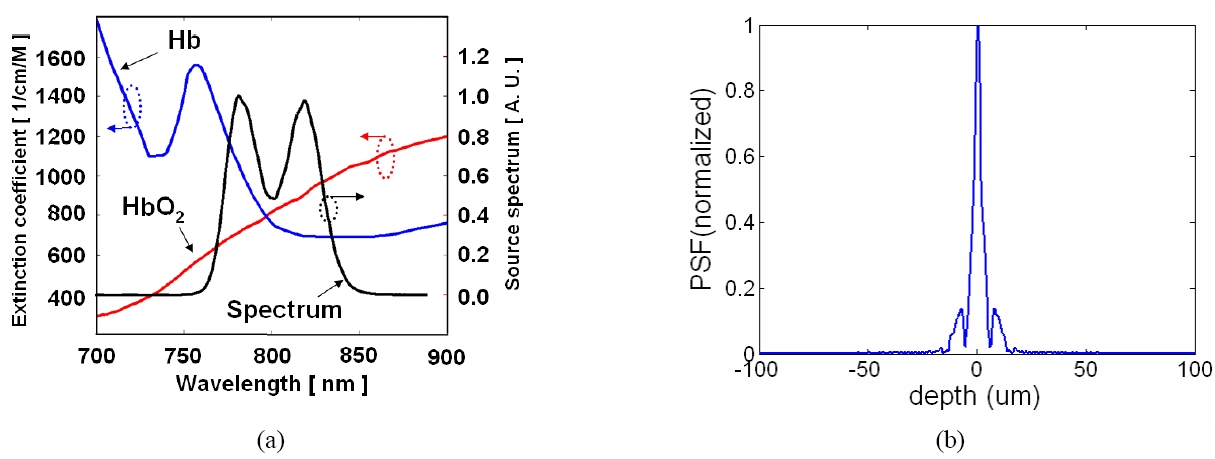
The CPOCT mentioned in Section II were used in this study. However, instead of multiplexing three sources to achieve broad bandwidth as in the previous section, we combined two sources to cover the HbO2 and Hb's absorption features around 800nm. We used 3 dB 2×2 fiber optic couplers in cascade to multiplex the source. We plotted the source spectrum along with the absorption spectra of Hb and HbO2 in Fig. 2(a) [53] and the corresponding PSF determined by this source is shown in Fig 2(b). It is clear that our source spectrum overlaps the absorption features of Hb and HbO2 around 800 nm. Furthermore, we laterally scanned the blood sample to form a B-mode OCT image. The results of this experiment show that we are able to differentiate oxygenation status with high axial and lateral resolution, which has not been reported before.
To verify that our system can differentiate blood oxygenation status, we prepared blood samples that are 100% and 0% oxygenated. Defibrinated sheep blood (Hemostat Laboratories) was used in the experiment. To achieve 100% SO2, we simply placed the blood sample in the air. According to the blood dissolution curve, the partial pressure of oxygen in the air is high enough to fully saturate the blood with oxygen. In order to repel oxygen from hemoglobin and achieve 0% SO2 level, we added 10mg sodium hydrosulfide into 5ml blood. Based on the experimental data [54], this amount of sodium hydrosulfide can maintain the blood at 0% SO2 within 30 minutes.
The raw interferometric spectral data was analyzed to differentiate the SO2 status. We first used the standard FD OCT signal processing procedure to obtain A-scan signal. The algorithm involves interpolation to convert the data from wavelength space to wavevector space, as well as Fast Fourier transformation (FFT). Afterwards, we analyzed the A-scans with Morlet wavelet transformation. Morlet wavelet transformation is a time-frequency analysis that has been widely used in spectroscopic OCT [55]. In Morlet wavelet transformation, a Gaussian window as expressed in Equation (1) is applied to the OCT A-scan to filter out the signal of interest.
The width of the Gaussian window determines the spatial and spectral resolutions of this analysis. A larger window size allows a better spectral resolution however a poorer spatial resolution. Varying the center of the Gaussian window ∫0 enables use to select spectra from different depth in an A-scan. Finally, we apply an inverse Fourier Transform on the windowed A-scan signal to get the spectrum S(λ) of the OCT signal with a delay ∫0 from the reference. S(λ) deviates from the source spectrum because the sample’s absorption properties modulate the source spectrum, therefore S(λ) reveals the spectroscopic properties of the sample.
To measure absorption spectra of blood samples using our CP FD OCT, we used a probe arm consisting of a 10X microscopic objective lens, a glass cuvette with 1 mm thick rectangular lumen, and a mirror. The cuvette and the mirror are glued together with optical epoxy and an air gap is formed between the lower boundary of the cuvette and the mirror. Optical fields reflected by the lower glass-air boundary and by the mirror are both absorbed by the material inside of the cuvette and get coupled back to the CP FD OCT system. Therefore, the interferogram carries spectroscopic information of the absorber inside of the cuvette. We took three sets of spectral data while keeping the probe arm setup fixed and filling the cuvette with water, 100% SO2 blood and 0% SO2 blood. To decrease the absorption of blood and maintain a good signal to noise ratio, we dilute the blood with water.
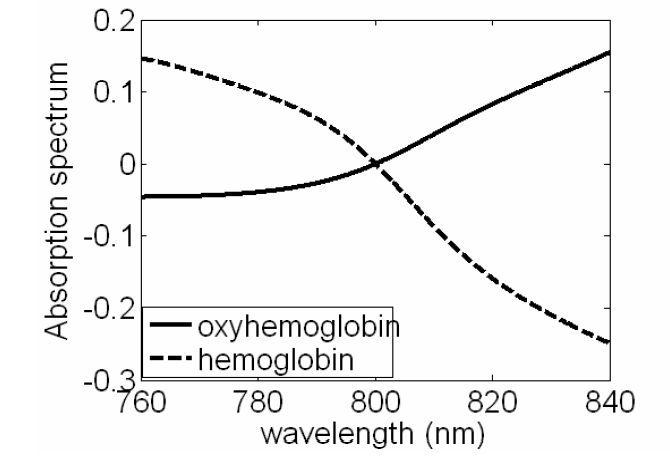
With water, 100% SO2 blood and 0% SOO2 blood in the cuvette, we obtain three sets of A-scans. Every A-scan has a peak corresponding to the interference of light reflected from lower glass-air boundary and the mirror. We processed each A-scan with Morlet wavelet transformation using a Gaussian window with 10 ㎛ FWHM to filter out the interference signal. Inverse Fourier Transformation was performed on all the windowed OCT signals, which leads to SHbO2(λ), SHb(λ) and Swater(λ). SHbO2(λ), SHb(λ) and Swater(λ) denote spectra absorbed by 100% oxygenated blood, 0% oxygenated blood and water. Normalizing SHbO2(λ) and, SHb(λ) with Swater(λ) removes the spectral modulation induced by confocal properties and other spectral distortion from the OCT system. The normalization leads to HbO2 and Hb absorption spectra shown Fig. 3. From Fig. 3, we can clearly see the cross-over behavior of the absorption spectra of Hb and HbO2, as well as the isosbestic point around 800 nm, at which Hb and HbO2 absorb light equally. Although due to the normalization, we are not able to get the quantitative values of absorption coefficients, the measured absorption spectra correlates well with the SO2 level.
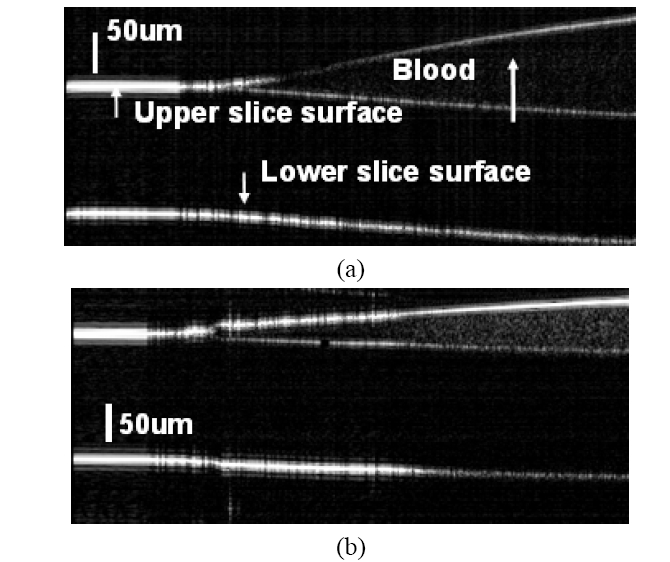
To further demonstrate that our system can sense SO2 with high spatial resolution, we scanned the blood sample laterally with a high precision step motor at a 5μm step size. A more clinical relevant probe arm is utilized. The probe is a single mode fiber cleaved in right angle and we put in close proximity to the sample site of interest. However, no focusing optic was used in conjunction with the bare fiber probe. The Fresnel reflection at the fiber end serves as the reference light. We placed a small drop of blood (SO2=0 or 100%) on the surface of a glass cover slide. By tilting the cover slide, we formed a thin blood film on the surface of the slide. Scanning the probe across the surface of the slice, we obtained images shown in Fig. 4. In Fig. 4(a) (SO2 = 100%) and Fig. 4(b) (SO2 = 0%), the ramp shaped blood films, as well as the upper and lower surfaces of glass slide are visible. We display the vertical scale bars in the images and the lateral dimension for both of the images is 2 mm.
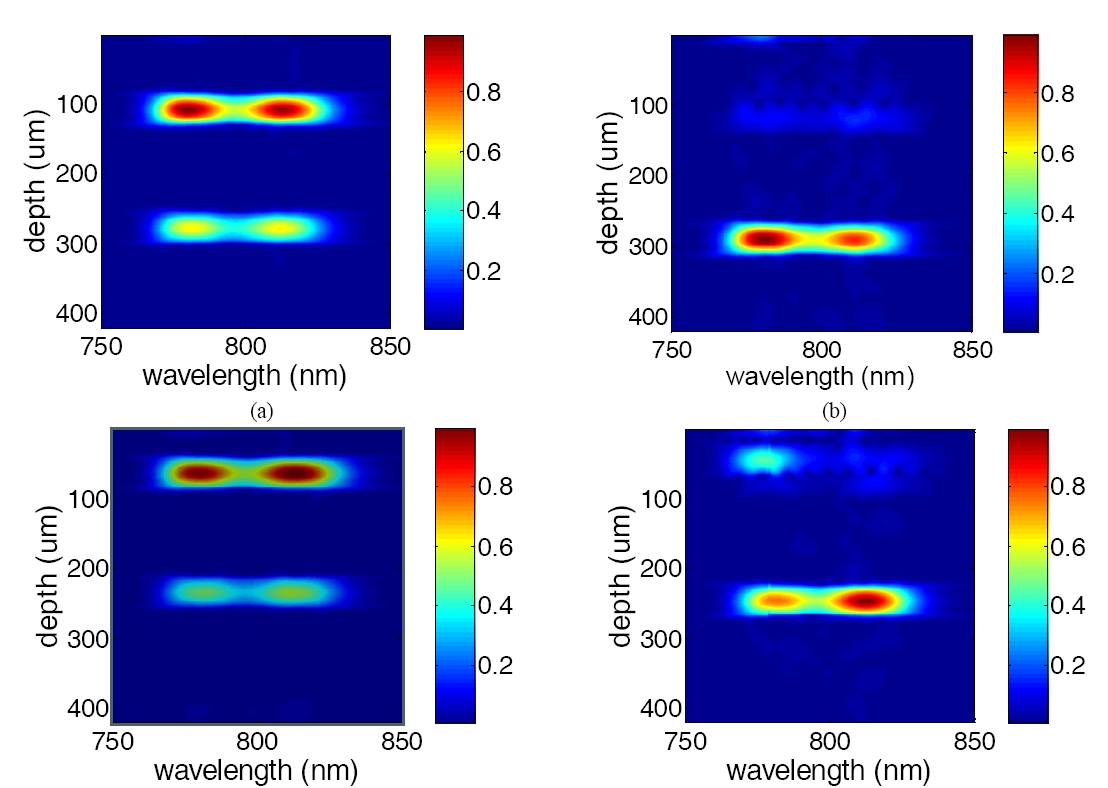
The A-scans in Fig. 4 are processed using a Morlet wavelet transformation with a 50㎛ FWHM moving Gaussian window to extract the spectroscopic information from OCT signal at every data point. Calculating the spectrum for every data point in the A-scan leads to a 2-D spectrogram for each A-scan. In the spectrograms, the vertical axis indicates depth and the horizontal axis indicates wavelength. Every row in the spectrogram is the spectrum extracted from OCT signal in a certain depth. Fig. 5(a) and (b) are examples of spectrograms of the A-scans in Fig 4(a). Fig. 5(a) shows the spectrogram of the A-scan which is 0.1 mm away from the left edge of the image and has no blood absorption in the optical path. Without blood absorption, Fig 4(a) shows clear upper and lower surfaces of the glass slide and the shape of spectra well follows the source spectrum shown in Fig 2. Fig. 5(b) shows the spectrogram of the A-scan which is 0.9mm away from the left edge of the image and has 100% SO2 blood absorbing the light. Due to the existence of blood drop, the reflection at upper surface of the glass slide is much smaller than the reflection at the lower surface. Because of the smaller absorption coefficient of HbO2 in short wavelength range (<800nm), Fig. 5(b) has higher intensity in the short wavelength range. In the same manner, we process A-scans in Fig. 4(b) with Morlet wavelet transformation and show the spectrogram in Fig. 4(c) and (d), which are spectrograms of A-scans without and with de-oxygenated blood absorption (SO2=0%) in the optical path. Fig. 5(c) is similar to Fig. 5(a), while Fig. 5(d) has higher intensity in the long wavelength range, because Hb’s absorption coefficient decreases as wavelength.
In summary, we have obtained the absorption spectra of blood with 100% and 0% SO2 at a depth resolution of 10 ㎛. We showed that using the spectroscopic CP FD OCT with a single mode fiber probe we can differentiate blood SO2 level in both lateral and axial directions.
IV. SURFACE TOPOLOGY AND MOTION COMPENSATION
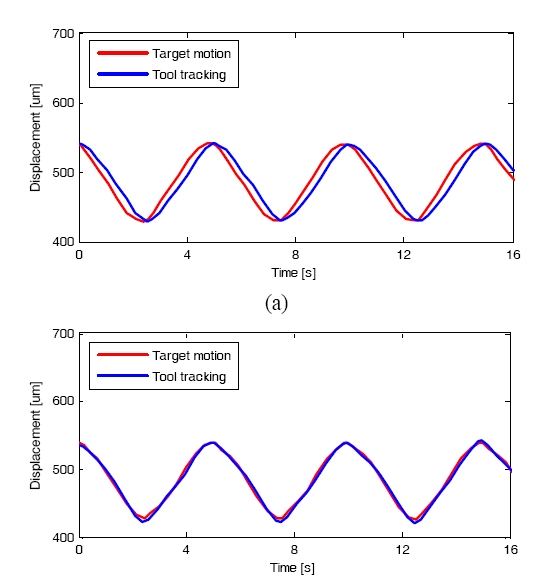
In our recent work we have implemented a fast and robust signal processing and control algorithm for the CPOCT-STMC system using 1-D erosion algorithm [47]. Fig. 6 shows the CPOCT-STMC flowchart. In order preliminary study, the CPOCT probe was driven by high precision motorized actuators (Newport 850G). The whole system was controlled and coordinated by LabView program through GPIB control. The probe- sample distance is set to a fixed value of D. An edge-searching algorithm is applied for each A-scan to find the actual probe-sample distance, noted as d[n]. When the probe tip is emerged in liquid, the random scattering particles suspended between probe and sample may lead to depth judgment and rogue jumps, which can cause serious result to the operation. To eliminate these unwanted events, a safety critic based on temporal comparison is applied prior to launching each tracking by defining a safe distance S, which is pre-estimated according to the mechanical module’s temporal response and the surgical target properties. Due to the limited motion speed and system response latency, there is a phase delay between the real target motion and tool tracking. The k-order autoregressive (AR) predictor is applied to decrease this kind of phase delay by actively track the rhythmic motion of the tissue target [56]. A memory buffer is used to register a total number of k values of target position, and start the AR tracking at a pre-set step number N (N>k). Finally the B-scan image is reconstructed according to the recorded probe position for A-scans. Fig. 7 shows the effect of AR filter during tool tracking, where the phase delay is decreased from 20 degree to only 5 degree after the AR filter is launched.
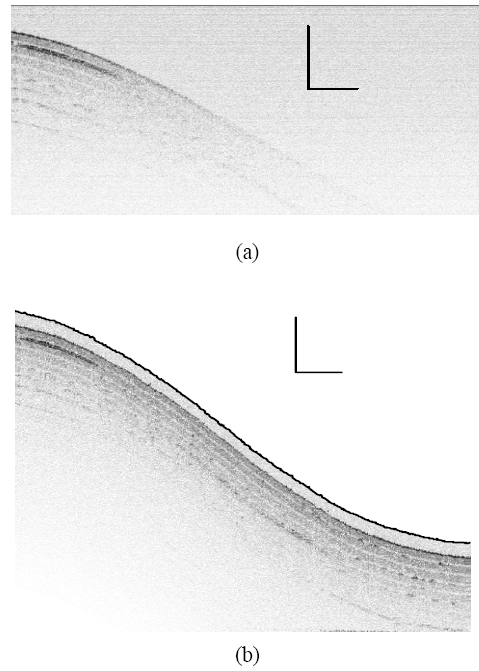
To evaluate the surface topology compensation property, a phantom consisting of 8-layers semitransparent tape with highly curved surfaces was tested. Fig. 8(a) is obtained by conventional fixed-reference OCT, where image fades with imaging depth due to limited OCT working depth, which is ~1 mm. Fig. 8(b) shows the scanning by STMC system, where the motion trace of the scanning probe is indicated by the dashed curve (also pointed by an arrow), which correlates with the surface geometry very well. To further investigate the motion compensation effect on OCT image of moving objects, a phantom sample with three flat layers is imaged by both traditional OCT and STMC OCT systems. Figure 9(a) represents an ideal static OCT image. Figure 9(b) present a distorted OCT image using OCT without the use of STMC when the target is moving periodically. Figure 9(c) shows an improved image when STMC technique was utilized. This was further improved by applying an AR predictor to the STMC technique as shown in Fig. 9(d).
V. FIBER BUNDLE AND IMAGE PROCESSING
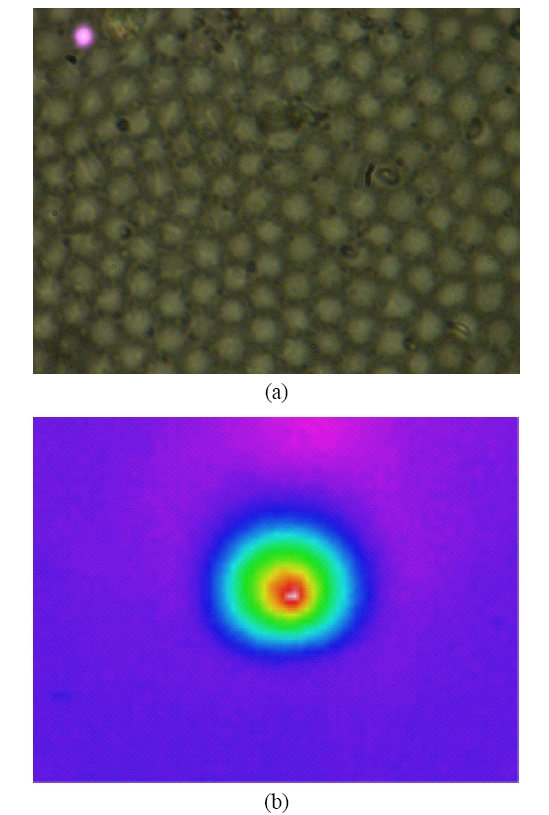
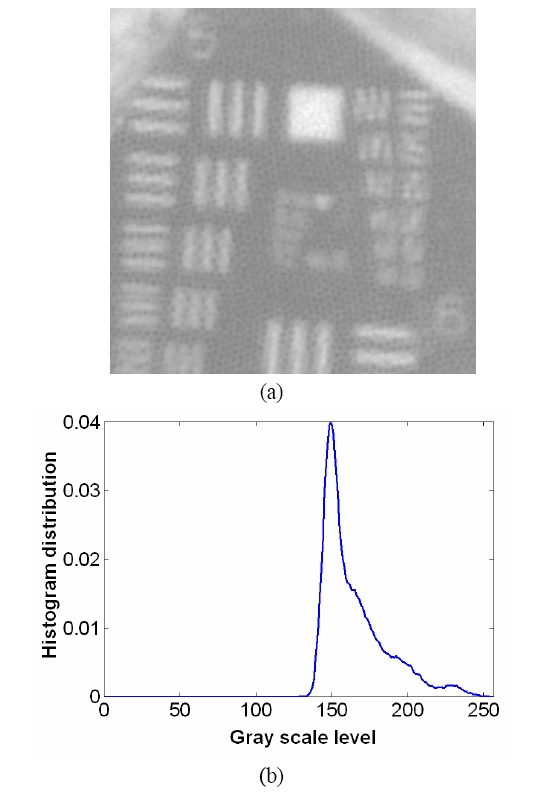
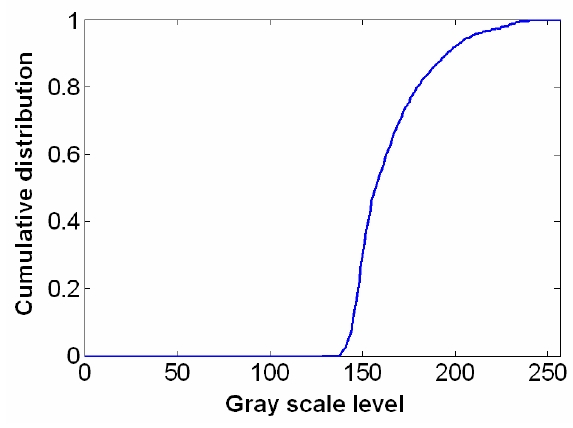
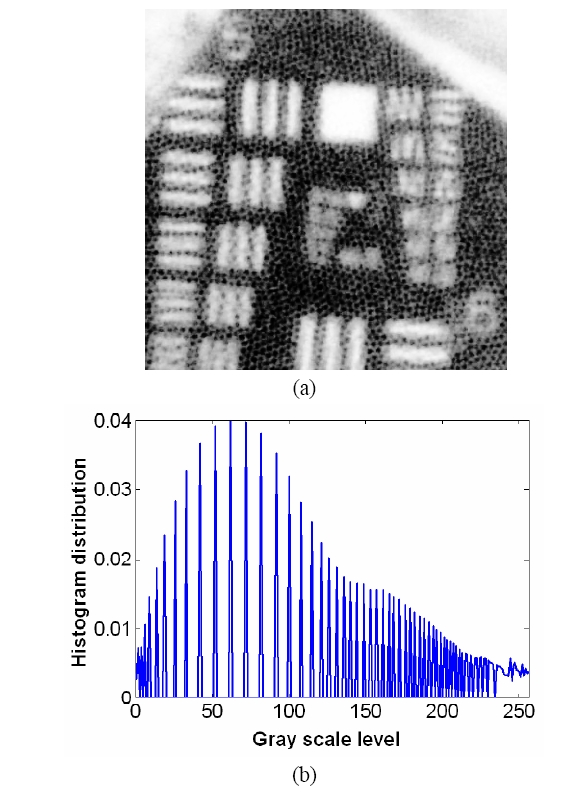
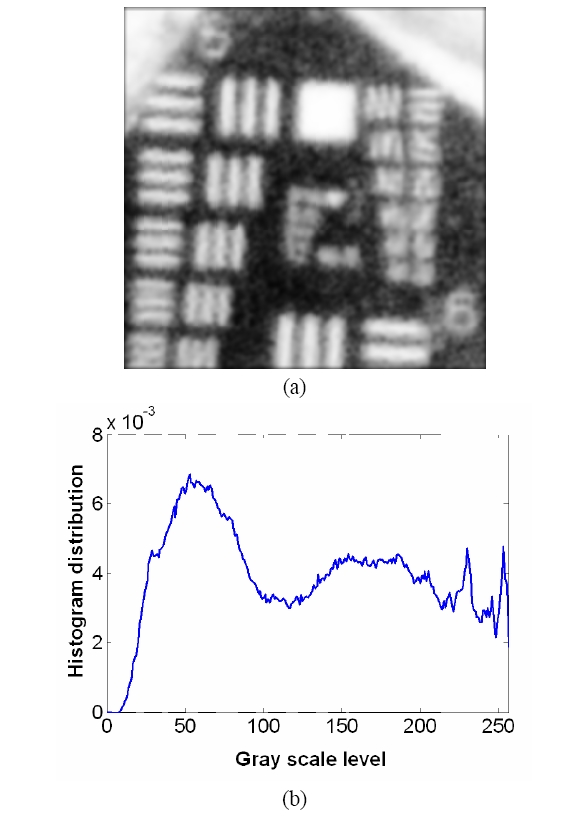
To overcome the pixelization effect on those images due to fiber arrangement as in Fig. 10(a), we proposed a method for improving the obtained raw image from a fiber bundle probe experiment by employing both the histogram equalization to pre-enhance the original low-contrast or intensity image and post-process the image using a Gaussian spatial smoothing filter which effectively decouples the fiber pixels from the image. Histogram equalization is an effective and simple way of modifying the dynamic range of image intensities or contrast that uses a point transformation of gray scale values in the input image so that the histogram of the output image has an equally likely expanded gray scale distribution. The transfer function of the histogram equalization can be directly obtained by the cumulative distribution function (CDF) of the input image histogram so that the output image can be mapped to the full range of the contrast histogram. Additionally, to remove any irrelevant details from an image or bridging small gaps, Gaussian smoothing filter is an efficient form of weighted average with different coefficients multiplied to the pixels in the kernel window. It also functions as a low-pass filter that can suppress high frequency harmonic components due to the periodic arrangement of fiber pixels. For instance, Fig. 12(a) shows the US Air Force (USAF) chart image (focused on groups 6 and 7 and their element bars with line widths in 2~8 ㎛) taken by the same fiber bundle (core diameter: 2.9 ㎛, core spacing: 4.5 ㎛, overall fiber diameter: 0.5 mm) in Fig. 10(a) where we can clearly observe individual fiber pixel. The bars (metal) are brighter than the background (glass) because of higher reflectivity. The correspon-ding histogram of the original image is displayed in Fig. 12(b) with most of the intensities concentrated on the middle range of the total contrast range (256). The corresponding transfer function for histogram equalization is plotted in Fig. 13 by taking the cumulative distribution of the original image histogram. Once we apply the histogram equalization using the above transfer function, we obtain a new image as shown in Fig. 14(a) and the corresponding image histogram is in Fig. 14(b). In this case, we can enhance all the lower contrast image contrast to be mapped in whole possible range from 0 to 255. However, all the pixels with either the bar patterns and the background without patterns are enhanced. Thus, after applying the Gaussian smoothing filter to average these effect, we can obtain resultant image with better image contrast with removed pixelation effect compared to the original unprocessed image as in Fig. 15(a). The corresponding image histogram shows that the intensities are rather distributed in the whole available contrast range in Fig. 15(b) compared to the limited original one. Therefore, we have efficiently removed the fiber pixelization effect as well as enhancing the limited-contrast image to a full contrast one so that the image contrast is improved by introducing our image processing method. Further optimizations lies in performing better beam coupling for obtaining original image and controlling parameters for the image processing filters. We can also clip some of unnecessary contrast levels by setting certain lower and upper bounds to further improve the image visualization.
We have developed and demonstrated fiber optic CPOCT based imaging and guided systems that can reliably image biological tissues with < 3 ㎛ resolution, has an ability to detect micron scale sub-surfaces and maintain a precise and safe position from the target, and also can provide spectroscopic imaging such as oxygen saturation level. The system uses simple fiber optic probes that can be integrated into various mini-probes and tools. We believe this system is capable of one-dimensional real-time depth tracking, tool motion limiting and motion compensation, oxygen-saturation level imaging, and high resolution 3-D images for a wide range of biomedical applications.


