Microbial fuel cells (MFCs) have provided new opportunities to exploit microbial capabilities that can directly convert organic materials to electricity [1], and recent investigations have focused on improving the power output from MFCs [2-4]. Several studies have demonstrated that the internal resistance in an MFC is one of the main factors affecting the performance and is significantly correlated with the power output [5, 6]. This correlation suggests that physico-chemical, biological and structural factors of MFCs, such as catalysts, electrodes, electrolytes, reactor types, and attached microbial growths on the anodes, should be collectively evaluated and optimized to increase electrical power generation
For chemical fuel cells, the relationship between the electrode surface area and current is linearly correlated with the surface area of the anode [7]. The MFC current increases with increases in the anode surface area due to its structural similarities to a chemical fuel cell [8]. Several anode materials have been investigated to increase anode surface areas. The application of a metal catalyst to the electrode is also essential to facilitate electrochemical reactions. In that sense, MFCs with graphite fiber brush anodes [8] and the use of a noble metal catalyst on anodes [9] offer good examples of the enhanced power output available from MFCs with reduced internal resistance
The attached microbial growth forming a biofilm matrix on the surface of MFC anodes is responsible for electricity generation, and plays a key role in MFCs. Several studies have verified the unique role of attached microorganisms in transferring electrons to an external circuit. Two popular hypotheses for the mechanisms of electron transfer from inside cells to anodes have been suggested. One hypothesis suggests that electrons are transferred by electron shuttles [10] or membrane-bound electron shuttling compounds [11], while the other suggests that anode-attached bacteria have nanowires that are conductive and donate electrons to the anodes [12]. These wires could make it possible to constitute a complex nanoweb structure between the anode surface and the microbial community, which may potentially explain why anode-acclimated bacteria can repeatedly generate electricity in MFCs [13]. There are several different explanations for how electrons can be transferred by selfproduced soluble mediators in bacterial colonies [14, 15], but the mechanisms of electron transfer are still debated. It can be inferred that either electrode-attached microbial growth or suspended microbial growth is primarily responsible for electron flow since those bacteria are electrochemically active and their activity changes according to the culturing conditions [13, 16].
The biofilm matrix on a solid surface seems to be highly related with extracellular polymeric substances (EPS) and naturally occurring aggregates [17]. Because it has been shown that EPS are involved in the formation of bioflocculation as well as biofilm [18], it seems feasible that the physico-chemical nature of a microbial surface can facilitate bridging between bacterial cells as well as the formation and anchoring of microbial colonies onto the anode surface. The characteristics of EPS are essential for understanding MFCs, although the complex interaction and bonding mechanisms remain to be fully clarified. EPS biopolymers, such as carbohydrate, proteins, nucleic acids and lipids, are important, not only in immobilization and growth of microorganisms on the anode surface, but also in electron transfer
The aim of this study was to gain an understanding of the effects of acclimation schemes, which adjust the growth phase of suspended and attached bacteria, on the formation of anode biofilms in single-chamber MFCs. The characteristics of the MFCs were evaluated based on their different electrical performances. Natural selection in relation to the physiological and morphological changes of attached microbial growth has been discussed to verify the primary role of suspended and attached bacteria in single-chamber MFCs
Three sets of single-chamber MFCs were designed, using square bottles (2016, NALGENE; Thermo Fisher Scientific, Waltham, MA, USA), with a 250 mL working volume. All sets of MFCs were equipped with wet-proofed carbon cloth (Type B; E-TEK, Somerset, NJ, USA) as air-cathodes, following a description in the literature [19]. The air-cathode area and amount of Pt coating were 5.9 cm2 and 0.5 mg Pt/cm2, respectively. All experiments were conducted in duplicate in a temperature-controlled room at 35℃
For the first and second sets of MFCs (MFC1 and MFC2, respectively), a non-wet-proofed carbon cloth (Type A, E-TEK) was installed at the center of each MFC as the anode. A non-wet proofed carbon cloth, with a Pt-coating on the anode surface (LT 120E-W, E-TEK), was similarly installed as the Pt-anode sets of the MFCs (PtMFC). All the anodes of MFC1, MFC2 and PtMFC had a surface area of 12.5 cm2. Each cathode and anode was connected with a titanium wire, and equipped with pluggable bulkhead connectors, and wired to an external resistor (1,000 Ω) to make a closed electrical circuit
Activated sludge was sampled from a publically owned wastewater treatment plant and used as inocula. The average concentration of volatile suspended solids (VSS) was 2.3 g VSS/L. The MFCs were fed with a solution containing 1 g/L acetate in a 50 mM phosphate buffer solution. 0.31 g/L of NH4Cl, 0.13 g/L of KCl, trace metal salts and vitamin solutions were added as nutrients, as per Lovley and Phillips [20]. The initial pH was adjusted to 7 in all the MFCs. The internal solutions were freshly replaced if there was a significant pH change or when the substrates were depleted.
2.3. Startup and Operating Procedures
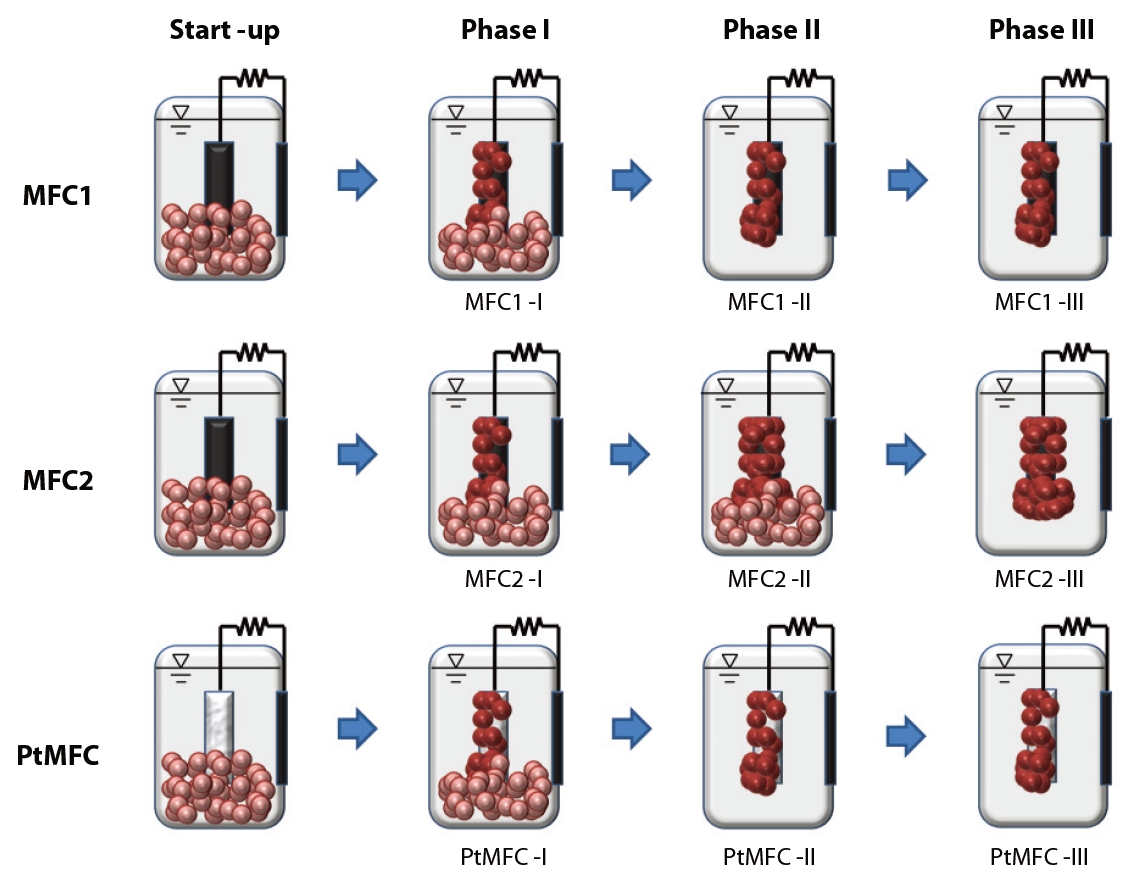
Three sets of MFCs were consecutively operated in three different experimental phases. The startup conditions for MFC1, MFC2, and PtMFC were all the same. Phase I was an acclimation period to develop the initial attachment and growth of microorganisms onto the anode surface. Substrates, nutrients and suspended microorganisms were supplied simultaneously, and the initial electricity generation behaviors in the MFC1, MFC2, and PtMFC were monitored during Phase I (MFC1-I, MFC2-I, and PtMFC-I, respectively). For Phase II, the operating conditions of MFC1-I and PtMFC-I were changed by removing the suspended microorganisms from the MFCs. The periodical replaced internal solutions of the MFC1 and PtMFC during Phase II (MFC1-II and PtMFC-II, respectively) only contained substrates and nutrients, while those for MFC2 during Phase II (MFC2-II) contained fresh activated sludge as well as the fresh medium. This semi-continuous operation mode was maintained for 630 hours, as further formation of a thick biofilm on the anode surface of MFC2-II was expected; the performances of MFC1-II, MFC2-II and PtMFC-II were compared. For Phase III, suspended microorganisms were removed from MFC2 (MFC2- III) as well. This means that during Phase III, MFC1, MFC2, and PtMFC (MFC1-III, MFC2-III, and PtMFC-III, respectively) were operated by replacing the internal solutions with fresh medium only in the same semi-continuous mode. Fig. 1 shows the overall operational schemes of the three different types of MFC according to phase.
2.4.1. General Performance Parameters
The voltage (V) across an external resistor (1,000 Ω) circuit was monitored at 20 minutes intervals using a digital multimeter (Model 2700; Keithley, Cleveland, OH, USA) connected to a personal computer. The current (I) was calculated using the equation I = V/R. The cell power output (P) was calculated using the equation P = IV. A variable external resistance (50 to 106 Ω) was used to describe the polarization curves. The power (mW/m2) and current densities (mA/m2) were calculated based on the unit area of the cathode surface (m2).
2.4.2. Extracellular Polymeric Substances
EPS were extracted from the anodes, with heat extraction [21] used to characterize the role of the EPS on the attached microorganisms and the performance of the MFCs. The anodes were suspended in saline water (0.9% NaCl solution). The samples were centrifuged (3,500 rpm, 10 minutes), with the supernatants discarded, at least twice. EPS extraction was performed at 90℃ for 1 hour on the resuspended pellet. The solution was cooled and then centrifuged at 3,200 rpm for 30 minutes. The extracted solution was analyzed for total carbohydrate and protein concentrations. The sum of the EPS carbohydrate and protein concentrations represented the total amount of EPS. EPS carbohydrates were determined using the phenol-sulfuric acid method, with glucose as a standard [22]. Proteins were determined by the Folin method, with bovine serum albumin as a standard [23]. A Beckman UV-visible spectrophotometer was used to measure the absorbance values, which were adjusted with blanks.
2.4.3. Contact Angles
The contact angles were measured at room temperature using a contact angle meter (Phoenix150; Surface Electro Optics, Suwon, Korea). The contact angle is the angle between a liquid droplet and the surface over which it spreads. Measurement of the contact angle can provide valuable information as to the nature of a surface. Water droplets were dropped carefully onto the anodes, with the average contact angle obtained by measuring three different positions on each measured sample
2.4.4. Internal Resistance
The internal resistance (Rint) was measured using electrochemical impedance spectroscopy (EIS) with a potentiostat (CompactStat; Ivium Technologies, Eindhoven, The Netherlands). Nyquist plots were generated at the open circuit voltage (OCV) over a frequency range of 105 to 0.005 Hz, with a 10 mV amplitude sinusoidal perturbation
2.4.5. Scanning Electron Microscopy
After all the experiments, the samples were fixed in a 2.5% paraformaldehyde-glutaraldehyde mixture, buffered with 0.1 M phosphate (pH 7.2), for 2 hours, post fixed in 1% osmium tetraoxide in the same buffer for 1 hour, dehydrated in graded ethanol and substituted using isoamyl acetate. The samples were then dried at the critical point in CO2. The samples were sputtered with gold in a sputter coater (SC502; Polaron, West Sussex, UK) and then observed using scanning electron microscopy (SEM, LEO 1455VP; Carl-Zeiss, Oberkochen, Germany) at the Korea Basic Science Institute (KBSI)
3.1. Startup and Initial Generation of Electricity
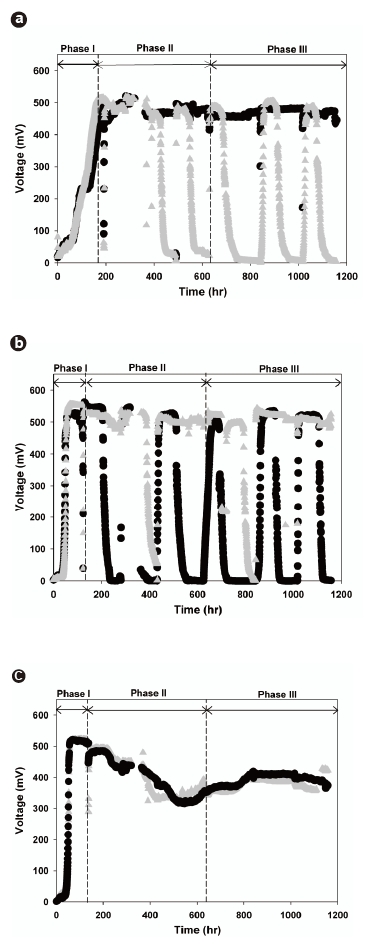
All the MFC sets successfully started generating electricity. Fig. 2 presents the voltage variations across the external resistors connected to each set of MFCs during the startup and steady-state phases. A gradual increase in the voltage was observed across the external resistor, and finally became saturated at 520 to 560 mV. The MFC voltage outputs were stably sustained during Phase I, indicating that the electrochemically active microorganisms were able to grow and transfer electrons to the external circuits in all of the investigated MFCs. Fig. 2a shows that the lag-phase period of the PtMFC-I (160 hours) was longer than those of the other MFCs (54 hours) and that the voltage increased gently towards a steady-state. These results may be explained by the hydrophobicities of the anode surfaces, which were determined from the contact angle measurements. The contact angle of the Pt-coated electrode was 124°, which was higher than that of the normal carbon cloth electrode (102°). This reveals that the Pt-coated electrode was more hydrophobic than the normal carbon cloth electrode. Thus, PtMFC-I shows less rapid initial growth and attachment of electrochemically active microorganisms on the anode surface due to the higher hydrophobicity of the Pt-coated anode surface.
3.2. Comparison of Steady-State Performances Based on Growth Phase
Removing the suspended microorganisms from MFC1-I and PtMFC-I made it possible to conduct comparative studies. Obviously, MFC1-II, MFC2-II, and PtMFC-II were rechargeable by supplementing additional nutrients and substrates (Fig. 2). It is worth noting that the voltage output of MFC1-II was stably maintained (>;500 mV) (Fig. 2b), while that of MFC2-II decreased continuously to around 350 mV, as shown in Fig. 2c. This result demonstrates that attached bacteria alone can more efficiently oxidize acetate and donate electrons compared to simultaneous growth of attached and suspended bacteria. Because electrochemically non-adapted and other heterotrophic suspended microorganisms possibly compete for substrate with those that are electrochemically active, the recharged voltage decrease can support the hypothesis that attached growth on the anode plays a significant role in the electron transfer mechanism
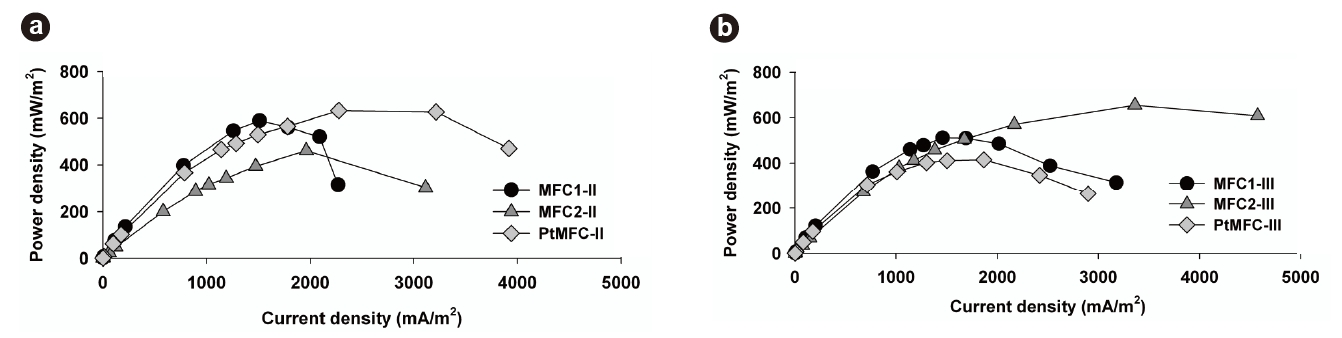
The polarization properties of the MFCs during Phase II were obtained by varying the external resistance from 50 to 106 Ω. As shown in Fig. 3a, the maximum power density of MFC1-II was 589.9 mW/m2, which was 27.9% greater than that of MFC2-II (461.1 mW/m2). However, it should be noted that the maximum power output of MFC2-II was obtained at a higher current density (1,962.1 mA/m2) than that of MFC1-II (1,512.6 mA/m2). This phenomenon shows that the suspended growth enhanced the current density, which resulted in a high power output. It was possible for suspended microorganisms to transfer electrons on the anode surface through the biofilm matrix containing attached microorganisms, which permitted stable power generation in MFC2-II, even at current densities over 3,000 mA/ m2. This means that the coexistence of suspended and attached microorganisms could prevent a sudden power density drop under high current densities, which was severe in MFC1-II. This supports the existence and advantage of the electron shuttling transfer mechanism in these MFCs
After 630 hours, Phase III was started by removing the suspended microorganisms from MFC2-II. This transition from MFC2-II to MFC2-III marked the equalization of operating conditions between all the MFC sets. These results confirmed that the voltages of MFC2-III could be recovered (>;400 mV), but that there was irreversible loss of voltage compared to the original voltage level, despite the removal of the suspended microorganisms. Moreover, the changes of phase significantly impacted the power output of MFC2-III. Fig. 3b compares the characteristics of the power density between MFC1-III and MFC2-III. The highest voltage was obtained in MFC1-III (543.2 mV) with an external resistance of 1,000 Ω; however, MFC2-III exhibited better power output when the current density was over 1,700 mA/m2. The maximum power of MFC2-III was 655 mW/m2 at a current density of 3,359 mA/m2. This behavior of MFC2-III corresponded to the previous result (MFC2-II, Fig. 3a), and even extended to higher current density levels without loss of power (Fig. 3b). The fact that the conditional differences between MFC1 and MFC2 through the phases seriously affected the attached microbial growth on the anodes, as shown in Fig. 4, where distinct morphological differences between the attached bacteria on the anode surfaces of MFC1 and MFC2 can be observed. The dense growth of attached microorganisms on the surface of the anodes was beneficial for the power output at higher current densities, although the formation process of this difference negatively impacted on the voltage generation. This suggests that higher current densities are associated with the increased density of the anode-attached bacteria. In a manner analogous to that described in previous studies, electrode materials with greater anode surface areas enhance electricity generation as this is advantageous to higher power generation due to the reduced internal resistance [24]. This study demonstrated that electricity generation can be enhanced by forming a dense biofilm, and performs similarly to other expensive anodes with greater surface areas.
Conversely, as shown in Figs. 2a and 3a, the voltage generation of PtMFC-II was more stable and its power output greater than those of other MFCs, probably due to the Pt-coated anodes. It seems certain that the Pt-coated electrode more effectively transferred electrons at startup compared to the normal carbon cloth electrode at high current densities. The reduced internal resistance facilitated a maximum power density of PtMFC-II of 632.8 mW/m2, but that of PtMFC-III decreased to 414.6 mW/m2 at a current density of 1,867.4 mA/m2 (Fig. 3b). A reduction in the power output was observed over time, which was attributed to the gradual sloughing off of the attached bacteria from the hydrophobic anode surface over time as the medium was replaced. Consequently, the dense formation of attached microorganisms was more advantageous to maximizing the power densities at high current densities than the use of metal catalysts. Moreover, it was confirmed that the hydrophobic characteristics of the Ptcoated anodes deteriorate during long-term operation of the MFCs
3.3. Comparisons of Internal Resistances
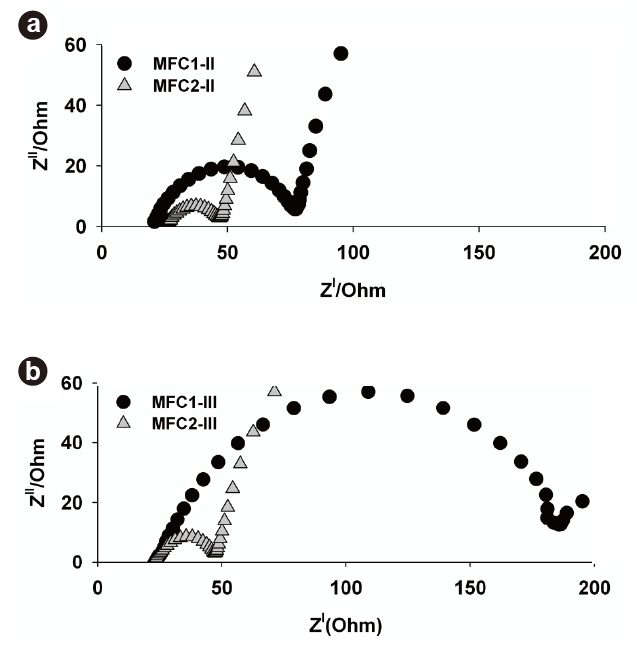
To investigate the differences in the internal resistance between the MFCs during each phase, EIS was applied, as shown in Fig. 5. A typical Nyquist plot consists of semicircles representing electrolyte resistance (ohmic losses) and charge transfer resistance at the electrode surface (activation losses) [25]. The first starting x-intercept in the Nyquist plot indicates that ohmic loss in single-chamber MFCs plays a relatively minor role compared to charge transfer resistance, which is the second intercept in the plot. A little difference in the ohmic resistances existed between MFC1-II (21 Ω) and MFC2-II (26 Ω), as shown in Fig. 5a. The existence of the suspended microorganisms in MFC2-II resulted in a slight increase in ohmic resistance, but the activation losses in the MFCs were markedly different from each other. MFC2-II had a lower activation loss (19 Ω) than MFC1-II (54 Ω), which exhibited a maximum power density at relatively low current densities. These results were associated with the different growth conditions during Phase II. MFC2-II seemed to show lower activation losses due to the coexistence of anode-attached bacteria and the suspended bacteria produced. Therefore, it was clear that the attached and suspended bacteria could synergistically decrease the components of internal resistance in MFCs, which was consistent with previous results describing the increase in power output as a function of the suspended bacterial concentration [26].
Fig. 5b shows the Nyquist plot obtained during Phase III. The increased second x-intercept of MFC1-III indicates that the charge transfer increased from 54 to 160 Ω with increasing operational period. MFC1-III operated with only the initial biofilm, as during Phase II the attached microbial growth on the anode surface was substantially related to the increased activation loss, which might have resulted in decreased electron transfer on the anode surface. Additionally, the biofilm could slough off along with active microorganisms from the anode surfaces during solution replacements, which may have caused the permanent deficiencies in performance (Fig. 4b). On the other hand, the Nyquist plot of MFC2-III showed a similar trend to that of MFC2-II, despite the removal of suspended microorganisms. The high power output of MFC2 at high current densities was continuously maintained during Phase III. It is worth noting that the formation of excess biofilm during Phase II (Fig. 4c) decreased the activation loss of MFC2-III. The activation loss, indicated by the intersection with the real-axis, in the low-frequency region corresponds to the reaction processes at the interface between the electrode and electrolyte [25]. This means that high electron transfer reactions can be achieved by densely attached microorganisms on the anode surface in MFC2-III. Since the performance of a chemical fuel cell is generally determined by the activation loss originating from a limited rate of electrochemical charge-transfer reactions at the electrodes [27], maintaining a dense biofilm on the anode surface must be a significant issue, which can also lead to high power output in an MFC
3.4. Characteristics of Attached Microorganisms on Anode Surfac
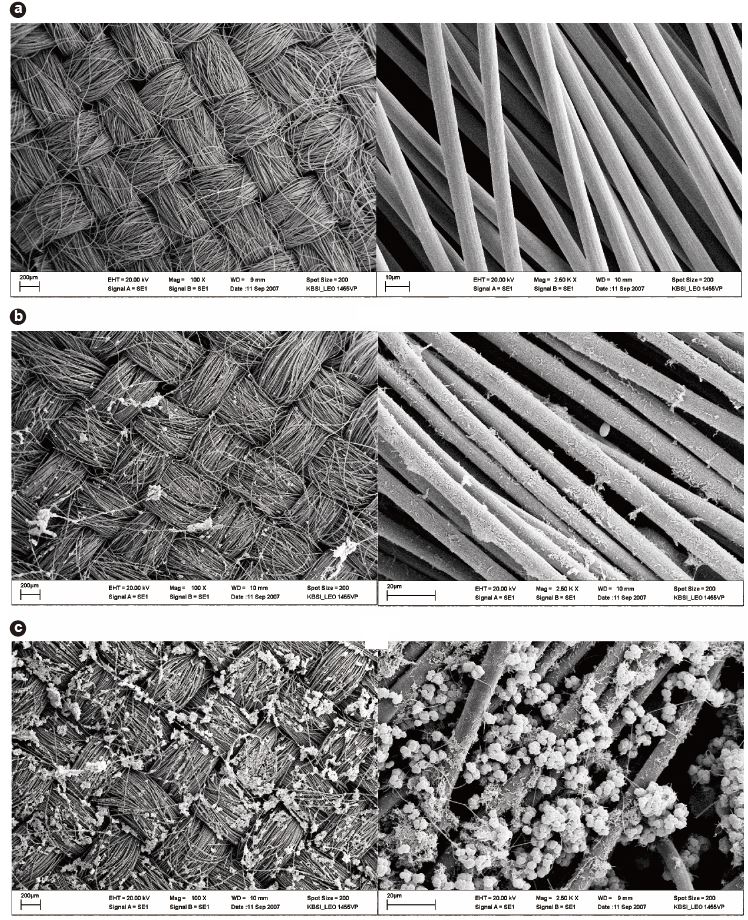
After the end of Phase III, all the anodes were immediately removed from the MFC sets for further analyses. SEM was applied to confirm the morphological differences of the attached bacteria. Fig. 4 depicts the SEM images of the anode surfaces installed in MFC1 and MFC2. Several microbial colonies were observed on the anode of MFC2, which could result in low activation loss. Different species of attached bacteria, which indicates that different growth strategies can affect the formation of anode biofilm, were also observed, as previously described [28]. Specific homogeneous spheroid cells were observed all over the anode surface in MFC2, while a relatively small quantity of cells, mainly rod-shaped microorganisms, were dominant in MFC1. Piluslike filaments, considered to be conductive nanowires [12], were observed in both MFCs. The presence of bacterial nanowires has significant implications for bacterial attachment and electron transfer to anodes. These nanowires were complexly tangled and created a nanoweb structure on the anode surface of MFC2. Because this structure bestows an increased surface area on an anode, it can not only facilitate further microbial attachment, but also improve electron flux to external circuits. In addition, the structure may contact to a greater extent with the substrate to metabolize.
3.5. Characteristics of EPS from Attached Microorganism
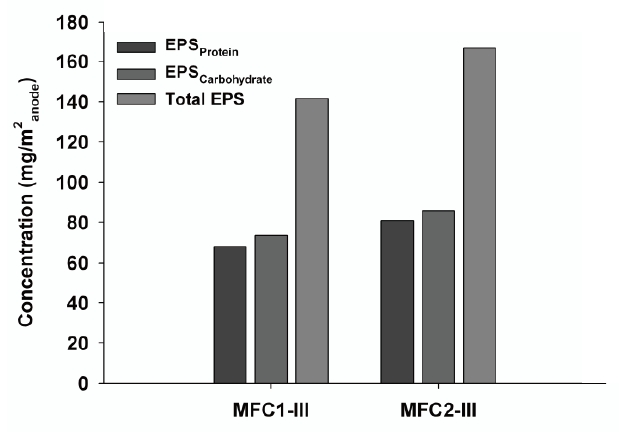
Because EPS have been shown to be involved in the formation of bacterial colonies on anode surfaces, the major EPS biopolymers, such as carbohydrates and proteins, were determined to evaluate the adhesive characteristics of the biofilm onto the anode surfaces. The EPS extracted from the anode were analyzed, as shown in Fig. 6. The results were consistent with those observed in the SEM images. The total EPS concentration on the MFC2 anode was 166.7 mg EPS/m2 anode, which was higher than that of the MFC1 anode (141.5 mg EPS/m2 anode). This means that a 17% larger biofilm matrix existed on the MFC2 anode, which plays a central role in anchoring and developing a biofilm with a larger surface area. Of the EPS substances, poly-carbohydrates and proteins are the primary components in cellular surfaces and biofilms, and comparisons between the aerial yields of carbohydrates and proteins suggest differences between the crude chemical nature of the EPS extracted from the anode biofilms in the various MFCs [18]; EPScarbohydrate and EPSprotein concentrations for MFC2 were 85.7 mg/m2 anode and 81.0 mg/m2 anode, respectively, while those of MFC1 were 73.5 mg/m2 anode and 68.0 mg/m2 anode, respectively. These results consistently demonstrate that the larger amount of EPS from MFC2 was correlated with the dense aggregation of electrochemically active microorganisms, which was consistent with the maximum power observed at a high current density. This suggests that abundant bacterial bridging in the nanowire network can enhance the MFC power and electron flux.
It was found that reduced activation losses in MFCs could generate high power output, because enhanced charge transfer rates are possible via the wide-spread development of nanoscale networks in the biofilm matrix, which anchor electrochemically active bacteria to the anode surface. Phase variation experiments confirmed that MFC currents were significantly affected by the development of attached microbial growth on the anode surfaces. For effective maintenance of the power output, maintaining a thick biofilm of attached microorganisms on the anode surface is essential, because the detachment of the biofilm matrix can eventually result in increased activation loss, which reduces the power output. It was found that Pt-coating imparted hydrophobic characteristics to the anode surface, based on the contact angle measurements, which can lead to the sloughing off of the biofilm matrix. SEM images and EPS analyses showed morphological and biopolymeric differences in the biofilm matrices that had developed on the various anode surfaces, and revealed that enhanced electron fluxes could be obtained through a nanoweb network in the biofilm matrix depending on the operational conditions. As initially assumed, longer formation periods resulted in thicker active biofilms for electricity generation on the anode surfaces, as shown by the higher measured concentrations of EPScarbohydrate and EPSprotein. This suggests that encouraging the abundant development of anode-attached bacteria could facilitate greater power output for single-chamber MFCs at higher currents.