Modeling non-point pollution across multiple scales has become an important environmental issue. As a more representative and practical approach in quantifying and qualifying surface water, a modular neural network (MNN) was implemented in this study. Two different site-scales (1.5 × 10⁵ and 1.62 × 10⁶ m2) with the same plants, soils, and paddy field management practices, were selected. Hydrologic data (rainfall, irrigation and surface discharge) and water quality data (time-series nutrient loadings) were continuously monitored and then used for the verification of MNN performance. Correlation coefficients (R) for the results predicted from the networks versus measured values were within the range of 0.41 to 0.95. The small block could be extrapolated to the large field for the rainfall-surface drainage process. Nutrient prediction produced less favorable results due to the complex phenomena of nutrients in the drainage water. However, the feasibility of using MNN to generate improved prediction accuracy was demonstrated if more hydrologic and environmental data are provided. The study findings confirmed the estimation accuracy of the upscaling from a small-segment block to large-scale paddy field, thereby contributing to the establishment of water quality management for sustainable agriculture.
Forecasting the behavior of a complex system in the environment is scale-dependent, which affects the model’s extent, accuracy, and precision. In addition, many researchers have reported that the major source of heterogeneity leading to spatial differences in runoff is topography, soils, and space-time scales of rainfall inputs [1, 2]. Depending upon this knowledge, if the primary cause of the increasing nonlinear response is attributed to significant changes in simulation accuracy, the ability of two catchments with similar topographical and hydrologic phenomena to generate simulating results within a reasonable margin of error using the same simulation model has not been determined [3].
A paddy field is grouped in a number of management blocks of paddies. Each paddy block is connected to each reach and each paddy block drains into a drainage canal. Due to these unique topographic characteristics, rice paddies, drainage and irrigation canals are related surface water bodies, like rivers, and create a unique ecosystem which should be studied as a whole system. This indicates that the spatial upscaling in water quantification and quality would be appropriate [4].
Because upscaling is very data intensive, the scarcity of relevant data at the watershed scale and the heterogeneity and incomplete understanding of the biogeochemical processes operating at this scale make physically based models of limited use [5]. Three approaches, the standard mathematical averaging methods, stochastic methods, and some regularization techniques, have mostly been applied for upscaling [6]. Many researchers have recently tried using the stochastic method, particularly artificial neural networks (ANNs) that are recognized as extremely nonlinearity analysis [7].
ANNs have been used to successfully capture trends with less knowledge of the behavior of the system in terms of interactions between biological, geological, chemical, hydro-morphological, and physical processes affecting the modeled system [8, 9]. This study adopted the modular neural network (MNN) because its interpretable and relevant neural presentation of the nonlinear behaviors in nature has been reported in many studies [10, 11]. Recently, Zhang and Govindaraju [12] used an MNN to improve the forecasting of extreme rainfall events.
The basic architecture of MNN is similar to that of backpropagation (BP). The network consists of three basic layers: input, hidden and output. The MNN scheme differs in its involvement of a number of "local experts" with each combining two forecasts. A gating network is used to determine the assignment of different regions of the two-dimensional data space to different local experts. The proposed network system consists of a layer of input modules and an additional decision module. Each input variable is connected to a single, randomly chosen input module. The outputs of all input modules are connected to the decision network. Further information about MNN architecture is presented by Azam [13].
In this study, the evaluation was upscaled from the block level to the field level by using the MNN model for the quality and quantity estimation. The specific study objectives are 1) to apply the MNN algorithm to time-dependent hydrologic and water quality data obtained from two paddy fields, 2) to prove our hypothesis that two catchments of similar topography but different size produce similar simulating results, and 3) to evaluate the feasibility of MNN as a predictive simulation tool to aid in the development of total maximum daily loads (TMDLs).
2.1. Site Description and Data Collection
Two intensive paddy fields, of area approximately 1.5 × 10⁵ m2 (small: ‘S’) and 1.62 × 10⁶ m2 (large: ‘L’), in Icheon city located in Gyeonggi province, Korea (37° 18’ 20.34’’ N, 127° 30’ 40.46’’ E), were selected for this study. The fields were isolated by enclosing banks, which prevented interactions with neighboring areas. During the study period, the two fields were irrigated with water from Bok-ha stream, and runoff water from the paddy fields was drained into Jook-Dang Stream. The study area is described in detail by Kim et al. [14].
From April to October in 2002, 2003, and 2004, the data necessary for predicting the water quantity and quality, such as rainfall amounts, irrigation, discharge water, and nutrient (total nitrogen [TN], total phosphorus [TP]) concentrations, were monitored. The topography of both areas, according to the US Department of Agriculture soil taxonomy, was of alluvial plain with somewhat poor soil drainage. This indicated that most of the excessive water irrigated to the paddy fields was discharged through the drainage canal and into Jook-Dang Stream. In addition, because multiple rice fields were irrigated with the same water sources, mixed loads of irrigation-discharge water occurred. In addition, the two paddy fields had the same geographical location, soil, land use, climatic and physical characteristics and even management practices.
As in any prediction/forecasting model, the selection of appropriate model inputs is extremely important, particularly in ANN-based multivariate forecasting, since it provides important information about the linearity and non-linearity in the data [15, 16]. However, there is currently no systematic way to determine the optimum input variables.
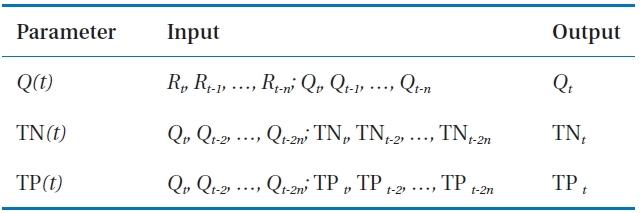
Time-dependent surface discharge is affected by many factors such as rainfall, temperature, land cover, soil type and geomorphology. Among these factors, rainfall is treated as the independent variable with the greatest influence on runoff. In this study, the inputs (i.e., at times
For data pre-processing, all data used in the calculations were normalized to prevent larger numbers from overriding smaller ones, and to prevent premature saturation of hidden nodes, which impede the learning process. Networks trained with experimental data that adequately represent the overall characteristics of the critical physical processes will achieve higher generation ability. To accomplish this goal, the total numbers of data points, 510, 292, and 288 for discharge, TN and TP, were divided into three subsets: a training set (72% of the data), a validation set (8% of the total), and a testing set (20% of the total), respectively.
In this study, the
After the selection of the input and output processing elements (PEs) for the training and test, the number of hidden PEs is specified. The network performance of an MNN algorithm can be considered a quadratic function of the number of hidden PEs; thus, a decrease in the number of PEs, just as an increase, could result in increased performance [8]. Besides the number of hidden PEs, other factors govern the simulation performance, including transfer functions (linear, TanH, sigmoid, digital neural network architecture [DNNA], sine), update rules (Delta-rule, Normalize cumulative delta, Extended delta-bar-delta, Quickpro, Maxpro, and Delta-bar-delta), the effect iteration number, learning coefficient ratio, and momentum. Detailed information about these factors in MNN computation can be found in Happel and Murre [10] and Schmidt and Bandar [11].
In comparison to BP, MNN offers the unique feature of a local expert. This acts as a specialized learning function so that each partition of input elements is classified in a competitive manner. Therefore, the output of MNN becomes a weighted sum of the outputs of the nested expert neural networks, weighted by the corresponding gating networks output at each level of the hierarchy [18].
[Table 1.] Input parameters depending upon their application

Input parameters depending upon their application
Model parameters are estimated for each of the independent variables to evaluate the statistical significance of that variable for explaining the spatial variation in the in-stream nutrient loads. The MNN was created with NeuralWorks Professional II/ PLUS software (version 5.22; Neuralware, Carnegie, PA, USA), and this package allows users to develop their own models by providing different networks and control parameters.
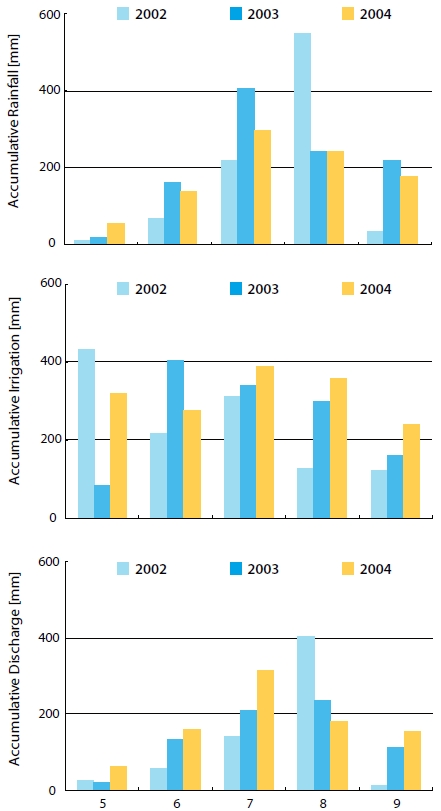
Climatologically, heavy rainfall over Korea mainly occurs from a quasi-stationary polar front for a period of 30?40 days from late June through the end of July, and rainfall in this period accounts for more than 40% of the annual rainfall [19, 20]. A similar seasonal pattern of rainfall was presented in this study (Fig. 1).
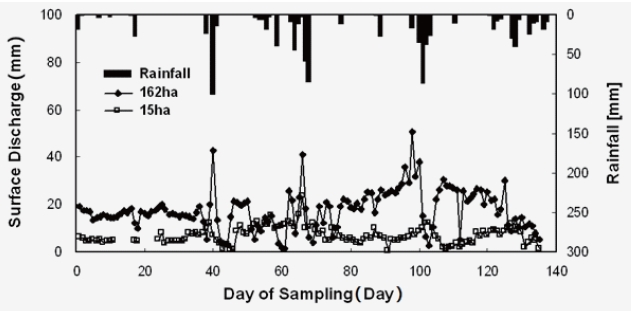
Rainfall between May and September was increased in 2003 and 2004 by 0.95% and 11.51% compared to 2002, leading to decreases in required irrigation of 28.68% and 13.15%, respectively. In addition, surface discharges corresponding to the same rainfall event from the S and L fields are shown in Fig. 2, revealing that the hydrologic phenomena are scale-dependent.
The recorded TN concentrations of the irrigation water into the watershed of paddy rice farming were generally a little higher than those of the surface discharge. The effluent TN concentrations of the watershed were lower than the influent TN concentrations, tending towards filtration, such as the uptake by plants and denitrification in soils, during the cultivation period. While the TN concentration of the irrigation and discharge water was not significantly different (
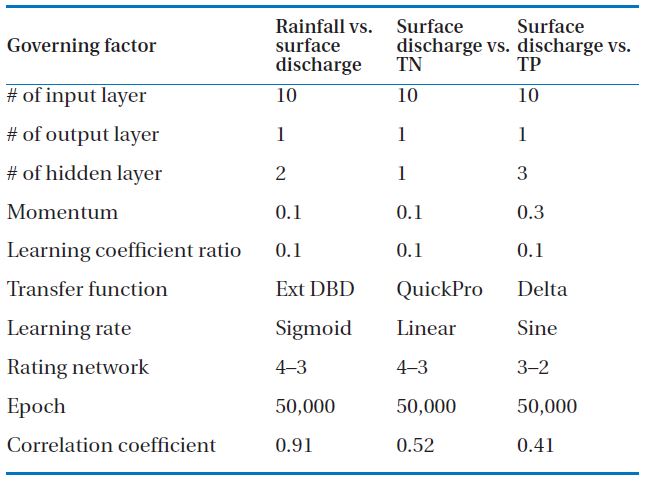
Daily data collected from the S and L paddy fields were used for training, validation and testing of the MNN. Table 2 summarizes the best architecture of the MNN. Depending upon its application using rainfall, surface discharge, and TN and TP concentrations, the responses of each governing factor clearly differed. To better elucidate the MNN behavior, sensitivity analysis of each governing factor in the MNN was conducted. Three applications regarding water quantity and quality showed different results. The observing network responses to a change of governing factors in the MNN algorithm showed that the type of transfer function significantly influenced the model results, followed by the rating network, learning coefficient ratio, update rule, momentum and the number of hidden layers in the rainfall-surface discharge prediction. In the case of TN prediction, the learning function was an influential factor, followed by the learning coefficient ratio, transfer function, number of hidden layers, rating network, and momentum. The transfer function was ranked the most influential, followed by the learning coefficient ratio, rating network, number of hidden layers, update rule and momentum in TP prediction.
[Table 2] The best model parameters and results for MNN’s performance and optimization.

The best model parameters and results for MNN’s performance and optimization.
Table 2 also lists the linear correlating coefficients (R) for the resulting predictions from the networks versus the measured values, which ranged between 0.41 and 0.95. Individual results were R = 0.95 for surface discharge prediction by corresponding rainfall, and R = 0.52 and 0.41 for the TN and TP predictions by the corresponding surface discharge, respectively. Contrary to the excellent simulation result from the rainfall-surface discharge, the prediction results of TN and TP concentrations gave relatively poor results.
TMDL Acts have been implemented in the Republic of Korea amidst calls for new tools to quantify the nutrient fate and transport from various sources. The accurate estimation of nutrient loading from diffuse sources, particularly paddies, is essential, but there is currently little or no baseline data in Korea [14]. The surface water relationship between rice paddies and water canals creates a unique ecosystem that necessitates its study as a whole system.
This peculiar topographical characteristic of paddies enables the spatial upscaling in water quality and quantity. This study assessed the potential for upscaling prediction of waters from block to field scale of paddies. The scale compatibility of the two study areas, S and L, was examined for the possibility of significant upscaling effects in simulating the surface discharge and water quality. The computational parameters were optimized to generate the best achievable simulation results for surface discharge and water quality. In the results, the high agreement between the measured and computed surface discharge indicated that surface discharge has a predictable correlation with rainfall. On the other hand, the model prediction of nutrient concentration was not as accurate as expected. It was difficult to correlate the surface discharge with the nutrient concentrations in the drainage water due to the uncontrollable variation of nutrients already present in the irrigation water.
The study findings indicated that MNN implementation can serve as a powerful assessment tool to quantify surface discharge corresponding to rainfall. In addition, MNN could be a useful tool for defining the cause-and-effect of nutrient losses into neighboring surface water, thereby fostering a better understanding of the hydro-geologic system and improving future modeling endeavors. With the regionalization of effective and representative model input parameters, this study has provided further proof that the same model concept can be applied to both small-scale plots and large-scale fields, which supports a better understanding of the scale effects, and will contribute to many current studies regarding nutrient TMDLs, especially for paddy fields.