To maintain the quality of drinking water from a water purification plant to the supply taps is very important. In order to achieve this, residual chlorine is essential, and the multiplication of bacteria must be suppressed. However, heterotrophic bacteria are known to adhere to the inner surface of pipes, where they proliferate and form biofilms under the condition without residual chorine[1, 2]. The regrowth of bacteria and detachment of biofilms would cause a deterioration of in the quality of water in the distribution system. Some bacteria in biofilms are known to not be eliminated by chlorine disinfection[3-5]. Generally, bacterial regrowth is associated with assimilable organic carbon (AOC). Van der Kooij et al.[6], Escobar and Randall[7] suggested AOC should be less than 10 μg/L to limit the growth of heterotrophic plate counts (HPCs) of bacteria in un-chlorinated systems. Therefore, the reduction of AOC is also an important measure for the control of bacterial regrowth. In Japan, interest has not focused on the reduction of AOC, since the maintenance of residual chlorine successfully controls bacterial regrowth. However, the reduction of AOC may be effective in both reducing the chlorine dose and controlling bacterial regrowth. There have been many investigations on the behavior of AOC in water purification systems. The concentration of AOC is difficult to control using conventional drinking water treatment processes[8, 9, 10]. Conversely, there have only been a few studies on the behavior of AOC in water resources. Especially, the effect of eutrophication on the behavior of AOC is unclear, although eutrophication significantly affects water purification processes. In addition to the presence of dissolved natural organic matter (NOM), surface water, such as lakes, is subject to seasonal algal blooms, which can contribute significantly to the organic carbon load in drinking water treatment systems[11]. Algogenic organic matter (AOM) is not easily chemically and biologically degraded. Blooms of blue-green algae or diatoms cause difficulties in controlling dissolved organic carbon (DOC) because of the release of extracellular AOM (EOM) into water, as well as the release of intracellular AOM (IOM) by cell lysis. Algae and EOM can be precursors for disinfection by-products (DBP). The existence of AOM composed of glycolic acid, carbohydrate, amino acid and organic phosphorus etc might cause an increase in the AOC concentration[12-15].
This study was performed in order to examine the variation in the AOC concentration at a drinking water resource, and discover the characteristics of AOC derived from algae. The seasonal changes in the AOC concentration in the Kamafusa dam, the main reservoir of Sendai city, Japan, and three inflowing rivers were investigated. The influence of algae on the AOC concentration was studied via a series of experiments; (1) to assess the generation of AOC derived from the EOM of the bluegreen alga, Phormidium tenue, under different culture medium conditions, and (2) to assess the formation and the removal of AOC derived from the EOM and IOM due to chlorination.
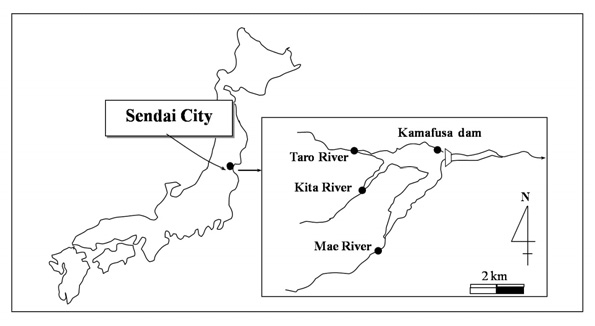
Sample waters were taken from the Kamafusa dam and the three rivers; Taro, Kita and Mae, as shown in Fig. 1. The Kamafusa dam is one of the main drinking water resources in Sendai city, which the three rivers flow into. The end product after the water purification plant process of the Kamafusa dam was also sampled. Sampling was carried out once in about 2 months over a 14 month period.
The determination of AOC has been developed to measure the potential for bacterial regrowth, based on the measurement of the maximum extent of growth of a selected pure bacteria culture in representative water samples in which the indigenous bacteria have been killed or inactivated by heat treatment. Colony counts are used for determining bacterial densities. The analytical method developed by van der Kooij[6] was adopted in the present study. The method employs
The blue-green algae,
[Table 1.] The components of culture media.
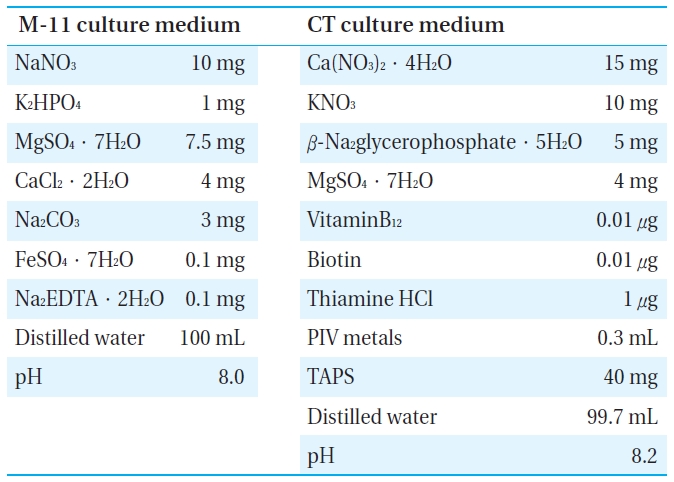
The components of culture media.
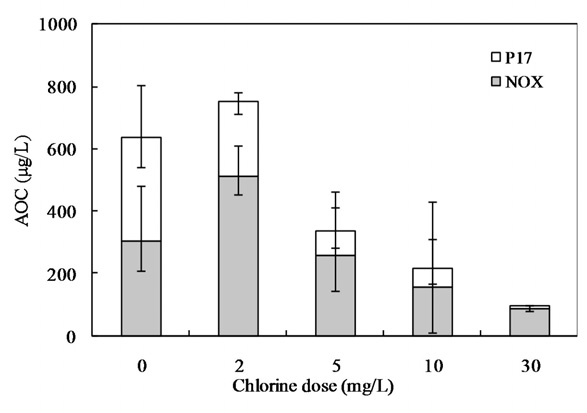
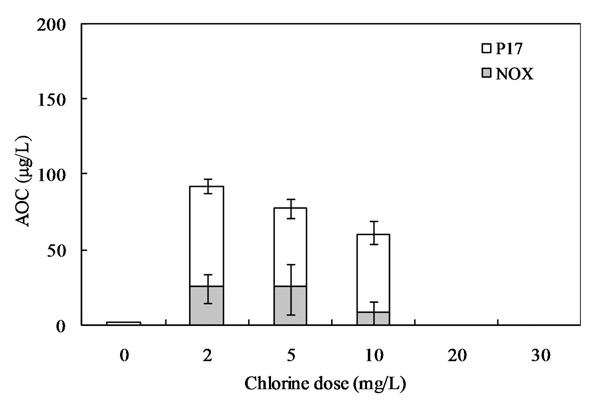
Sodium hypochlorite (NaOCl) solution was standardized by titration, and then diluted with distilled water. The chlorine doses were set at 0, 2, 5, 10, 20, and 30 mg/L. Sealed 3 L amber glass bottles were used for the chlorine oxidation experiment. The amber glass bottles were also covered with aluminum foil to prevent photodegradation of the solutions. The contents of amber glass bottles were stirred continuously with a magnetic stirrer. After chlorine oxidation, a sample was withdrawn from each bottle, and then filtered through a GF/C filter and the reaction terminated by the addition of sodium thiosulfate immediately after collection.
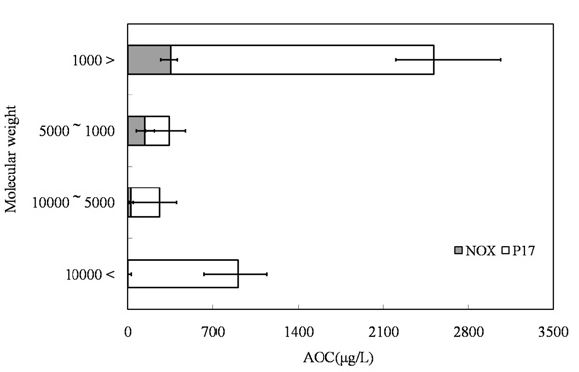
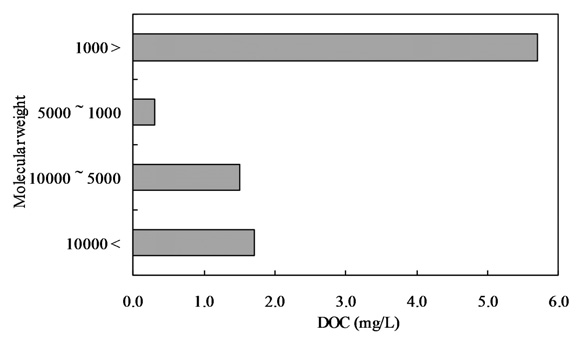
The samples were initially filtered through a Whatman GF/F filter and then subjected to ultra filtration (Regenerated cellulose PL, Ultra filtration membranes; MILLIPOERK, USA). The samples were fractionated into 4 fractions by molecular weight (lower than 1,000 Da, 1,000-5,000 Da, 5,000-10,000 Da, and higher than 10,000 Da).
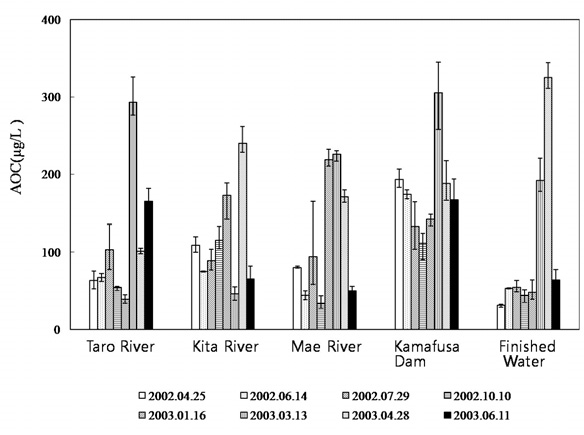
3.1. Seasonal Variation of AOC in Dam and River
Fig. 2 shows the AOC concentrations at each sampling point. The AOC concentration of the Kamafusa dam ranged from 111 to 305 μg/L; where as those for the three rivers flowing into the dam ranged from 34 to 293 μg/L. The average AOC concentration of Kamafusa dam was 178 μg/L, approximately 1.6 times higher than that of the rivers, meaning that the AOC concentration of the Kamafusa dam tended to be higher than that of each river (t-test,
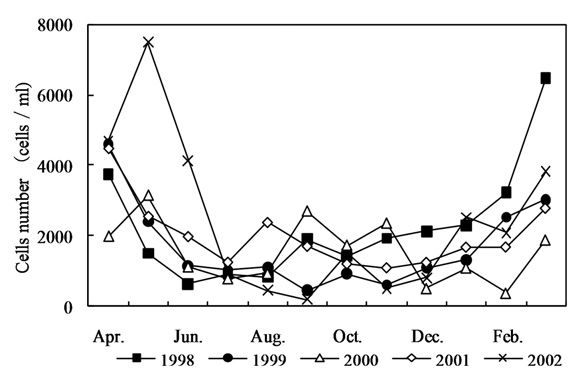
3.2. Relation between AOC and Algae
In order to understand the increase in the AOC concentration in the Kamafusa dam, the relationship between the AOC concentration and algal cell numbers [16] was investigated (shown in Fig. 4). The seasonal change of the algal cell numbers showed a similar tendency to that of the seasonal changes in the AOC concentration. The algal cell numbers increased in spring and decreased in autumn. An average cell number of about 4,700 cells/mL was observed in spring, which was over 2 times greater than those of the other seasons. From these results, it was considered that algal growth could have caused the increase in the AOC concentration. Therefore, the effect of algal growth on the variation in the AOC concentration was investigated.
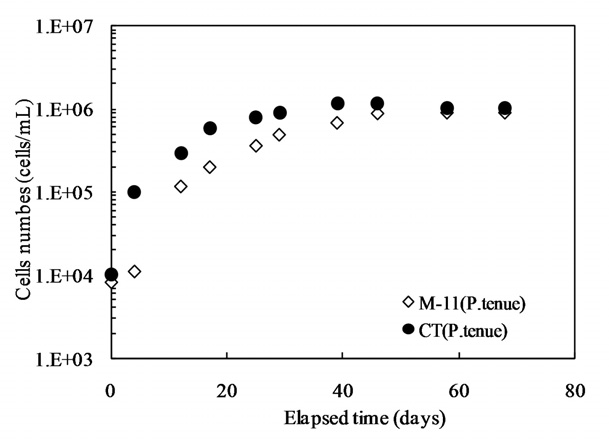
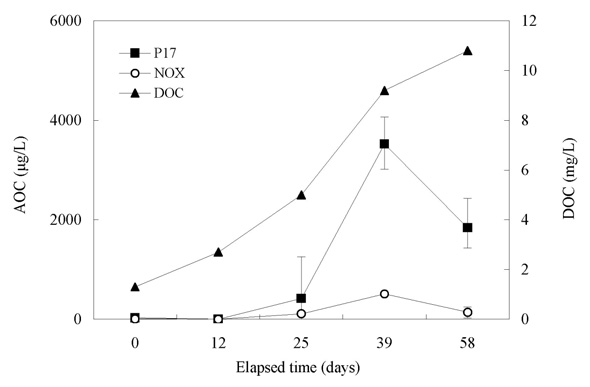
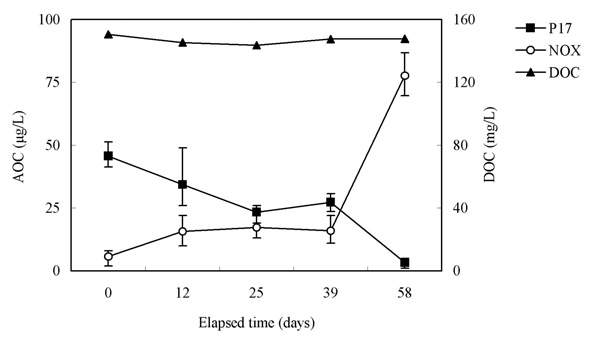
3.3. Effect of Algal Growth on AOC
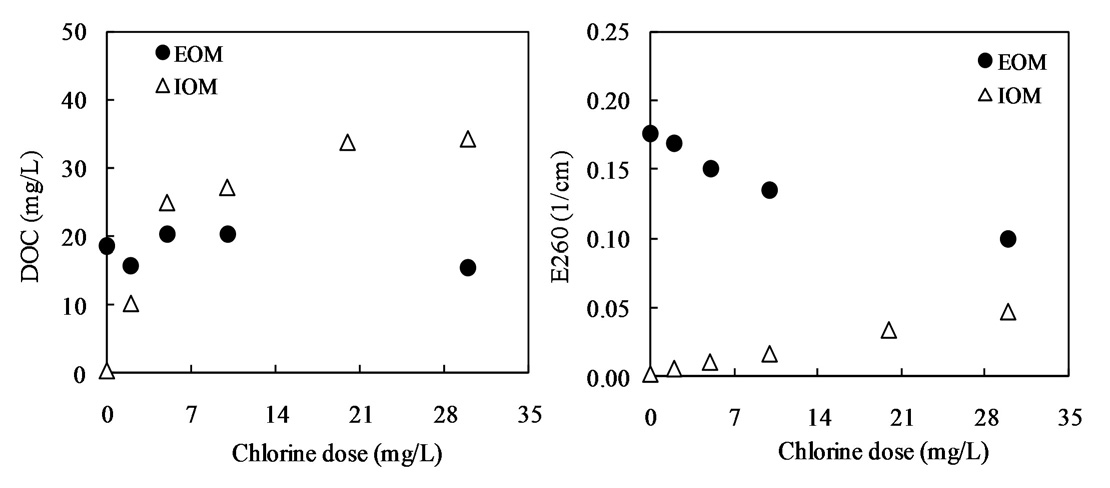
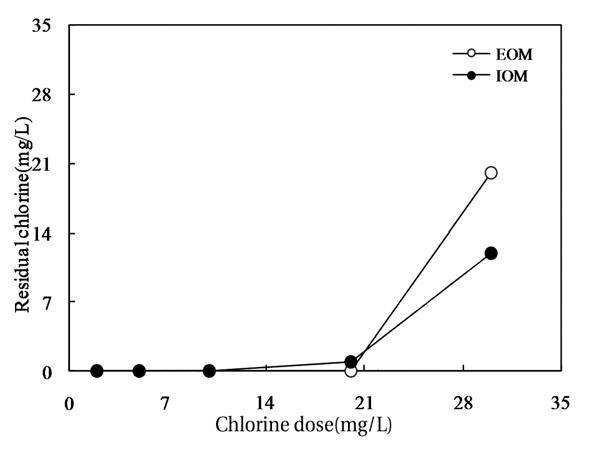
3.4. Effect of Chlorination on AOC Included in AOM
Fig. 10 shows the relationship between the chlorine dose and residual chlorine for EOM and IOM. The chlorine demand for the oxidation of EOM and IOM (
Our interest has been in the variation of the AOC concentration in drinking water resources. In present study, a field survey at the Kamafusa dam, the drinking water resource of Sendai city, Japan, as well as the three inflowing rivers, was conducted over a 14 month period. The higher AOC concentration in the Kamafusa dam compared with those of the three rivers indicated that eutrophication could cause changes in the AOC concentration. The algae appeared to be an important factor relating to the variation in the AOC concentration. To understand the effect of algae on the AOC concentration, how the AOC was produced due to algal growth and varied with chlorination was investigated. The AOC included in EOM could be formed in large amounts by algae grown in fresh culture medium, including organic substances, such as in the M-11 culture medium. This result implied that a lower concentration of an organic substance could actively stimulate algal metabolism. The EOM produced by
This work was financially supported by the Korea Ministry of Environment (EOM) as the ET-Human resource development project.