Ozone treatment is known to be more effective at inactivating
The ozone contactor model (
The mathematical equations within the
The objectives of this article were to: 1) estimate the design and operational parameters of a new ozone contactor by predicting the residual ozone concentration,
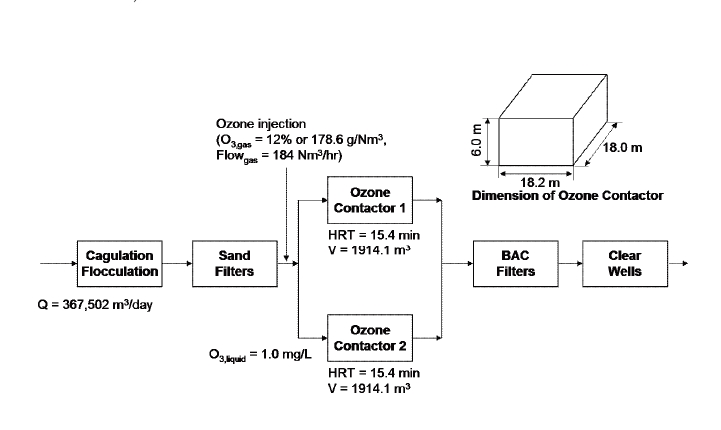
The processes of the targeted water treatment plant were composed of coagulation/ flocculation/ sedimentation, sand filtration and secondary disinfection, as shown in Figure 1. New ozone contactors and biological activated carbon filters were added to the water treatment plant. The primary target of ozonation was to remove taste and odor rather than inactivate
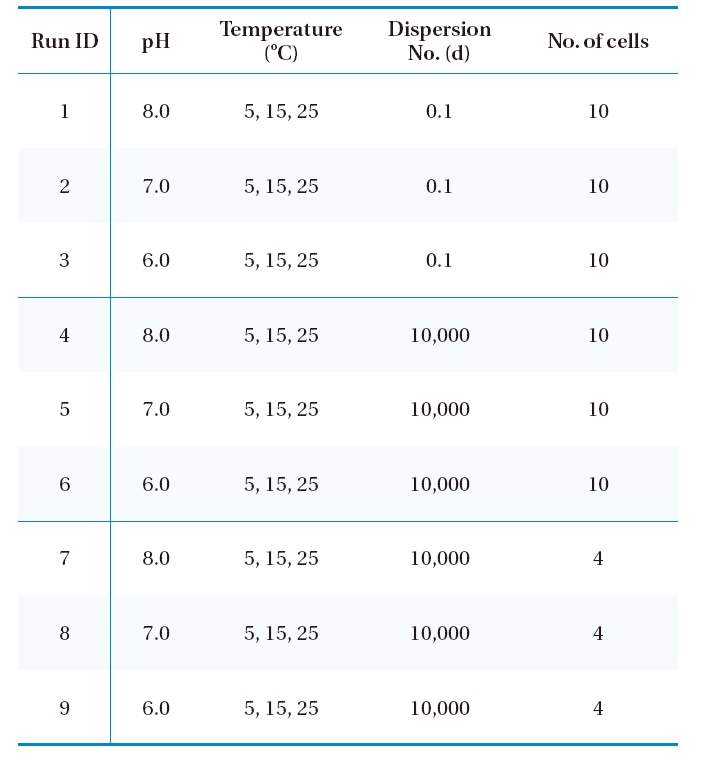
For the entire simulation, the inlet ozone concentration was fixed as 1.0 mg/L, which was the target ozone concentration in the design phase and maintained by the injection of ozone using a side stream venturi just before the ozone contactor. Table 1 summarizes the simulation scenarios used in this study. The kinetic parameters at three pHs (i.e., 6.0, 7.0 and 8.0) and three temperatures (i.e., 5, 15 and 25℃) were obtained from the literature,12) with raw water was taken from sand filter effluents
[Figure1] A schematic diagram of the water treatment plant, with relevant dimensions and flow rates.

of a water treatment plant treating raw water from the Paldang impoundment in Korea.
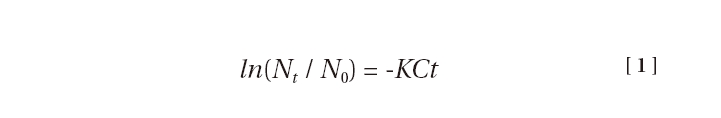
where Nt and N0 are the numbers of viable

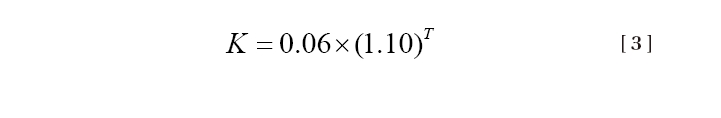
This equation was proposed as the best fit to the experimental data, but did not include any safety factor. In contrast, the following equation used in this study estimated
The dispersion number (
[Table 1.] Numerical simulation scenarios for a new ozone contactor.

Numerical simulation scenarios for a new ozone contactor.
[Table 2.] The volumes of 10 cells (Run 1-6) and 4 cells (Run 7-9)
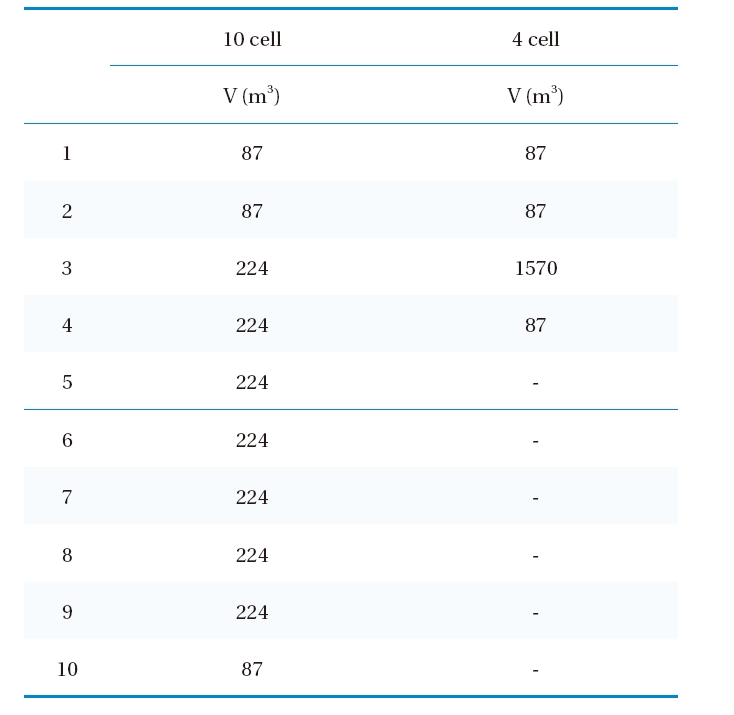
The volumes of 10 cells (Run 1-6) and 4 cells (Run 7-9)
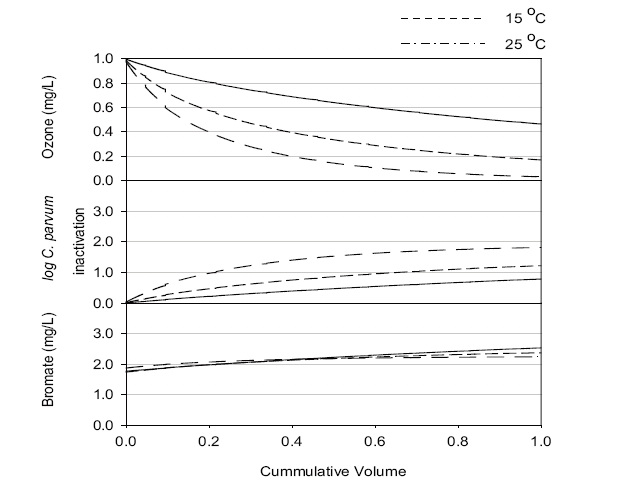
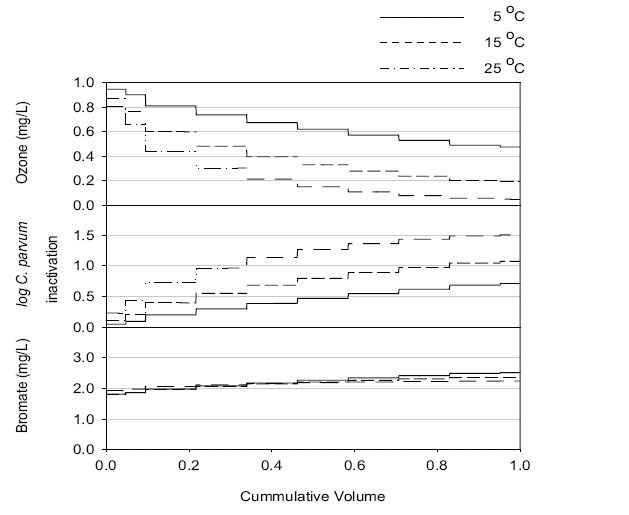
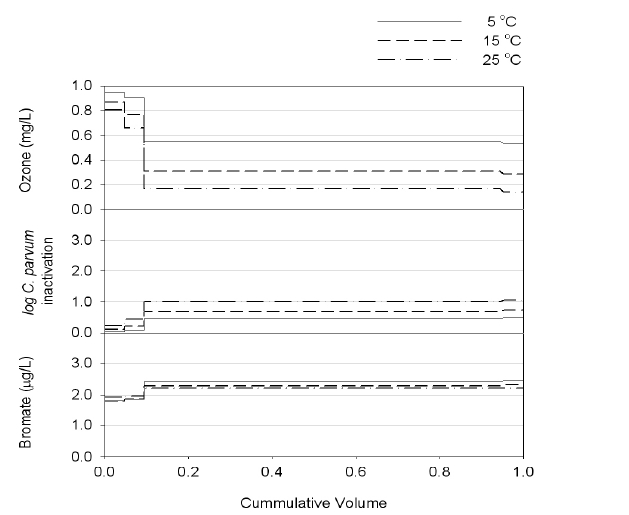
Numerical simulations were carried out with the OCM software to estimate the performance of a new ozone contactor under nine scenarios, as shown in Table 1. Figures 2, 3 and 4 show representative simulation results for Runs 1, 4 and 7, respectively. Table 3 summarizes the overall simulation results for residual ozone,
3.1. Residual Ozone Concentration
Controlling the residual ozone concentration is critical for successful contactor operation because residual ozone within the effluent may negatively influence subsequent unit processes. For example, residual ozone could cause irritant odor, corrosion and oxidation of activated carbon in the biological activated carbon filters. Especially, ozone contactors designed for the controls of taste and odor have a shorter residence time than those targeting the inactivation of
3.1.1. pH effect
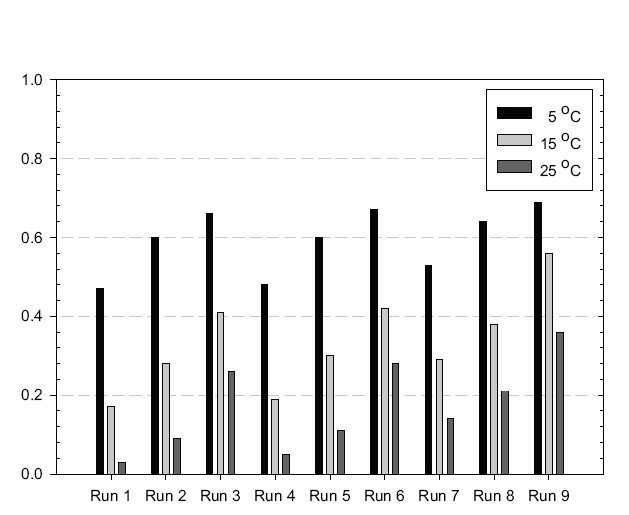
The residual ozone concentration was strongly affected by pH, with the highest and lowest values at pH 6.0 and 8.0, respectively, among three pHs investigated, as shown in Figure 5. The simulation results suggested that an initial ozone concentration of 1 mg/L might result in a significantly high residual ozone concentration under most simulation conditions, except pH 8.0 and 25℃, which could be a challenge for the plant operation due to the aforementioned reasons. Increasing the pH would be preferred for low ozone concentrations within the effluent.
Figure 5 shows that the hydrodynamic conditions (i.e., degree of dispersion in ozone contactor) can affect the residual ozone concentration. When Runs 1-3 and 4-5, with a low and high dispersion numbers, respectively (i.e.,
3.1.2. Number of Cells
Simulations were performed with ten (Runs 4-6) and four cells (Runs 7-9). Runs 4-9 were performed with the same dispersion number of 10,000. The simulation results suggested the effluent ozone concentration for Runs 4-6 (i.e., 10 cells) would be much lower than those for Runs 7-9 (i.e., 4 cells) especially at high temperature. The difference was smallest at 5℃ and highest at 25℃. These results suggested that dividing the ozone contactor into a larger number of cells would be beneficial for lowering the residual ozone concentration within the effluent. Note: a greater number of cells results in overall contactor hydrodynamic conditions closer to PFR.
3.1.3. Summary
Residual ozone would be more problematic at low temperature and low pH. Hydrodynamic conditions might also play important role, especially with respect to division of the contactor using baffle walls. Decreasing dispersion number and increasing number of cell divisions could be beneficial for lowering the effluent residual ozone concentration, although there could be limited solution for low temperature seasons. Given a 1 mg/L ozone concentration in the influent to the ozone contactor, the simulation results suggested that it might be a challenge to control the residual ozone within the contactor effluent unless the addition of quenching agents, such as hydrogen peroxide, was considered. An alternative ozonation point (i.e., shift from post filtration to pre-filtration or pre-coagulation) could be considered. More natural organic matter before filtration process could promote ozone decay by promoting both hydroxyl radical chain reactions and direct oxidation. Additionally, better removals of both taste and odor could be expected due to the presence of abundant hydroxyl radicals.3) However, ozonation before pre-filtration could be accompanied by excessive bubble formation in the sedimentation tanks or filters, which would be a trade-off.
3.2 C. parvum oocyst Inactivation
3.2.1. pH effect
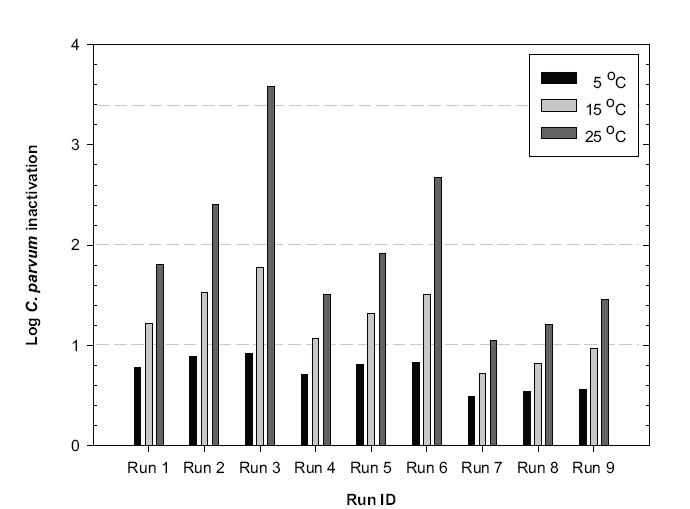
The predicted C. parvum oocyst log inactivation increased at the lower pH, as shown in Figure 6. Since the kinetics of
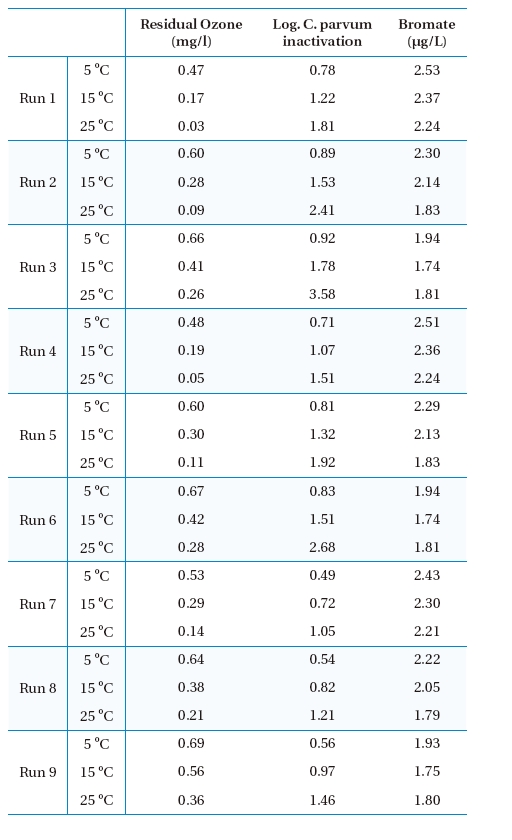
Simulated results of ozone, C. parvum oocyst inactivation and bromate for the final effluent of the ozone contactor.
3.2.2. Temperature effect
The kinetics of
3.2.3. Dispersion Effect
Figure 6 shows that the effect of the hydrodynamic conditions on
3.2.4. Number of Cells
As described previously, simulation Runs 4-6 were performed with ten cells and Runs 7-9 with four. All the simulations were performed assuming the same dispersion number of 10,000. The predicted inactivation efficiencies were much higher for Runs 7-9 than Runs 4-6, which was ascribed to the lower dispersion number with more cells. The estimated dispersion numbers (
3.2.5. Summary
Increasing the number of cells in the ozone contactor, or lowering the dispersion number (
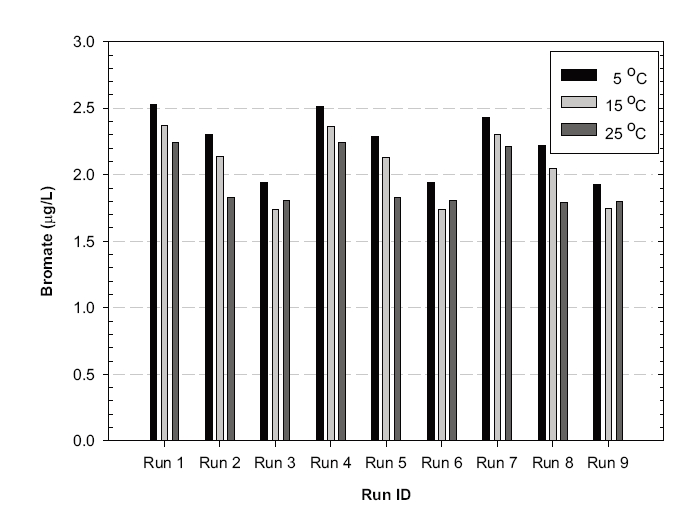
The simulation results shown in Figures 2, 3 and 4 suggest that bromate might be rapidly formed during the initial stage of ozonation for all the scenarios investigated, which was consistent with the observation at the batch tests.12) The predicted overall effluent bromate concentrations were less than 3 μg/L, as shown in Figure 7, which were much lower than the current maximum contamination level (MCL) of 10 μg/L imposed by the USEPA. These results suggested that bromate formation during ozonation might not be a concern for the new ozone contactor.
More bromate was produced at the lower temperature in these simulations, although the conversion kinetics was faster at the higher temperature.12) This was ascribed to some of the bromate being formed from direct reaction with bromide and ozone molecules. Note: the residual ozone concentration was higher at low temperature. More bromate was produced at higher pH because more OH radicals and hypobromite (OBr-) were formed, with the latter being a key intermediate of bromate formation. A lower dispersion number and larger number of cells negligibly contributed to bromate formation. These suggested that efforts to decrease the dispersion number or increase the number of cell could be beneficial for
The residual ozone concentrations within the effluent were influenced by pH, temperature, dispersion number and the number of cells. Minimizing the effluent ozone concentration to less than the allowed level was challenging in most simulations. Hence, decreasing the initial ozone concentration, using a quenching agent and by shifting the ozonation point should be considered in the design. The efficiency of