Natural organic matter is a complex mixture of compounds including humic substances, hydrophilic acids, amino acids, lipids, and proteins. Humic substances (humic acid, fulvic acid, humin) are major constituents of natural organic matter.1) They are found in varying concentrations in aquatic environments and present as dissolved molecules or colloidal/particulate forms.2) In environmental systems, humic substances play several significant roles related to water quality issues: i) producing disinfection by-products (DBPs) such as trihalomethanes (human carcinogens) by reacting with chlorine in water treatment, ii) enhancing the transport of hydrophobic organic contaminants or heavy metals by binding with them, iii) causing bacterial growth in water distribution systems by serving as food source, iv) inducing unpleasant taste and color in drinking water.3-6) It is, therefore, necessary to remove humic substances from water using effective treatment processes.
In conventional water treatment processes, chemical coagulation/ flocculation has been widely applied to remove humic substances using metal salt coagulants (e.g. alum, ferric chloride). This process, however, generates a large volume of sludge and requires a high operational cost.7) As an alternative to coagulation/ flocculation process, adsorptive filtration using granular media coated with metal oxyhydroxide has attracted considerable attention for humic substances removal. Humic substances are negatively-charged at circumneutral pH conditions due to the prevalence of carboxyl and phenol groups on their surface.8) Therefore, surface interactions between humic substances and sand are not favorable because both are like-charged such that sand filtration process is not effective in the removal of humic substances.6) However, surface charge modification of sand via metal oxyhydroxide coating generates positively-charged granular media, leading to favorable surface interactions between them. Even though several researchers have reported the interactions between humic substances and metal oxides in batch conditions,9-12) only few studies have been performed in column experiments to examine the adsorption of humic substances to coated-sand filter media,13,14) and their studies have focused on the effect of humic acid on the adsorption of metal ions to iron oxide-coated sand. Further experiments are required to improve knowledge regarding the adhesion of humic substances to coatedsand media.
Therefore, column experiments were performed in this study to investigate the adhesion of humic acid to iron oxide-coated sand under different experimental conditions including influent humic acid concentration, flow rate, solution pH, and ionic strength/ composition. Breakthrough curves of humic acid were obtained by monitoring effluents, and then parameters related to column performance were quantified from these curves.
Quartz sand (Jumunjin Silica, Korea) was used in the experiments. Mechanical sieving was conducted with US Standard Sieves (Fisher Scientific) Nos. 35 and 10. Sand fractions with a grain size of 0.5-2.0 mm were used to prepare the iron oxidecoated sand. Before use, sand was washed twice using deionized water to remove impurities on the surface, and wet sand was autoclaved for 20 min at 17.6 psi, cooled to room temperature, and oven-dried at 105℃ for 1-2 days.
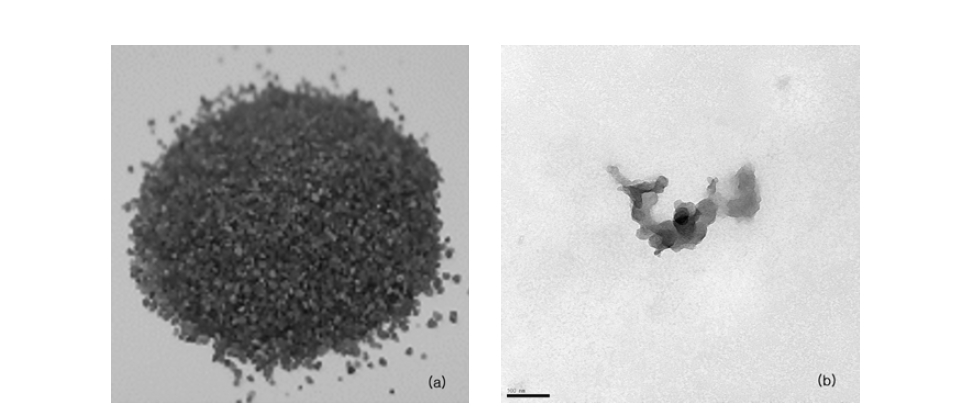
For the preparation of iron oxide-coated sand (ICS), FeCl3? 6H2O (5.5 g) was dissolved in deionized water (100 mL), and the solution pH was adjusted with 6N NaOH. The quartz sand (200 g) was added to the FeCl3?6H2O solution and then mixed in a rotary evaporator (90℃, 80 rpm, 20 min) to remove water in the suspension by heating (Hahnvapor, Hahnshin Scientific Co., Korea). The coated sand was dried at 150° for 6 hr, washed with deionized water, and then dried again at the same conditions (Fig. 1(a)). Scanning electron microscopy (SEM) analysis along with Energy Dispersive X-ray Spectrometer (EDS) analysis were performed to examine the presence of Fe on the coated sand using a scanning electron microscope (JSM 5410LV, JEOL, Japan). The SEM images and EDS patterns have been reported elsewhere.15)
Column experiments were performed at different conditions )Table 1 and 2) using a Plexiglas column (inner diameter 2.5 cm, bed depth 10 cm, bulk volume 49.1 cm3) packed with quartz sand or ICS (mass of filter media 77.2 g, bed porosity 0.407, fixed-bed volume 20.0 cm3). Stock solutions of humic acid were prepared by dissolving appropriate amounts of humic acid (Sodium salt, Tech., Aldrich Chemical, USA) in deionized water (Fig. 1(b)). Prior to the experiments, the packed column was flushed upward using a HPLC pump (Series II pump, Scientific Systems Inc., USA) with 15-20 bed volumes (BV) of leaching solution until the column effluents were clear (? 0.0 OD254) and a steady state flow condition was established. Then, humic acid solution was introduced downward to the packed column. The pH of injected humic acid solution was adjusted using 1M HCl and/or 1M NaOH. Portions of the effluent were collected using the auto collector (Retriever 500, Teledyne, USA) at a regular interval, and the concentrations of humic acid were determined at 254 nm using a UV-spectrophotometer (Helios, Thermo, USA).
The empty bed contact time (EBCT, min) can be determinedas following:
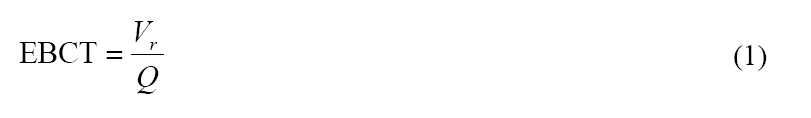
where
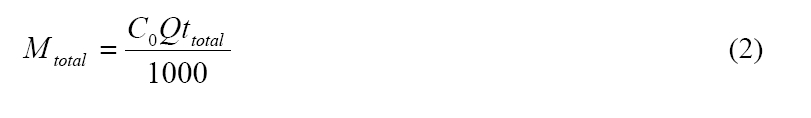
where C0 is the influent concentration of humic acid (mg/L), and ttotal is the total flow time (min). The column capacity for
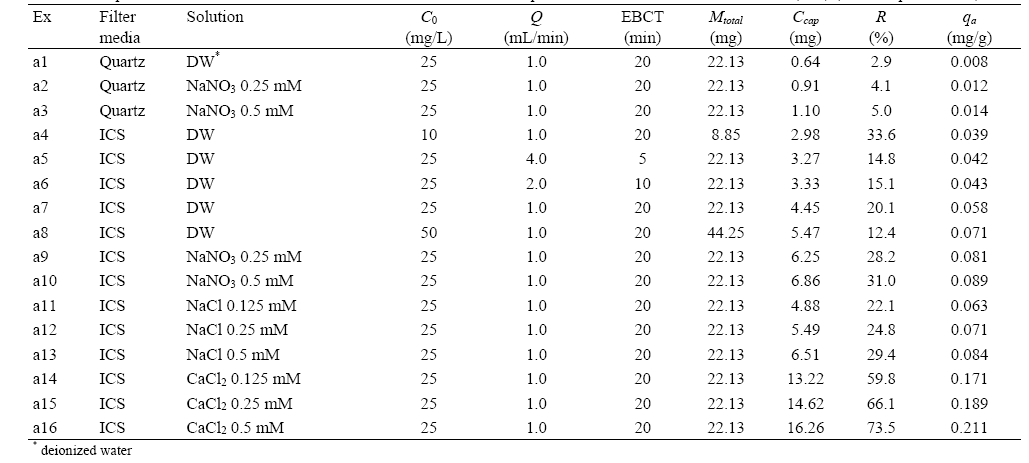
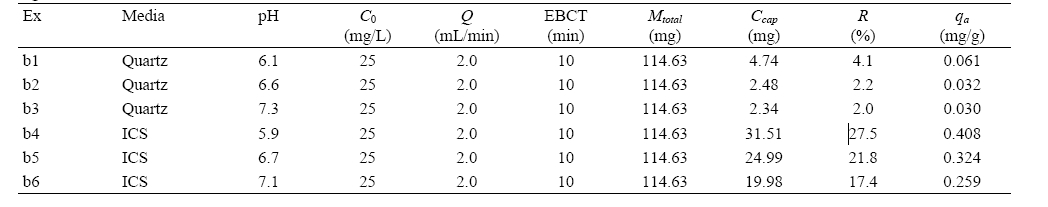
Experimental conditions and results for humic acid adhesion to quartz sand and iron oxide-coated sand (ICS) (solution pH: 7.1-7.3)

Experimental conditions and results for humic acid attachment to quartz and iron-coated sands (ICS) at different solution pHs (ionic strength = 100 mM NaNO3)
humic acid adsorption at a given flow rate and influent concentration of humic acid (Ccap, mg) can be quantified as following:
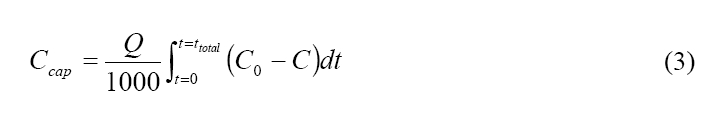
where
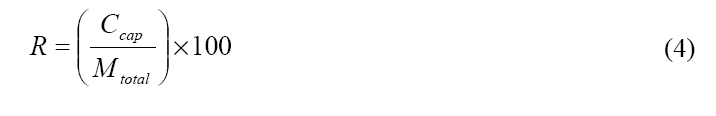
The mass of humic acid adsorbed per unit (dry) mass of filter media in the column (

where Mf is the mass of filter media in the column (g).
3.1. Humic Acid Adhesion to Iron Oxide-coated Sand
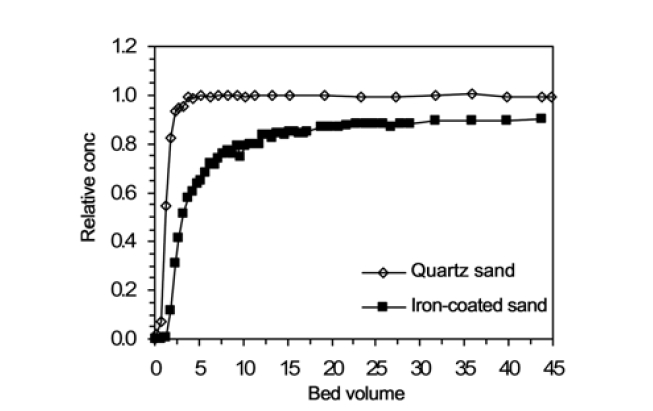
The breakthrough curves (BTCs) for humic acid adhesion to quartz sand (a1) and ICS (a7) are presented in Fig. 2. The breakthrough data is presented in terms of relative concentration (
The enhancement of humic acid adhesion through the surface charge modification of quartz sand with iron oxide coating may be explained by the point of zero charge (pHpzc) of porous media. The pHpzc is the pH where net surface charge is equal to zero. The surface charges of porous media depend on the solution
pH. The porous media carry positive charges below the pHpzc but negative charges above it. The pHpzc of quartz sand is 2.0,16) and so quartz sand is negatively charged at circumneutral pH. Humic acid is also negatively-charged at circumneutral pH due to the prevalence of carboxyl and phenol groups on their surface.8) Thus, the electrostatic interaction between quartz sand and humic acid is repulsive in our experimental condition. Meanwhile, the pHpzc of iron oxide-coated sand is around 8.0.17) Therefore, the electrostatic interaction between iron oxide-coated sand and humic acid is attractive in our condition, resulting in the enhancement of humic acid adhesion.
3.2. Effects of Humic Acid Concentration and Flow Rate
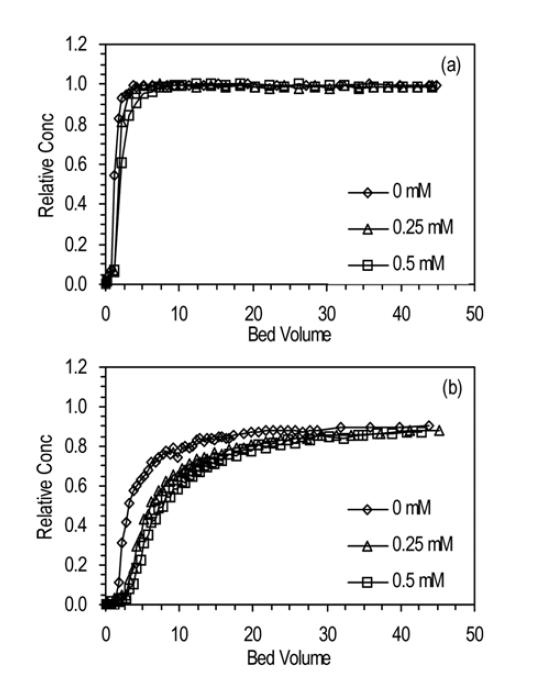
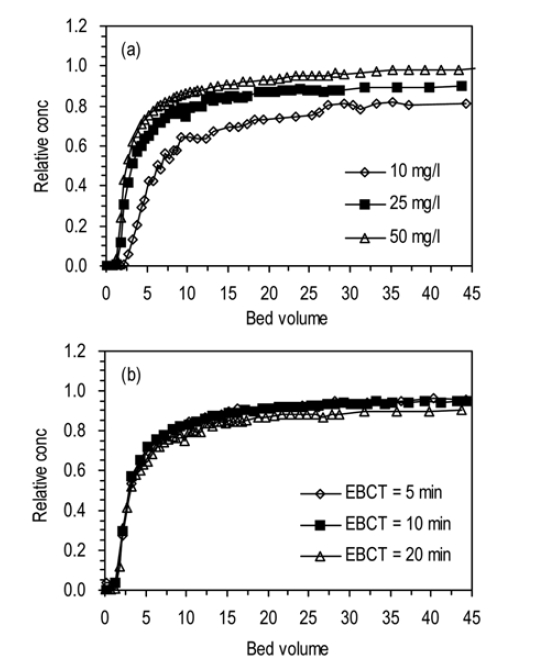
The BTCs for humic acid adhesion to ICS at different influent concentrations of humic acid (a4, a7, a8) are presented in Fig. 3(a). At the given condition (
The BTCs for humic acid adhesion to ICS at different flow rates (or EBCTs) (a5, a6, a7) are presented in Fig. 3(b). All BTCs increased rapidly up to 10 BV, followed by slow increment. The BTC was slightly lowered as the flow rate decreased from 4.0 to 1.0 mL/min (or EBCT increased from 5 to 20 min). Ccap increased with increasing EBCT. The values of Ccap were in the range from 3.27 to 4.45 mg. As the EBCT increased, R also increased from 14.8 to 20.1%. In addition,
enhancement in humic acid adhesion was observed with increasing EBCT in the experiments.
3.3. Effect of Salt Concentration
The BTCs for humic acid adhesion to quartz sand and ICS at different NaNO3 concentration are presented in Fig. 4. With increasing concentration of NaNO3, the BTC was slightly delayed and lowered. In quartz sand (a1, a2, a3), Ccap and
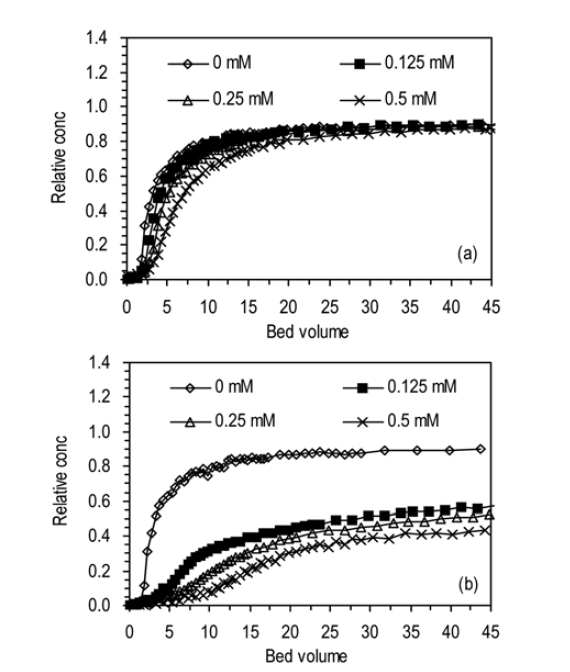
The BTCs for humic acid adhesion to ICS at different concentrations of NaCl and CaCl2 are presented in Fig. 5. In the solution of NaCl (a7, a11, a12, a13), the BTC was slightly delayed and lowered as the salt concentration increased from 0 to 0.5 mM (Fig. 5(a)). In the case of CaCl2 solution (a7, a14, a15, a16), the magnitude of impact of salt concentration on humic acid adhesion was greater than that of NaCl. With increasing concentration of CaCl2 from 0 to 0.5 mM (Fig. 5(b)), the BTC was markedly delayed and lowered. In the solution of NaCl, Ccap increased with increasing salt concentration from 0 to 0.5 mM. The values of Ccap were in the range between 4.45 and 6.51 mg. With increasing salt concentration,
to 0.084 mg/g. In the solution of CaCl2, Ccap increased from 4.45 to 16.26 mg,
The enhancement of humic acid adhesion with increasing salt concentration may be explained by the screening effect of salt ions and compact conformation of humic acid.18) With increasing salt concentration, the electrostatic repulsion between the negatively-charged humic acid particles may be screened more effectively, resulting in the enhancement of humic acid adhesion to iron oxide-coated sand.19) In addition, the conformation of humic acid may become more compact (size reduction) with increasing salt concentration, leading to enhanced adsorption of humic acid to the media.12,20) That is, a larger fraction of humic acid may adsorb to the surfaces of coated sand due to compaction of humic acid particles at higher ionic strength that at lower ionic strength where the particles are more swelled.20) Our result is consistent with the report21) which has shown with a batch experiment that the adsorbed humic acid onto goethite increased with increasing concentration of NaNO3 from 0.002 to 0.1M. Other studies19,20) have also reported the enhanced adsorption of humic acid onto goethite or iron oxide particles with increasing salt concentration. Our result also indicates that the impact of CaCl2 was greater than those of NaCl on the adhesion of humic acid. This phenomenon may be attributed to formation of bridges by a divalent ion Ca2+ between humic acid and iron oxide surface and/or complexation of functional groups of humic acid with Ca2+.18,22) Also, it may be attributed to the increased ionic strength through the addition of CaCl2 relative to NaCl. At the same molar salt concentration the ionic strength of CaCl2 is three
times larger than that of NaCl, which results in the enhancementof humic acid adhesion.
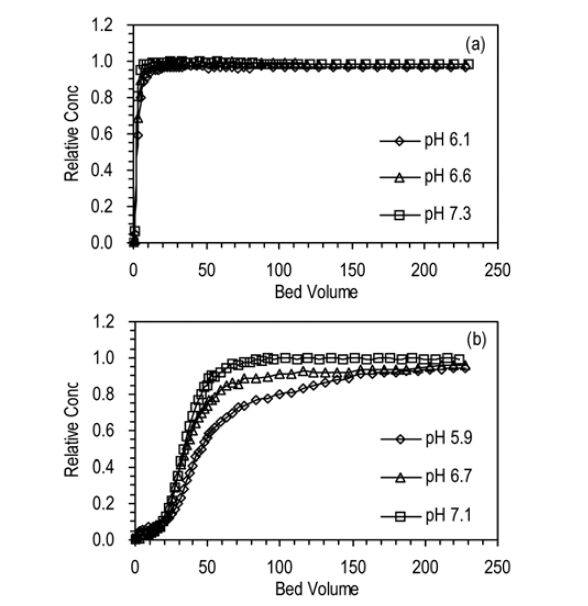
The BTCs for humic acid adhesion to quartz sand and ICS at different solution pHs are presented in Fig. 6. With increasing pH, the BTC was delayed and lowered in ICS. But, the impact of pH on the BTC was minimal in quartz sand in given experimental conditions. In quartz sand (b1, b2, b3), Ccap slightly decreased from 4.74 to 2.34 mg, R from 4.1 to 2.0%, and
Our result is consistent with the result of other researcher14) who have reported that the adsorption of humic acid onto ICS decreased from 0.31 to 0.07 mg/g with increasing pH from 2.5 to 7.5. This result can be attributed to the change of ICS surface charge. As the pH approaches to pHpzc, the strength of positive charge of ICS diminishes, resulting in the reduction of electrostatic attraction between humic acid and ICS.14)
Column experiments were performed to investigate humic acid adhesion to ICS. Results showed that humic acid adhesion was about seven times higher in ICS than in quartz sand at given experimental conditions. This indicates that humic acid removal
can be enhanced through the surface charge modification of quartz sand with iron oxide coating. The adhesion of humic acid in ICS was influenced by influent humic acid concentration. However, the influence of flow rate (or EBCT) was not eminent in our experimental conditions. The humic acid adhesion was enhanced with increasing salt concentration of solution. On the adsorption of humic acid, the impact of CaCl2 was greater than that of NaCl. Also, the humic acid adhesion to ICS decreased with increasing solution pH. This study demonstrates that humic acid concentration, salt concentration/composition and solution pH should be controlled carefully in order to improve the ICS column performance for humic acid removal from water.