In this study, total bacteria, enteric members of the γ-proteobacteria, and microbial communities in seawater were analyzed as indirect indicators for quantifying biofouling. Biomass in seawater can significantly affect feed water pretreatment and membrane biofouling of reverse osmosis desalination processes. The purpose of this paper is to investigate microbiological quantity and quality of seawater at the potential intake of a desalination plant. For this analysis, the total direct cell count (TDC) using 4'-6-diamidino-2-phenylindole (DAPI)-staining and DNA-based real-time PCR were used to quantify the total bacteria and relative content of enteric members of γ-proteobacteria in seawater, respectively. In addition, microbial communities were examined using 16S rRNA gene cloning and bacterial isolation to identify the most abundant bacteria for a further biofouling study. The experimental results of this study identified about 106 cells/mL of (total) bacteria, 105 16S rRNA gene copies/mL of enteric γ-proteobacteria, and the presence of more than 20 groups of bacteria.
The acceleration of global warming has increased the effects of climate change, and due to a concurrent growth in the world population it is becoming ever more difficult to overcome the problem of a potential global water shortage. However, one technology, seawater reverse osmosis (SWRO) desalination, has shown promise in removing salts from seawater having a salinity level of up to 45,000 ppm of total dissolved solids (TDS). Largely, this process is composed of pretreatment of the seawater intake, a reverse osmosis membrane driven by a high pressure application, and a post-treatment process.
There is a strong need to determine the biofouling potential of feed seawater in reverse osmosis desalination processes since the detailed knowledge of biological matter can lead to the development of a more cost effective feed intake and ultimately lower the occurrences of biofouling.1-3) Biofouling is a common troublesome feature of membrane systems that causes flux decline, requires frequent cleaning, and high energy, all of which ultimately shortens the lifetime of the system.4-7) Generally, biofouling from bacteria originates from seawater intake; a number of previous studies have reported that the biological matter and environmental factors of seawater have affected the pretreatment regimes of numerous desalination plants.8-10) In addition, the effects of different doses of chemicals and pretreatment designs on the reduction of bacteria in feed seawater, characteristics of marine microorganisms depending on variable environments as sources of fouling problems, and biofilm formation on materials exposed to seawater have also been studied.
To evaluate the biofouling potential in the seawater intake, the total direct cell count (TDC), adenosine triphosphate (ATP), modified fouling index (MFI), and biofilm forming rate (BFR) have generally been used.11) During this process, having steady microbiological quality and quantity in seawater is important in achieving a stable SWRO system. However, diverse bacterial communities and marine environments such as viable, biofilmforming cells and nutrients promoting growth and proliferation can severely affect the pretreatment step in the desalination process.12)
Most microorganisms exposed to a marine environment immediately respond to a variety of abiotic and biotic stresses. For instance, biotic factors such as predation by protozoa and abiotic stresses like sunlight, temperature, and salt make the persistence of many bacteria difficult. Therefore, microbial activities, microbial biomasses, or dissolved organic pools affected by abiotic and biotic components incur potential for biofouling.13) Furthermore, in cases where domestic wastes are introduced into the seawater, human pathogens and indicator microorganisms of fecal pollution could potentially enter the seawater and retain their pathogenicity even though die-offs occur. In addition, studies on the retention of potential virulence by viable but nonculturable cells have been undertaken with respect to determining the safety of seawater.14)
It should also be considered that there are many different species of bacteria present in seawater. Thus, it is important to understand the effects that bacterial groups may have on the SWRO process when designing an appropriate pretreatment. Dominant groups or specific bacteria may increase the concentration of high molecular weight organics or microbial extracellular polymeric substances.15,16)
The overall objective of this study is to investigate the microbiological quantity and quality of seawater at the intake of a desalination plant. To this end, the total bacteria, enteric number of γ-proteobacteria, and microbial communities in seawater were analyzed as indirect indicators to quantify biofouling. Next, the TDC using 4'-6-diamidino-2-phenylindole (DAPI) staining and DNA-based real-time PCR were utilized to quantify total bacteria and the relative content of enteric members of the γ-proteobacteria in seawater, respectively. Currently, less than 1% of the total bacteria in nature are known to be cultivable; since conventional culture methods significantly underestimate the actual bacterial count, DAPI staining and real-time polymerase chain reaction (PCR) satisfy the criteria of accuracy and speed in assessing the microbiological quantity of seawater. DAPI is known to form fluorescent complexes with natural double-stranded DNA, showing fluorescence specificity for AT, AU, and IC clusters, and real-time PCR quantifies the initial amount of the template gene in a highly specific, sensitive, reproducible and rapid manner based on the detection and quantification of a fluorescent reporter.17-19) Finally, microbial communities were examined using 16S rRNA gene cloning and bacterial isolation to identify the most abundant bacteria for a further biofouling study. Here, 16S rRNA gene cloning and sequencing is useful for examining microbial diversity and ecology in the environment due to its taxonomic specificity.
2.1. Sample Collection and DNA Extraction
Seawater samples for this study were taken from one site in an area of Korea. Immediately, 100 mL of the sample was passed through a cellulose acetate membrane (pore size, 0.45 μm; diameter, 47 mm) and concentrated for DNA extraction.
Genomic DNA was then extracted from the filter membrane using a phenol/chloroform extraction and an ethanol precipitation method.20) The extracted DNA was subsequently quantified using a spectrophotometer (Ultraspec 3100 pro, Amersham Pharmacia Biotech, Sweden) at 260 nm. The effects of the DNA concentration on PCR performance was determined by diluting the extracted DNA (from 10.7 to 171.2 ng) before PCR amplification.
2.2. Quantification of Total Bacteria in Seawater
For DAPI staining, 10 mL of the seawater sample was filtered using a black polycarbonate membrane with a 25 mm diameter, and the membrane was then placed on a glass slide. Next, 100 μL of DAPI solution (10μL of 1 mg/mL solution and 90 μL distilled water at 0.1 mg/mL) was added to the membrane. After 5 min incubation at RT, the membrane was washed three times with distilled water and observation of the DAPI-stained sample was undertaken using a confocal laser scanning microscope (LSM5, Zeiss, Germany). Ten images of the same size were randomly taken using Pascal software and subsequently analyzed using I-solution software to calculate the number of bacterial cells.
Real-time PCR on triplicate samples was carried out and then analyzed using a Rotor-Gene 6000 system (Corbett Research, USA) with SYBR Green, a fluorescent double-stranded DNA (dsDNA)-intercalating dye. Two primers, corresponding to positions 8-28 (F1, 5’-GAG TTT GAT CAT GGC TCA-3’) and positions 519-536 (R1, 5’-GTA TTA CCG CGG CTG CTG-3’) of the
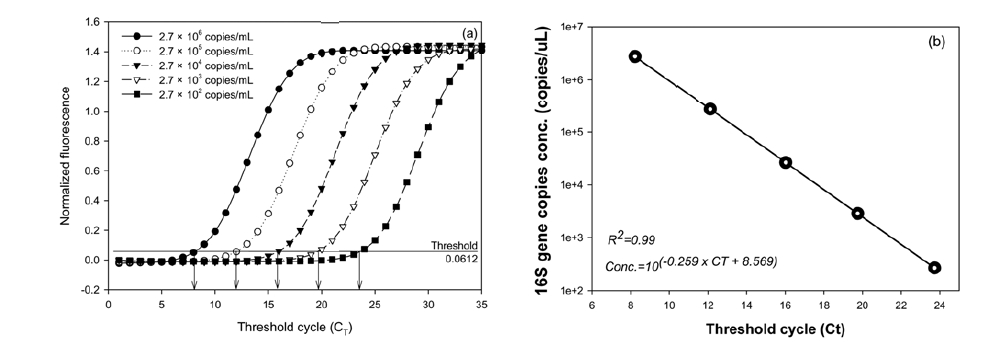
As a result, each 20-μL reaction mixture contained 10 pmole of each primer, 10 ng of the template DNA extracted from seawater, and 10 μL of the SYBR Green PCR master mix (Quanti Tech SYBR Green PCR kit, QIAGEN, France). Next, the thermal cycling reactions consisted of an initial denaturation/ enzyme activation step (94℃, 15 min) followed by 40 cycles of denaturation (94℃, 30 sec), primer annealing (55℃, 30 sec), and extension (72℃, 30 sec). For each cycle, fluorescence was recorded for the final 5 sec at 72℃. To determine the specificities of the amplified products affected by nonspecific amplification and/or primer dimmer formation a melting-point analysis was carried out after completion of the amplification; slow heating at 1℃ per step from 72 to 95℃ while continuously acquiring fluorescence data during the 5-sec hold per step. A standard curve for the real-time PCR assay was created by serially diluting the standard plasmids [
2.4. 16S rRNA Gene Cloning and Sequencing for Phylogenetic Analysis
A universal bacterial primer set, forward primer 9F (5’-GAG TTT GAT CCT GGC TCA G-3’) and reverse primer 1512R (5’-ACG GHT ACC TTG TTA CGA CTT-3’),18) was used to amplify the 16S rRNA gene from the genomic DNA extracted from the seawater sample. The 20-μL PCR mixture included a PCR premix (AccuPowerTM PCR premix kit, K-2010, Bioneer, Korea), 20 pmole of each primer, and 10 ng of the template DNA. Sterile distilled water was then added to the mixture, for a final volume of 20 μL. The thermocycling conditions included an initial denaturation step at 94℃ for 10 min followed by 30 cycles at 94℃ for 30 sec, 55℃ for 30 sec, and 72℃ for 30 sec with a final extension step at 72℃ for 5 min. Aliquots (2 μL) of the total reaction volume were analyzed by gel electrophoresis with 1% (wt/vol) agarose in a TAE buffer and stained with ethidium bromide (0.5 mg/L). Bands were then visualized using a UV illuminator. Next, the PCR products were purified to the manufacturer’s guidelines using an AccuPrepTM PCR purification kit (Bioneer, Korea). These purified products were then cloned using the pGEM®-T Easy vector cloning kit (RC001, RBC Bioscience, Taiwan) to standard manufacturer protocols. After that, transformation was carried out using high-efficiency competent cells (
2.5. Bacteria Isolation from Seawater
Each 20-μL diluted seawater sample was spread on individual marine agar dishes, which were then were incubated at 37℃ for 24 hrs or more until colonies appeared. Based on the colony morphology, each colony was selected and transferred to a new medium dish, and the DNA of each fresh colony was extracted for PCR. Then, PCR using a universal bacterial primer set, purification of the PCR product, and its sequencing were carried out as mentioned above.
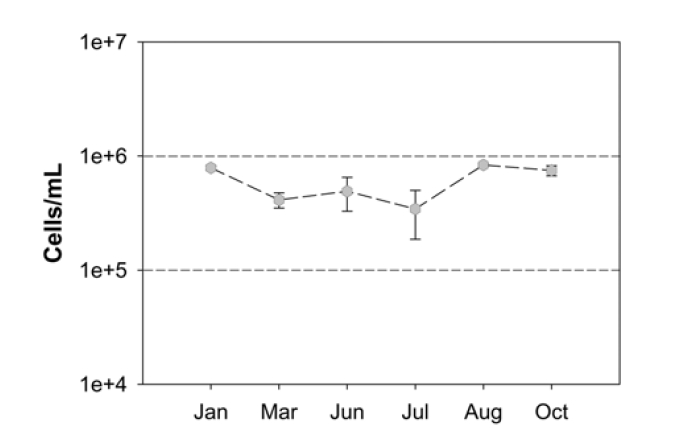
3.1. Enumeration of Total Bacteria
Fig. 1 shows the TDC of the seawater samples from January 2008 to October 2008, where the cell densities averaged 6.03 × 10⁵ cells per 1 mL of seawater. The highest average was 8.35 × 10⁵ cells/mL and the lowest was 4.12 × 10⁵ cells/mL. It should be noted that the cell densities in the collected samples were not relatively high based on other studies; for example, bacterial cells in the northern Gulf of Mexico ranged from 0.4 × 10⁶ cells/ mL offshore to 1.0 × 10⁶ cells/mL inshore.24) In addition, no clear link between monthly variation and bacterial cell densities was observed, suggesting that the total bacteria in the seawater we sampled as the potential intake of a desalination plant does not have a significant level of biomass.
3.2. Standard Curve and Performance of Real-time PCR Assay
Fig. 2 shows the results of the real-time PCR assay of the 10- fold serial dilutions when the plasmids (from 2.72 × 10² to 2.72 × 10⁶ copies) containing the
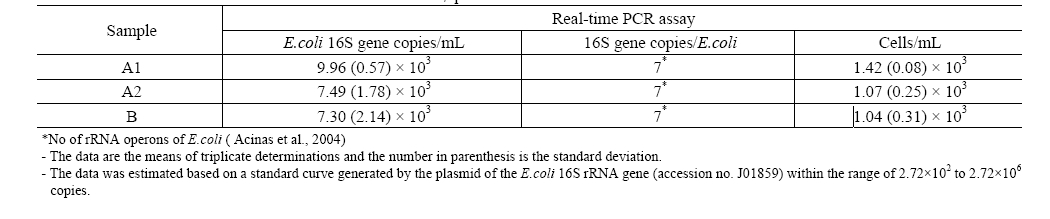
3.3. Relative Quantification of Enteric Members and Relatives by Real-time PCR
Quantitative results of the enteric members of γ-proteobacteria
and related bacteria determined by the real-time PCR assays are shown in Table 1. Randomly, three seawater samples were taken at different sites and time; A1 and A2 indicate samples taken from the same site but at different times. The results of each assay varied slightly, as the concentrations of the 16S rRNA genes extracted by a real-time PCR assay using
3.4. Analysis of Microbial Community Based on 16S rRNA Genes and Bacteria Isolation
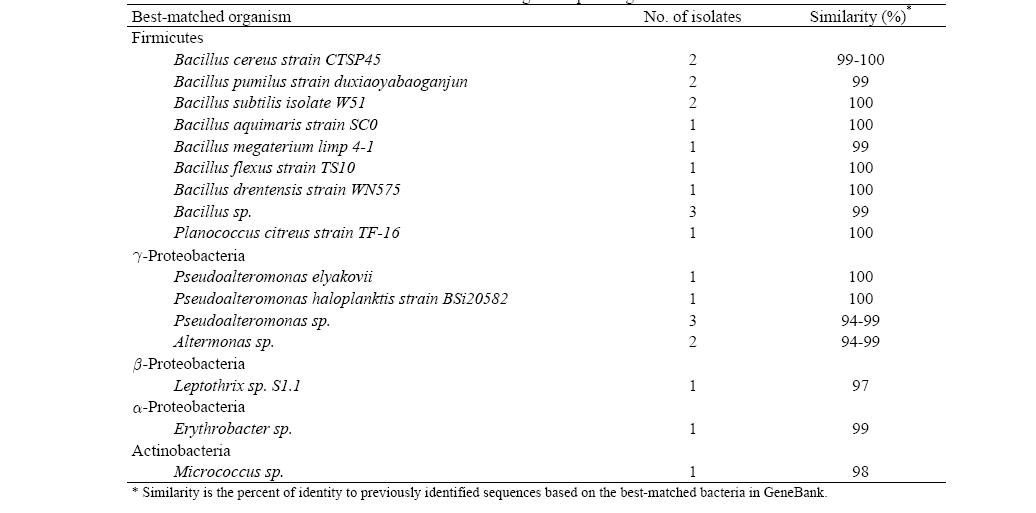
More than 20 different colonies were obtained from the experimental results of bacteria isolation (Table 2). Traditional techniques for identifying bacteria based on phenotypic characteristics are generally not as accurate as identification based on genotypic methods; thus, a comparison of the bacterial 16S rRNA gene sequence has emerged as the preferred genetic technique to identify bacteria. From the results of the 16S rRNA gene sequencing of each colony, the closest strains to
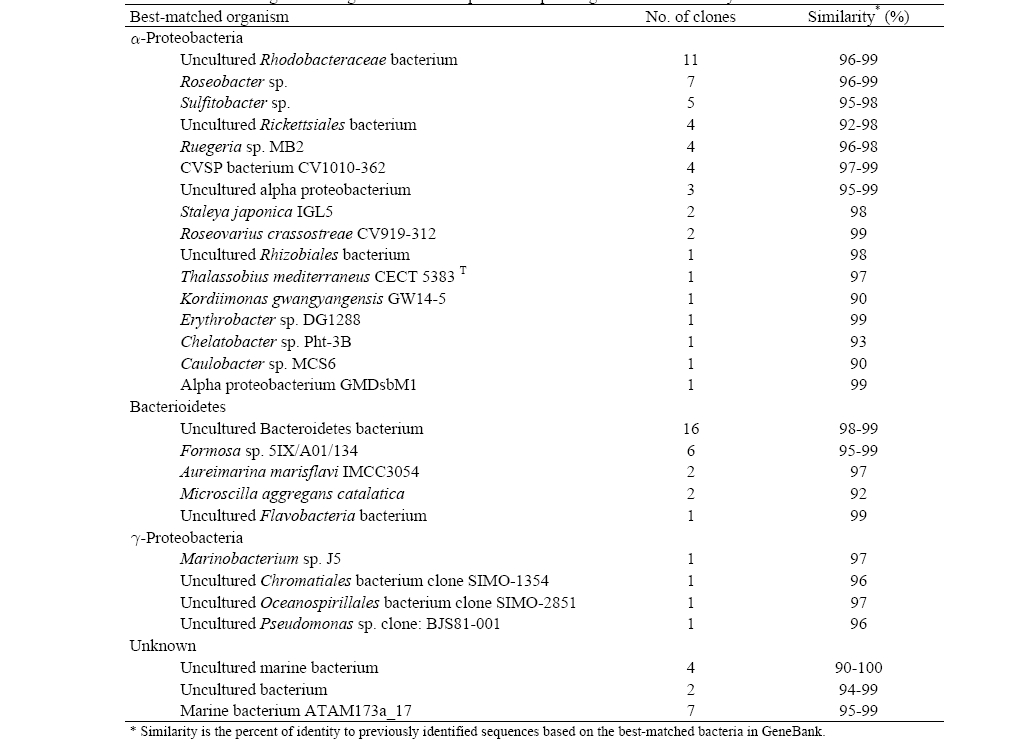
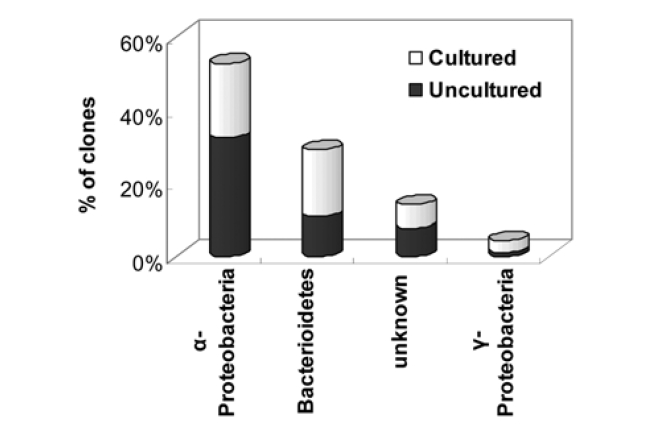
Table 3 shows the high phylogenetic diversity in the seawater sample as a total of 93 partial 16S rRNA gene sequences were identified during a comparison to a GeneBank database using a BLAST search. The BLAST analysis of the sequences indicated that the screened clones were highly similar (mean = 96%) to the target clones. Division level bacterial diversity in the seawater sample was then estimated by dividing the number of clones representing each division by the total number of clones and most of the microbial diversity shown here came from a particular genus of proteobacteria found in seawater (Fig. 3). The most abundant sequences in the seawater clone libraries were α-proteobacteria (53%) and a large fraction of the α-proteobacteria was uncultured
[Table 2] Bacteria isolation from seawater and 16S rRNA gene sequencing

Bacteria isolation from seawater and 16S rRNA gene sequencing
[Table 3] 16S rRNA gene cloning of seawater sample and sequencing results identified by BLAST

16S rRNA gene cloning of seawater sample and sequencing results identified by BLAST
Interestingly, clones related to pathogens such as Rickettsiales and
It should be noted that the predominant populations or presence of specific strains in the intake sample were not sufficient to reflect the entire microbial diversity and complexes of the seawater since only a small fraction (< 10%) of the total extracted DNA from 100 mL of seawater was used as PCR templates for 16S rRNA cloning. However, this study suggests that the interactions between a complex microbial biomass and complicated organic matter are dynamic in the marine environment. Accordingly, we should make efforts to narrow the microbial range through repetitive experiments and statistical approaches in order to monitor core specific strains within the limits of potential biofouling.
Seawater reverse osmosis (SWRO) desalination is becoming one of the more promising technologies for overcoming water resources stress. Using SWRO, there is a critical need to determine the biofouling potential of feed seawater since detailed knowledge of biological matters in seawater can lead to the development of a more cost effective feed intake, and ultimately less biofouling. Generally, biofouling from bacteria originates from the seawater intake. Trends in previous studies have been focused on the measurement of biomass accumulation to quantify biofouling; however, the effects of specific microbial compositions on biofouling have yet to be clearly established. Thus, the objective of this study was to investigate microbiological quantity and quality in seawater at the potential intake of a desalination plant. Experimental results revealed about 106 cells/mL of total bacteria, 103 cells/mL of enteric members of γ-proteobacteria, and isolated more than 25 groups of bacteria. There were dominant bacteria, such as