Since the pioneering research that involved estimating the sediment transport rate for predicting the life span of a dam in a river, various rating curves have been used to estimate pollutant release from a watershed.1,2) The reason we need an empirical relationship is because most of the rivers have not been gauged or stream flow and suspended sediment flux data for these rivers is not readily available. Vogel et al.3) reported that the amount of pollutant constituents including sediments from river flows depends on the form of the relationship between the effective river discharge and the pollutant flux as well as on the form of the frequency distribution of the river discharges based on over 300 journal articles. Cooper et al.4) examined how opportunistic sampling in addition to weekly sampling of dissolved organic matter affected regression and ratio based on estimates of loading. Furthermore, Christiansen et al.5) used a real time water quality monitoring and regression model to estimate the constituent concentration, loads, and yields in the Little Arkansas River in South Central Kansas. The study revealed that these indicators yielded errors greater than 25 percent. However, many of these studies have been carried out either in watersheds in terms of sustainable urbanized effects on surface water quality6-9) or on land use effects with an emphasis on the observation of stream flow.1012) Furthermore, the study of a large scale (>100 km2) and non-impacted watershed for controlling a Non Point Source (NPS) has seldom been analyzed,13) despite the longterm studies carried out in these fields. The process of determining the daily pollutants load that runs into a lake is both challenging and complex. Many lakes receive a high portion of their pollutant loading from non-point sources, which are highly variable and are difficult to quantify. Lakes manifest pollutant loading on a seasonal scale, not on a daily basis. The loading during the winter months may have little effect on summer algal densities. While non-point pollutant loads tend to flow out with extreme rainfall, forming a watershed, little information is available on how to control the flow effectively.
In this study, field monitoring in undisturbed watersheds are examined and an evaluation is performed of the characteristics of specific pollutant release generating flow discharge by using the hydrological modeling approach. The study consists of two stages. In the first stage, the hydrological processes for stream discharge were estimated by comparing the observed data. The second stage of this work was presented with a model validation to estimate the specific pollutant release based on the calculated flow discharge during the rainy season. Originally, this study was designed on the basis of the long-term rainfall phenomenon over 30 years in the two non-impacted watersheds of SoyangLake.
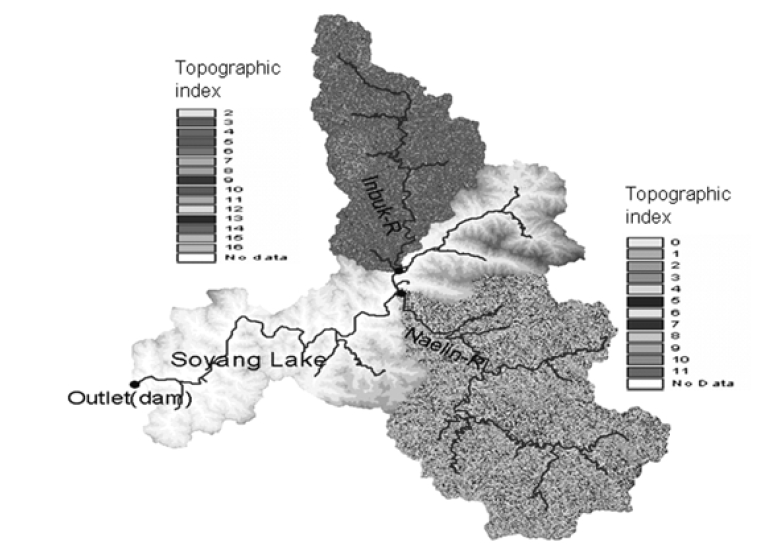
The Soyang reservoir is an artificial dam located about 100 km to the east of Seoul. The reservoir is the deepest and largest reservoir in Korea; it was constructed on the North Han River in 1973 for flood control of down stream areas and water supply for Chunchon city including metropolitan cities. The hydraulic retention time is the longest (0.7 year) in Korea because the outflow rate is small, considering the reservoir’s large volume (Table 1). The water depth varies from about 110 m on the outer part of the Dam to 30 m on the inner part and about 42 m on average. The Watershed of Soyang Lake has two main subwatersheds: the Inbuk River (578 km2 watershed area), of which part of the watershed is included in the north Kangwon province, Democratic People’s Republic of Korea (North Korea), and the Naelin River (1,075 km2 watershed area). The elevations above sea level ranged from 215 m to 1,348 m for the Inbuk River watershed and from 201 m to 1,567 m for the Naelin River watershed, which rapidly changed to steep slopes.
[Table 1] Hydrological characteristics and land use in watershed of Soyang reservoir
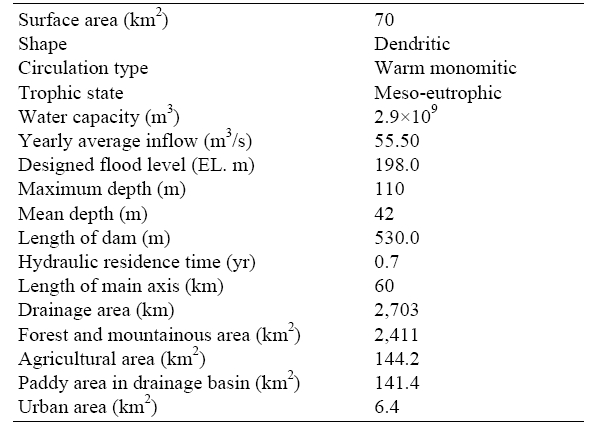
Hydrological characteristics and land use in watershed of Soyang reservoir
The two watersheds consist of over 60% of the total watershed area. The water quality conditions in the lake maintain an oligotrophic to mesotrophic state. The water blooms with cyanobacteria, mainly Anabaena spp., which has also been annually reported in some tributaries of the lake.14,15)
Data obtained during the rainy season over the past 2 years, from 2004 to 2005, for a rating curve with a long term water quality were analyzed when available. The annual mean precipitations of the Inbuk River watershed and the Naelin River watershed were 1,083 and 1,118 mm, respectively, and over 80% of the annual mean rainfalls in the two main watersheds of the Soyang River were concentrated in heavy showers that occurred several times during the rainy season from May to September. This rainfall phenomenon results in a deposit of pollutive components during dry seasons.
The higher rainfall that occurs from May to September will mobilize the build-up of contaminants, creating a larger discharge. The basic water quality parameters such as Biochemical Oxygen Demand (BOD), Chemical Oxygen Demand (COD), SS, Total Nitrogen (T-N), and Total Phosphorus (T-P) were chosen for the derivation of the flux rating curve, because they are major indicators for the estimation of organic, turbid, and nutritive conditions, respectively. The samplings in the two watersheds are concentrated in single rainfall events, because the samples in the period tend to be sufficient to characterize the seasonal pollutant load. A limited number of samples are also monitored during low discharge periods to allow the pollutant load with a baseflow. This method assumes that river flows vary significantly and that concentrations increase with flow during storm runoff events. Based on the observed data, experimental relations such as the pollutant regression curve are applied. The most commonly used basic pollutant rating curve is the power function:16)
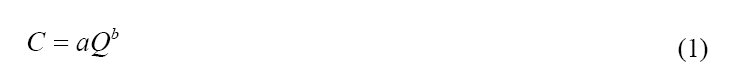
where C is the concentration (mg/L), Q is the discharge (m3/s), and
An important issue for the water resource manager is the determination of a specific pollution flux on a daily basis. If continuous concentration and flow measurements could be made for the entire study period, the mass flux could be estimated by multiplying by the appropriate unit conversion. For these comparisons, load (kg/day)
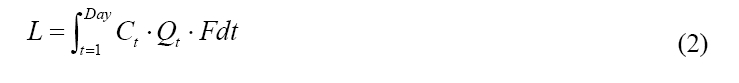
where
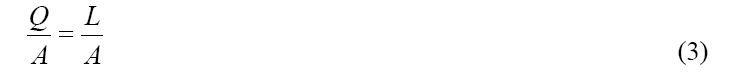
In Eq. (3),
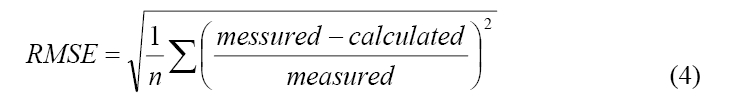
where n: the number of observations.
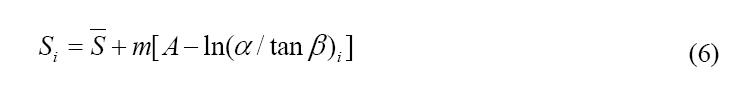
In an ungauged watershed, the first step for estimating NPS is to generate stream discharge. The TOPMODEL selected for this study is a rainfall-runoff model in which distributed predictions of watershed responses are made based on the hydrological similarity of any point in a watershed. TOPMODEL is a topographically based hydrological model which reproduces the hydrological behavior of watersheds in a semi-distributed way.17-19) Since a detailed explanation of TOPMODEL has been reported elsewhere, only a brief description will be provided as follows: The simplicity of TOPMODEL is in the topographic index, the ln(α/ tanβ) index, as an index of hydrological similarity derived from the digital elevation models as shown in Fig. 1, where α is the cumulative drainage though a point, and the hydraulic gradient of the saturated zone can be approximated by the local surface topographic slope, tanβ,
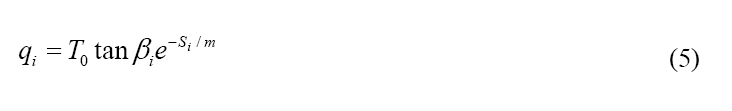
where T0 represents the local value of the saturated transmissi-
vity of the soil. βi is the slope angle,
where
The vertical drainage
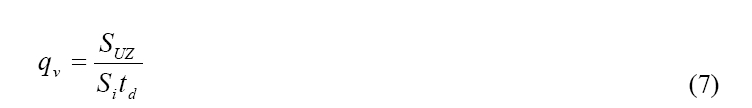
Where
where
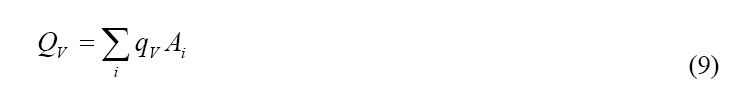
The output from the saturated store is represented by the baseflow term,
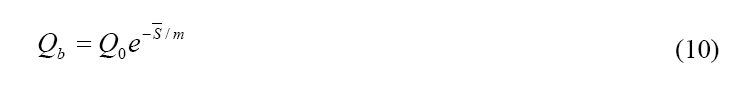
where
The single event rainfall amount for two watersheds ranged from 24 mm to 198 mm. The fitted relationships between specific discharge and pollutant flux releases using Eq. 3 are summarized in Table 2. Most of the regressions for the two watersheds during the rainy season that are given in Table 2 have positive values. This may be due to the discharge through the wash off process in which rainfall results in pollutant deposition during the light rainy season from January to May or October to December. In certain cases, the regression values were high during the consistently short sampling period term in the cases of the 2nd and 3rd rainfall events or the same monthly data in the cases of the 3rd and 4th rainfall events in the Inbuk River watershed.20) It has been reported in a number of studies that runoff quality during the initial storm of the season has higher pollutant concentrations than in later rainfall events. Lee et al.21) defined this phenomenon as seasonal first flush. Also, their study reported that peak pollutant concentrations tend to precede peak runoff flow rates and thus result in the runoff of a greater pollutant release during early storm stages. However, in this study, a seasonal first flush phenomenon of specific pollutant fluxes in two watersheds did not occur for selected indicators. This phenomenon of pollutant release is important in the management of the pollutant load from the diffused watershed. As a higher pollutant mass load is delivered during the rainy season, controlling the entire pollutant load during the rainy season will be more effective than trying to treat the pollutant mass of all storms throughout the season. Because the months of July and August usually have the greatest rainfall, the bulk of the discharge in the two river watersheds is expected to occur during the rainy season. Conversely, the long dry period from April or May to October allows contaminants to build up in these areas.
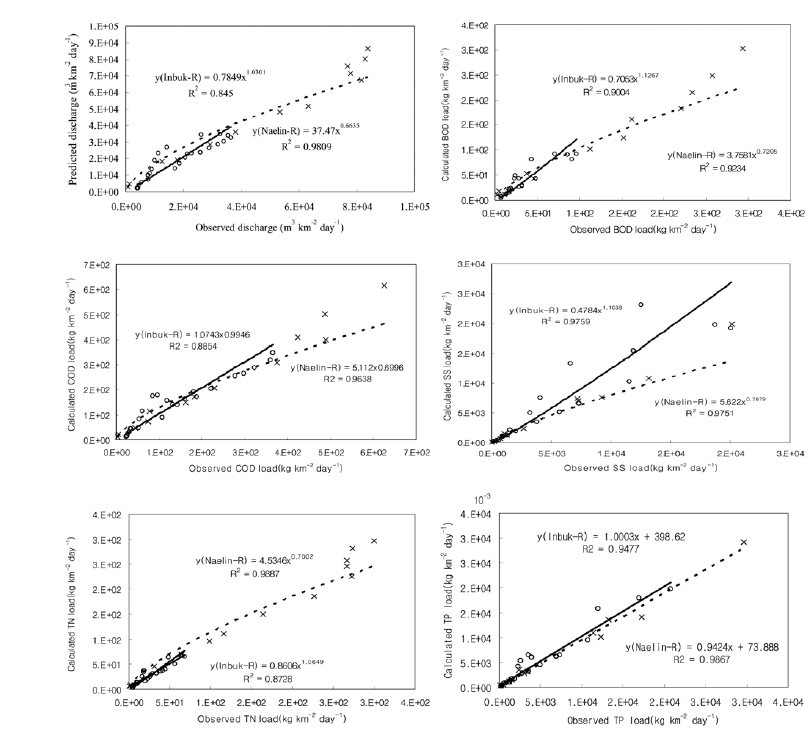
The watershed-scale hydrological model for pollutant flux release could assist environmental managers to focus their limited discharge data set. In order to estimate and validate pollutant load flux release, two single rainfall events were selected for the Inbuk River and the Naelin River respectively. Fig. 2 illustrates the observed pollutant flux using Eq. (3) versus the calculated pollutant flux from the predicted discharge using distributed TOPMODEL in two rivers and demonstrates the close relationship of over 80% of all the selected parameters. This modeling approach allows seasonal pollutant fluxes to be produced effectively, when the discharges in the insufficient rating curve areas are generated well. Fentie et al.22) reported that the relative differences between total suspended sediment loads using rating curves varied depending on the scale of the watershed areas. However, further data sets are required to confirm the significant relationship between them. The magnitude of RMSE values depends on the variances between a true discharge and pollutant fluxes distribution. The values of five indicators including discharge were 0.14 for the Inbuk River and 1.58 for the Naelin River, which implies lower RMSEs. The calculated results indicate that the pollutant releases that control discharge at the large scale non-urbanized forest area are well captured by the hydrological-link model. This approach can also simulate the trend as well as the variability in the daily or monthly pollutant release at any point of outlet of the two watersheds during the rainy season.
The rainfall phenomenon is an important factor in the control of pollutant load from diffuse areas. The procedure demonstrated in this study is a frame approach for simulating specific pollutant flux releases in two forested watersheds where detailed river flow data is not available during the rainy season. Extensive water sampling data in two forested watersheds was collected to derive specific pollutant flux regression curves during various rainfall events. For simulating a specific pollutant release, a conceptual model was applied in the large forested watersheds. The results of this study indicate that the relationship between discharge and specific pollutant load have a high regression coefficient. The flows during the rainy season provide most of the pollutant fluxes in this study, providing evidence of the important link between discharge and pollutant load. The five pollutant load rating curves for this study were developed using continuous sampling data during the heavy rainfall season. The simulation results indicate that the proposed approach can be used to predict both the discharge and pollutant release from the forested watershed, while the values of RMSE’s are 0.14 for the Inbuk River watershed and 1.58 for the Naelin River watershed, respectively. This approach allows the estimation of other pollutive indicators following the same procedure. Concerning the treatment of pollutant loads from diffused watersheds, there is no agreement about at which level the contaminated waters should be removed. This result, considering the long term rainfall phenomenon, suggests that treating pollutant fluxes from a
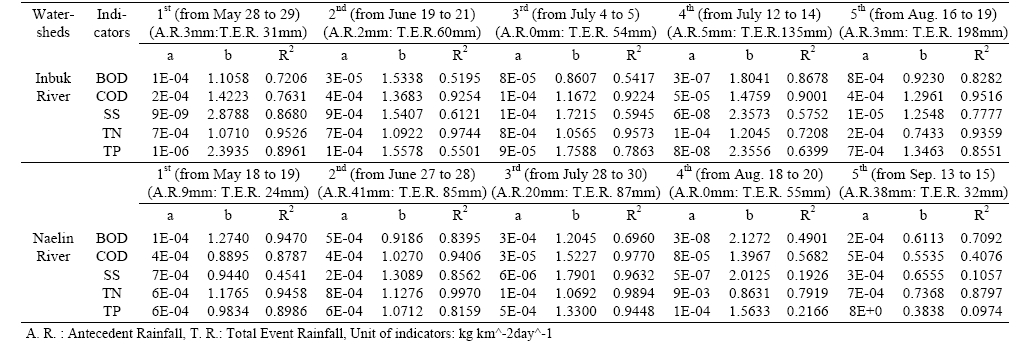
Correlation coefficients with pollutant rating coefficient a and exponent b for indicators in Inbuk River, 2004 and Naelin River, 2005
watershed during the rainy season may be more effective than treating a randomly released load during the dry season. Though further modeling testing based on other field data is needed, the results shown above will be helpful for controlling the pollutant flux release from forested watersheds during the rainy season.