This study was performed to examine the anticancer effect of mountain ginsengPharmacopuncture(MGP) to the nude mouse of lung carcinoma induced by NCI-H460 human nonsmalllung cancer cells.
Human lung cancer (NCI-H460) cells were cultured and applied to evaluate anti-tumoractivity in nude mice. After confirmed tumor growth in mice, MGP was treated per 0.1ml/kg dose tointraperitoneal and intravenous injection everyday for four weeks. And checked the changes in bodyweights, tumor volume, mean survival time and percent, increase in life span, histo-pathological findings,organ weights, and blood chemistry levels.
The results of in vivo study showed that MGP may have potential as growth inhibitor of solid tumor induced NCI-H460 without marked side effects. MGP inhibited dosage-dependently the growth of NCI-H460 cell-transplanted solid tumor compared with the control group. And mean survival time of MGP treated group was prolonged comparing with control group. Generally the group of intravenous injection is more effective than intraperitoneal injection.
These results were suggested that MGP may be a useful anticancer agent for therapy of human lung cancer. And follow study need for the certain evidence.
Ginseng,
The regulation of apoptosis, which is a programm ed cell death, has become an area of extensive study in cancer research and has been considered an ideal way of eliminating precancerous and/or cancerous cells[3, 4]. Most cancer cells can block apoptosis, which allows them to survive despite the genetic and morphologic transformations. Therefore, the induction of apoptotic cell death is an important mechanism in many anti-cancer drugs[5].
In previous study, I confirmed the apoptotic effects of mountain ginseng Pharmacopuncture( MGP) on lung cancer cells [6].
Ginseng is widely accepted in both Korea and China that mountain ginseng is more active than cultivated ginseng in chemo-prevention[7]. And I reported the safety and anti-cancer effects of MGP in pre-studies[8-14].
Now I attempts to elucidate the effect of MGP inhuman lung carcinoma cells and the underlyingintra-cellular signal transform pathways involved inregulating apoptosis. And also evaluated the antitumoractivity of MGP for NCI-H460 human lungcarcinoma cells
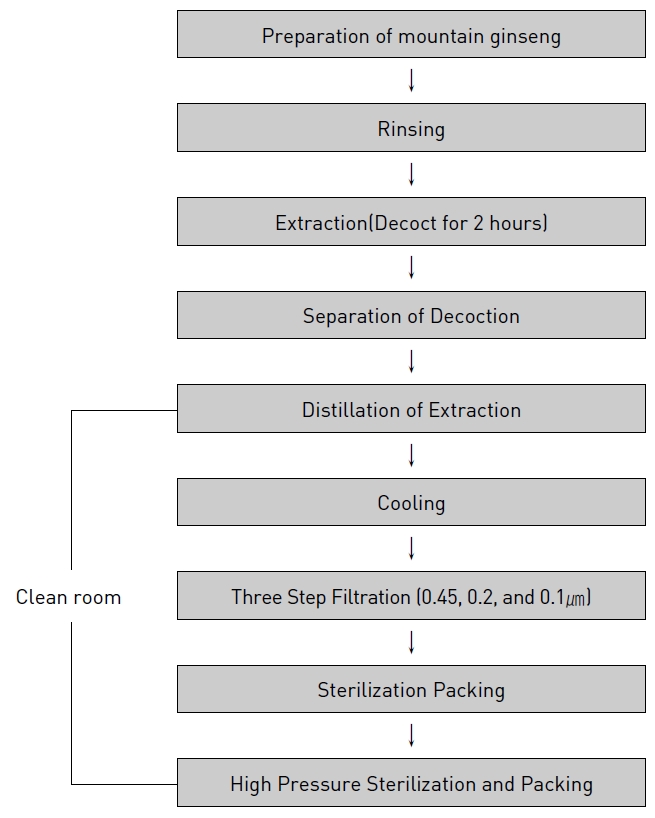
2-1 Manufacturing process of MGP
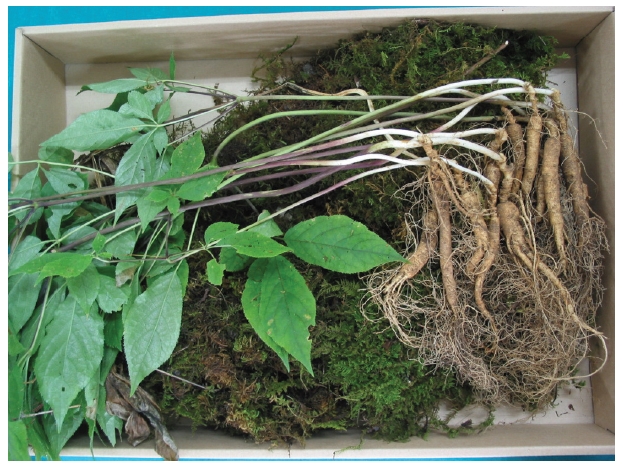
Cultivated mountain ginsengs for MGP were estimated about 8-10 years old and manufactured under the following process: Cultivated mountain ginseng is rinsed in a running water(Fig. 1)and then decocted for 2 hours in distilled water. Remnants are then removed and decoction went through distillation before yielding the desired herbal acupuncture. Then the Pharmacopuncture was filtered using 0.45 ㎛, 0.2㎛ and 0.1㎛ filtering paper and then kept in the container. Finally, Pharmacopuncture is sterilized before being used(Fig. 2).
2-2. Cell line and culture conditions
Human lung cancer (NCI-H460) cells were fromthe Korean Cell Line Bank (Seoul, Korea). Thecells were grown in the RPMI-1640 medium supplementedwith 10% fetal bovine serum, 100U/mlpenicillin and 100mg/ml streptomycin.
Balb/c nude mice (male, 9-11 weeks, n=25) weighting 21-25g were purchased from Japan SLC, Inc(SLC Inc., Shizuoka, Japan) and were housed underspecific pathogen-free conditions according to theguidelines of Chungbuk National UniversityAnimal Care and Use Committee.
The animal room was controlled for temperature (22±2℃), light (12 hr light/dark cycle) and humidity (50±10%). All laboratory feed pellets and beddings were autoclaved.
The tumor regression model on nude mouse has been successfully applied to evaluate anti-tumor activity on common. So the model was used to evaluate suppression of solid tumor on MGP. When the tumor volume reached 100mm3, the nude mice, xenografted tumor fragment were randomly distributed into three groups (positive control group, MGP 0.1ml with intraperitoneally treated group, and MGP 0.1ml with intravenous injection treated group; injected dose(0.1ml) was selected by clinical use), and each group was consist of seven mice. MGP was intraperitoneally, intravenous injected everyday for four weeks.
NCI-H460 cell were cultured in 260ml tissue culture flasks in Eagle;s minimum essential medium (EMEM) containing 100U/ml penicillin and 10% heat inactivated fetal calf serum in an incubator with 95% air and 5% CO2 at 37℃. When the cells became confluent, they were washed twice with Hank;s balanced salt solution (HBSS), trypsinized with 0.25% trypsin in HBSS, washed twice with fresh culture medium[15].
NCI-H460 cells were washed twice with Hank;sbalanced salt solution (HBSS), trypsinized with0.25% trypsin, and washed twice with fresh culturemedium. NCI-H460 cells, 1x10⁶cells/mouse in 0.1ml HBSS, were injected subcutaneously into theflank of mice using a 26 gauge needle. After 14-16day observation, apparent solid tumor mass wasremoved from 3 mice out of 5 mice inoculated withNCI-H460 cells. Tumor fragments (3x3x3mm)were made by trimming with a knife, and xenograftedinto the flank of new mice using a troca. Thesuppressive effect of anticancer agents on solidtumor was evaluated in a tumor-regression model.In brief, from the day tumor volume reached 100mm3, the mice xenografted with a tumor fragmentwere administrated intra-peritoneal and intravenousinjection with MGP every day for 28 days.
The changes in the size of tumor mass were recorded twice a week by measuring with a digital calipers. That is, the largest and smallest diameters were measured in each mouse, and the tumor volume was estimated according to the formula[16, 17].
V(mean tumor volume) = (A*B2)/2 (A=the largest diameter, B=smallest diameter)
; where V is the tumor volume in mm3, and A and B are the largest and smallest tumor diameters inmm, respectively. Based on the regression of tumorvolume, the antitumor activities of treatment wereexpressed by inhibition rate.
IR(inhibition rate)(%) = [(CV-TV)/TV] x 100
(CV=Control group tumor volume, TV=Treatmentgroup tumor volume) where CV and TV aretumor volumes in control (water) and treatmentgroups, respectively. Also, the tumor weights weremeasured on the final day after sacrifice of animalsand removal of the tumor mass.
2-8. Mean survival time and percent increase in life span
To compare the life span of mice xenograftedwith NCI-H460 tumor fragments, survival time wasestimated from the day when the tumor volumereached 1,500mm3 as described previously, and %increase in life span (%ILS) were calculatedaccording to the equation:
%ILS(increase in life span) = [(T-C)/C] × 100,
where C and T are mean survival days of mice in control and treatment groups, respectively[16, 17].
Blood samples were centrifuged at 1,400×g at 4 ℃ for 10min. The supernatants (serum) were used for the determination of aspartate aminotransferase (AST), alanine aminotransferase (ALT), with an automatic anayzer(7170, Hitachi, Tokyo, Japan).
The results are presented as mean±S.D., and the significance of difference between the mean of control and treatment groups was analyzed using oneway analysis of variance (ANOVA) followed by a Dunnett;s t-test correction, paired t-test, and linearregression analysis. Statistical significance wasdetermined at the level of p<0.05 or p<0.01 (SPSSVersion 10.0).
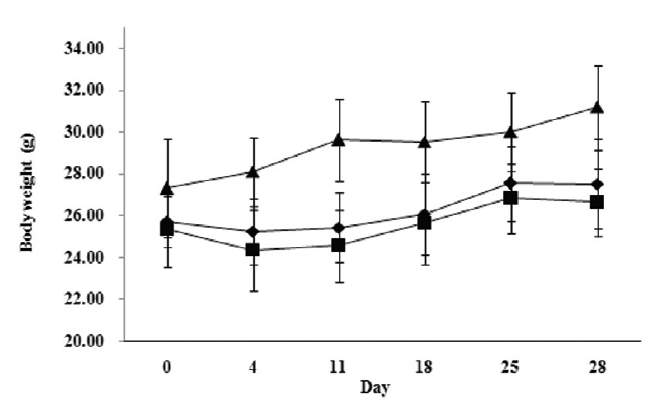
Changes in body weights of each group were shown in Fig. 3. The mean body weights of MGP treated group were mild increased than those NCIH460 cell only group (25.33-26.64g), with value of 25.70-27.50g in intraperitoneally treated and 27.30- 31.18g in intravenous injection treated group. But no significant differences were observed(MGP treated groups and positive control group) (Fig. 3).
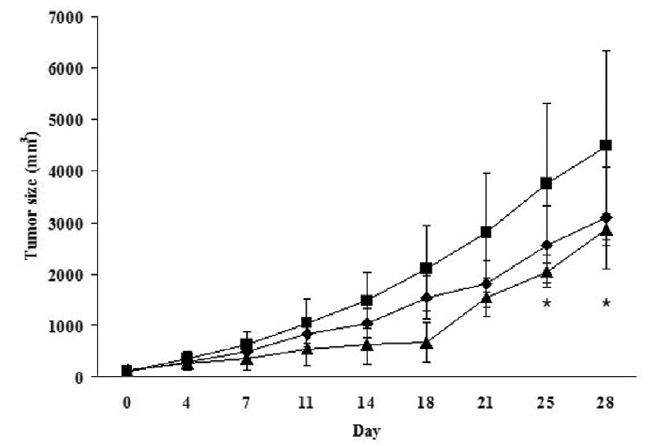
Treatment with MGP (intraperitoneally, intravenous injection) inhibited the growth of NCIH460 cell-transplanted solid tumor compared with value of positive control group (Fig. 4). In 28nd day, the mean tumor volume of MGP with intraperitoneally and intravenous injection treatment group were lower significantly than that of the positive control group throughout the study period.
3-3. Inhibition rate (I.R) on tumor volume
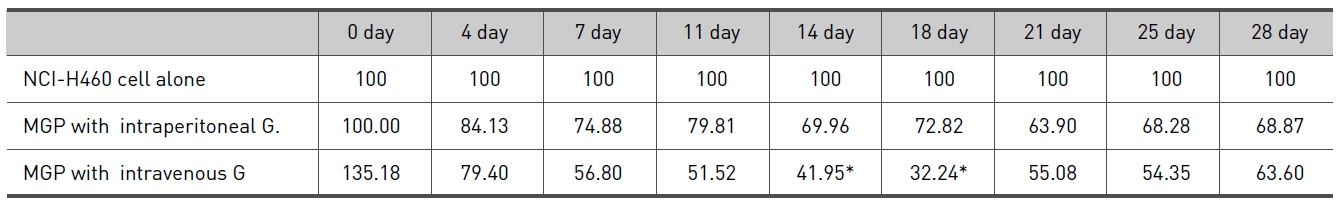
IR (%) of each group are shown in Table 1. From eighth day to final day (28 day), each of IR (%) were tendency to dose-dependence (intraperitoneal injection G. I.R 69.96% < intravenous injection G. I.R 41.95% at 14 day) (Table 1.).
3-4. Tumor weights_and volume (plethysmography)
Final tumor weights and volume of each group are shown Table 2. Tumor weight and volume of positive control group (NCI-H460 only) was 2.52 ±0.75g and 4.67±1.18cm3 on the final day. Tumor weight and volume of MGP intraperitoneal group was 2.20±0.93g and 4.65±1.97cm3 Tumor weight and volume of MGP intravenous injection group was 2.39±1.25g and 2.42±1.19cm3 Compared to the NCI-H460 cell alone group, tumor weight and volume of MGP intravenous injection t group was significantly decreased.
3-5. Mean survival time and Percent increase in life span (% ILS)
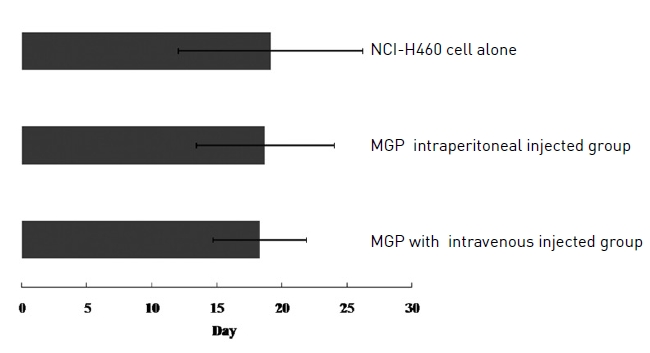
Mean survival time and Percent increase in life span are shown in Table 3. and Fig. 5. The positive control group (NCI-H460 cell alone) survived 18.29±3.59 days. Mean survival time of low MGP with intraperitoneal treated group was extended to 18.71±5.31 days and 2.30 %ILS. Also mean survival time of MGP with intravenous injection treated group was 19.13±7.10 days and 4.59 %ILS. Each of %ILS were increased in dose dependent manner. MGP with intravenous injection treated group was slightly difference compared to the positive control (NCI-H460 cell alone) group.
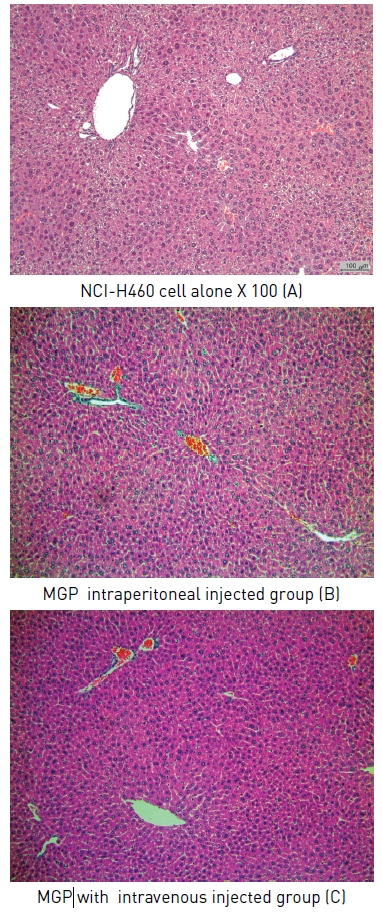
3-6. Histopathological findings (light microscopy) and organ weights
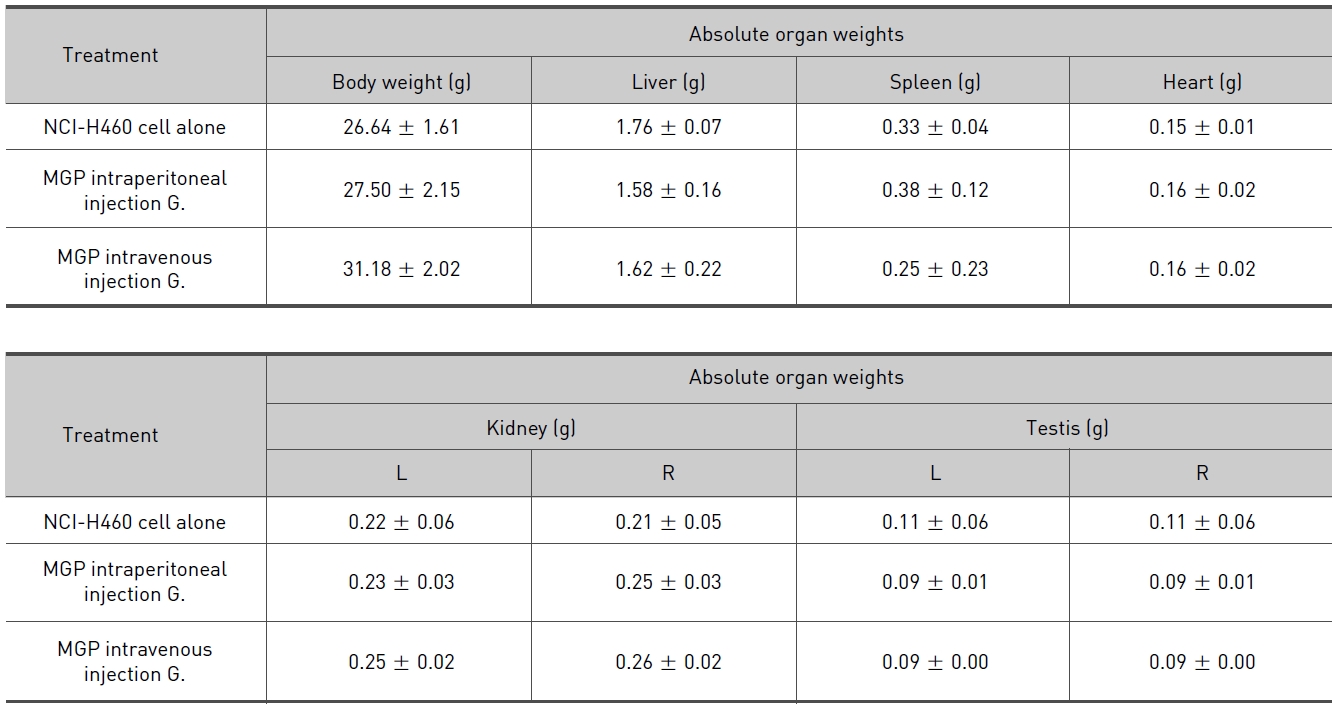
Absolute organ weights of kidney, liver, spleen, heart and lung are shown Table 4. Especially MGP (intraperitoneal and intravenous injection) treated group were a marked decreased in liver weights (
3-7. Blood chemistry levels, on the final day.
The test substances in the blood level CA, CRE, ALT, UN results showed reduction in the significance MGP intravenous injected group (
The major aim of this study was to examinewhether MGP is effective and what is more usefulmethod between intraperitoenal and intravenousinjection for the MGP in human lung carcinomaNCI-H460 cells in vivo.
Human tumor xenografts in immunodeficient animal models provide a means to evaluate potential anti-tumor drugs in preclinical studies and are applicable for studying many different types of human malignancies[19].
So, we also conducted in vivo experiments ofnude mice with NCI-H460 cell-transplanted tumorduring 28 days, which were treated with MGP 0.1ml with intraperitoneal and intravenous injection.For example, as time-dependence changes of tumorvolume were measured by a digital calipers. Andresults of removed tumors volume were measuredby a plethsmometer at final day. All tumor volumeresults were suppressed with dose-dependence tendency,but each one of groups was different in significantlytendency.
The results showed that MGP inhibited dosagedependently the growth of NCI-H460 cell-transplanted solid tumor compared with the control group. At 21 day, numerical value of solid tumor showed 1793.48mm3 (MGP with intraperitoneal injected group), 1545.82mm3 (MGP with intravenous injected group) and 2806.47mm3 (Control group) respectively (Fig. 4). We calculated the results of 21 day because the death rate overwhelmed 50% on the 21 day. Compared with the control group, experimental group showed tumor growth inhibition from 11th day (MGP intraperitoneal injected group I.R. 79.81% < MGP with intravenous injected group I.R 51.52%) in dose dependent manner(Table 1). At the final day, Tumor weights showed 2.20±0.93 MGP intraperitoneal injected group), 2.39±1.25g(MGP with intravenous injected group) and 2.52±0.75g (Control group) (Table 2.).
Mean survival time and the rate of increasing life span of dosage MGP with intraperitoneal injected group was 18.71±5.31 days and 2.30%ILS. Dosage MGP with intravenous injected group showed 19.13±7.10 days and 4.59%ILS. The control group (NCI-H460 cell alone) survived only 18.29±3.59 days (Fig. 5, Table 3.).
In relative organ weights, especially MGP treated groups were a marked decreased in liver weights (
Biochemical blood analysis AST, PHOS levels did not significance result in test. The test substances in the blood level CA, CRE, ALT, UN results showed reduction in the significance MGP with intravenous injected group (
The results showed that MGP may have potential as growth inhibitor of solid tumor induced NCIAnticancer H460 without marked side effects. These resultswere suggested that MGP may be a useful anticanceragent for therapy of human lung cancer andintravenous injection is more effective thanintraperitoneal injection to treating MGP method.
[Table 1.] Inhibition rate (I.R) on tumor volume of NCI-H460 tumor-bearing mice(%).

Inhibition rate (I.R) on tumor volume of NCI-H460 tumor-bearing mice(%).
[Table 2.] Tumor weights in mice xenografted with NCI-H460 cells on the final day.
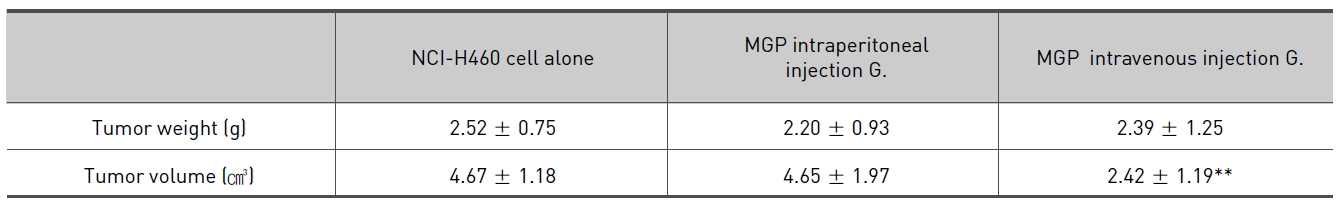
Tumor weights in mice xenografted with NCI-H460 cells on the final day.
[Table 3.] Percent increase in life span (%ILS) of NCI-H460 tumor-bearing mice.
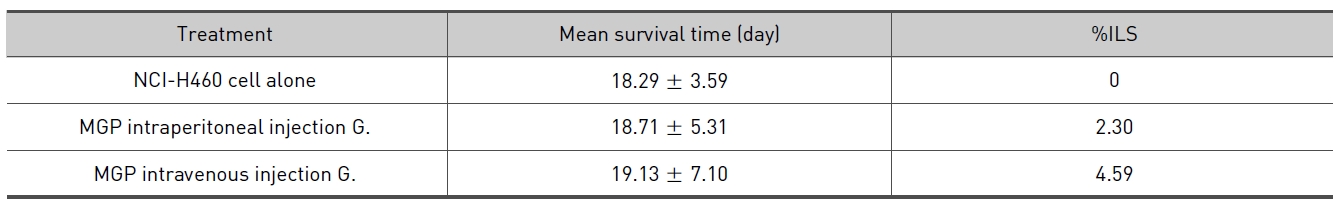
Percent increase in life span (%ILS) of NCI-H460 tumor-bearing mice.
[Table 4.] Organ weights on the final day of NCI-H460 tumor-bearing mice.

Organ weights on the final day of NCI-H460 tumor-bearing mice.
[Table 5.] Blood chemistry levels on the final day of NCI-H460 tumor-bearing mice.
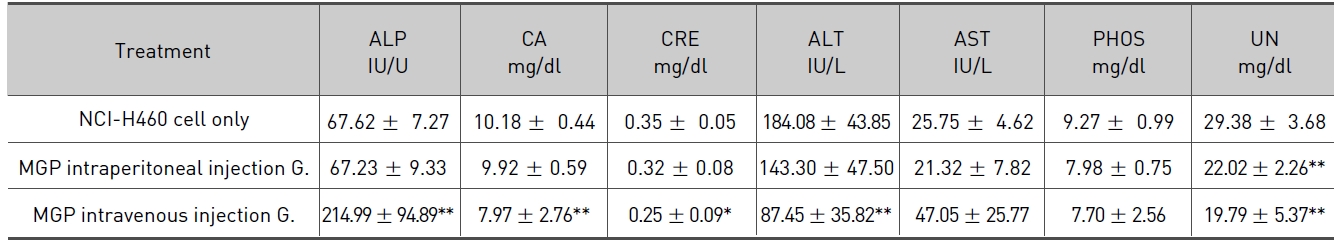
Blood chemistry levels on the final day of NCI-H460 tumor-bearing mice.