The class Chlorophyceae comprises approximately 3,496 described species, according to Algaebase and is one of the most relevant phytoplankton groups in continental waters. The classification of this group is often hampered by the predominance of microscopic cells, frequently lacking obvious structures used to discriminate species or genera. Moreover, life habits, morphologic convergence favored by the unicellular form, the occurrence of cryptic species and asexual reproduction, which keeps mutations that can lead to a large morphologic variability (Potter et al. 1997) are factors that make the classification task arduous (Krienitz et al. 2001, Fawley et al. 2006, Krienitz and Bock 2012, Leliaert et al. 2012).
The urgency of a faster and practical classification system drives many investigations for an efficient molecular marker attending the premises of barcode concept from Consortium for the Barcode of Life (CBOL). This concept comprises the idea that molecular identifications should be conducted using a single pair of primers applicable in the most diverse groups of organisms, recovering a short marker (~700 bp) with enough variation for specific discrimination (CBOL Plant Working Group et al. 2009).
There are many markers proposed for different groups, such as the widely used cytochrome oxidase I (COX I), an official marker for some groups of animals, like fishes (Ward et al. 2005), red (Sherwood et al. 2008, Le Gall and Saunders 2010), and brown algae (McDevit and Saunders 2010), as well as diatoms (Evans et al. 2007).
In green algae, COX I is too variable requiring specific primers to be recovered in different taxa (Fučíková et al. 2011). The amplification of this gene has failed for some chlorophycean taxa (Hall et al. 2010). Furthermore, it may present introns (Turmel et al. 2002), hindering the design of new primers (Saunders and Kucera 2010).
Other markers are frequently used for phylogeny and identification studies of some algal groups, such as
The most constructive results achieved so far have focused in phylogenetic questions for genera within the class (Van Hannen et al. 2000, Hall et al. 2010, Fučíková et al. 2011, McManus and Lewis 2011), therefore there is no known marker fulfilling the requirements of a universal barcode marker for Chlorophyceae.
Besides the universality, if the recovered marker has a good phylogenetic signal, it will allow a correct identification of a completely unknown organism, based on its phylogeny among others organisms already described. Thus, although unknown or undescribed, organisms can be classified in lower taxonomic levels if species discrimination is not possible, helping in culturing independent community studies, such as studies using massive sequencing platforms (Reyes et al. 2012, Salipante et al. 2013, Fumagalli et al. 2014).
According to the CBOL criteria of barcode applicability, the first step is to find primers that can recover those candidate molecular markers from the largest possible number of
All organisms are maintained in pure cultures in the Microalgae Collection at the Phycology Laboratory of the Federal University of São Carlos–Freshwater Microalgae Culture Collection (CCMA) (Portuguese acronym). Most strains were cultured in axenic conditions. The strains used in this study were classified and identified according to Algaebase
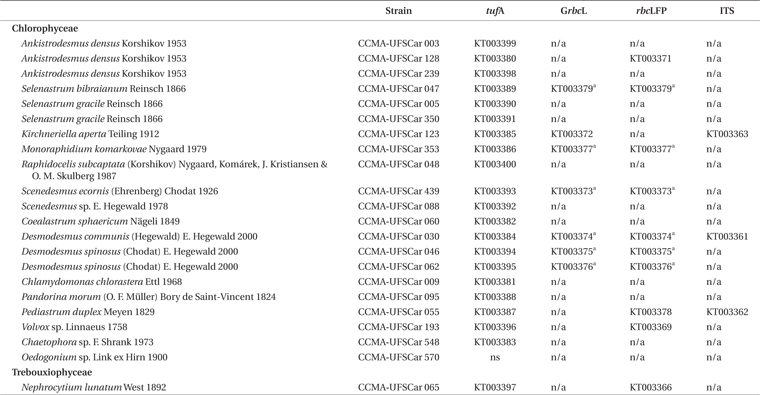
Microalgae strains from CCMA?UFSCar collection and the amplification and sequencing results for each marker
Microalgae strains were cultivated in 100 mL Erlenmeyer flasks, with Wright’s Chryptophyte medium (Guillard and Lorenzen 1972), pH 7.0, 25 ± 1°C, light intensity of 300 μmol photons m-2 s-1 and a 12 : 12 light : dark cycle. Cultures in exponential growth phase, determined by optical density, were harvested in a centrifuge (Eppendorf 5415D; Eppendorf, Hamburg, Germany) under 3,500 ×g resulting in pellets of 40-60 mg of cells for DNA extraction.
>
DNA extraction and marker gene amplification
The concentrated material was homogenized by mixing in vortex for 15 seconds with glass beads (0.5 mm diameter) (Ningbo Utech International, Formosa, Taiwan) for mechanical cell disruption. The DNA was further extracted with Invisorb Spin Plant Mini Kit (Invitek, Hayward, CA, USA).
Strains of
The primers tested for
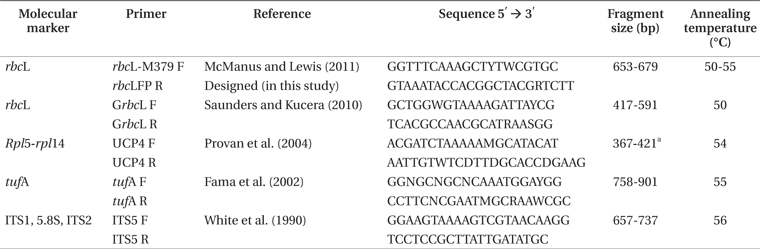
[Table 2.] Molecular markers, names, and sequence of the tested primers

Molecular markers, names, and sequence of the tested primers
One of the pairs of primers tested for
The PCR mix was made as recommended by the Taq polymerase manufacturer (DNA polymerase, recombinant, 5 U μL−1; Invitrogen, Carlsbad, CA, USA) with 0.5 μM of each primer. The DNA was quantified by agarose gel electrophoresis using the
PCR profiles were the same for all markers: initial denaturation for 4 min at 94°C; 29 cycles of 45 s at 94°C, annealing temperature specific for each pair of primers (Table 2) and 45 s of extension at 90°C followed by a final extension at 72°C for 7 min. Amplification was verified through electrophoresis in 1% agarose gel. In the case of amplification failure, changes in concentration of PCR reagents, DNA quantity and gradient of annealing temperature were tested, but none of these tests resulted in success of amplification (data not shown). PCR products were purified with polyethylene glycol 20% (polyethylene glycol) solution and NaCl 1 M (Lis and Schleif 1975) and the DNA sequencing was performed by Macrogen (Seoul, Korea).
Sequences were aligned with the CLUSTAL W software (Thompson et al. 1994) and the edition and protein frame reading translation, analysis of gaps, in/del and stop codons were performed at GENEIOUS version 6.1.7. Sequences were checked for contamination using the Basic Local Alignment Search Tool (BLAST) (Altschul et al. 1990). Polymorphisms data, polymorphic sites, number of codons, synonym and non-synonym mutations, and parsimony informative sites were calculated with DNAsp 5.10 (Librado and Rozas 2009). Index of Substitution Saturation (ISS) and the Index of Substitution Saturations critic (ISSc) were calculated with the DAMBE5 v5.3.27 software (Xia et al. 2003) to evaluate if there was loss of phylogenetic signal by saturation of substitutions. Sequences were deposited in GenBank under the accession numbers found in Table 1.
Phylogeny reconstruction was performed at Mr. Bayes (Huelsenbeck and Ronquist 2001) using a Monte Carlo Makov Chain (MCMC) with 3,000,000 generations, under the general-time-reversible nucleotide substitution model (GTR) (Rodríguez et al. 1990) including parameters for invariable sites (I) and gamma distributed rate variation (G), which was found using
For phylogenetic analysis with fragments of the
>
DNA amplification and sequencing
The
All the sequences obtained with
After alignment of
Considering a lower taxonomic level, for example the family Selenastraceae which has more representatives (9 strains), the highest variation between two strains was 170 bases in a fragment of 826 bp (~20%), and the lowest variation was found between the three strains of the same species,
The
The obtained fragment of the
The wide covering and sequencing success of the
Furthermore, it has been widely applied in Ulvophyceae in different studies (Fama et al. 2002, O’Kelly et al. 2004, Wynne et al. 2009, Lawton et al. 2013) presenting great performance as DNA barcode for this class, except for the family Cladophoraceae (Saunders and Kucera 2010). In previous studies, species discrimination power of the
Although we have found that it is possible to recover
For
This nucleotide sequence could correspond to an intron, what has already been reported for the
The greater success of
The G
However, the low amplification success and low quality sequences led to the exclusion of both
It must be noticed that although there is a large number of
For the ITS region only 3 strains showed good sequencing (Table 1). The pair of primers ITS4-ITS5 for ITS region was chosen among proposed primers in a study with fungi phylogeny (White et al. 1990) and has already been tested with organisms from Chlorophyceae (Van Hannen et al. 2000, Buchheim et al. 2012).
Because it is a spacer region and is under a relaxed selection, mutations may not be strictly selected, which means it is very variable and may present in/dels and inconsistent sizes among the
Although the UCP4 primers have been proposed as universal for application in Chlorophyceae (Provan et al. 2004), no strain could be amplified following the protocol used in the original study, even when different annealing temperatures were tested. Provan et al. (2004) have tested the universality of primers for plastidial DNA using four organisms representing the Division Chlorophyta, with only one organism of the class Chlorophyceae, the specie
The pair UCP4 was chosen in their study because the targeted region had the best combinations of characteristics for DNA Barcoding among the proposed regions, like constancy of non-coding sites number and the fragment size in the amplified lineages. Although the pair of UCP4 primers had worked for
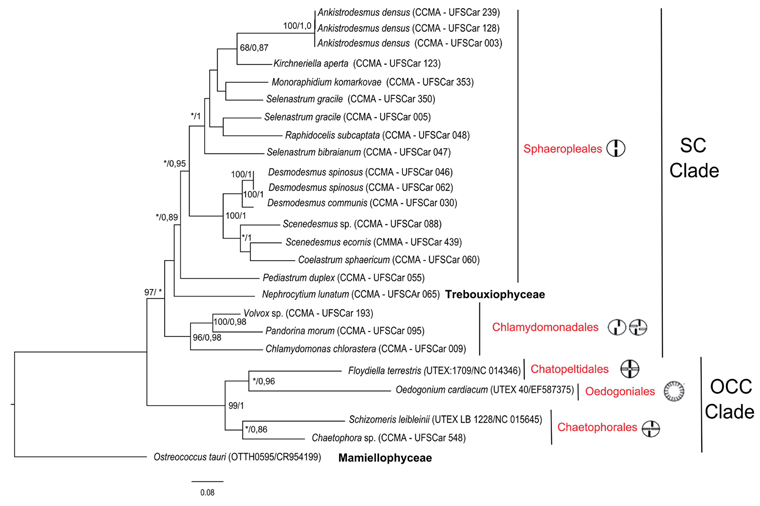
Concerning the use of the genes studied for phylogeny, the Bayesian tree topology with sequences of the
According to the flagella evolution (orientation of the basal body and number of flagella), it is possible to observe the Oedogoniales Chaetophorales Chaetopeltidales (OCC) clade, containing Oedogoniales, Chaetophorales, and Chaetopeltidales, and Sphaeropleales Chlamydomonadales (SC) clade, with Sphaeropleales and Chlamydomonadales. It is also in agreement with other studies that used the 18S rRNA gene (Alberghina et al. 2006, Němcová et al. 2011), 18S and 28S rRNA genes (Shoup and Lewis 2003) and nuclear and plastidial genes combined (Turmel et al. 2008, Tippery et al. 2012).
Despite not strongly supported (Bootstrap / Bayesian probability = 45/0.95), the monophyly of Sphaeropleales was shown with clear delineation of the families Selenastraceae and Scenedesmaceae (94 / 1.0 and 100 / 1.0, respectively) (Fig. 1). However, it is important to remember that some Sphaeropleales families were not represented here, and future works with the
As many authors have already found using other genes (Fawley et al. 2006, Krienitz et al. 2011, Krienitz and Bock 2012), some internal branches were not clearly solved with superimposed genera, reflecting that genetic data may not behave consistently with morphology and leading to ambiguity in species delimitation. For example, the sickle morphology visible in Selenastraceae and used as identification also occurs in Trebouxiophyceae, indicating morphological convergence.
In summary, the
The
Nevertheless, the
One of the critical characteristics for molecular markers is its applicability in as many organisms as possible. Among the 5 molecular markers tested here,
The easy amplification, sequencing and alignment of sequences, the crescent amount of available sequences on data bases summed with the good phylogenetic signal allowing a realistic phylogenetic reconstruction, despite the higher variability than 18S rRNA gene, indicate the
Despite the