Fishers, especially the small-scale, are regarded as one of the world’s poorest groups in the social structure, as their incomes are unstable due to the nature of fishing activity, which depends on time spent at sea, availability of resources, seasonality, weather, and climate (Allison & Ellis, 2001). They are often described as the poorest of the poor (Bẽnẽ& Friend, 2011). The open access of fisheries encourages more people to enter the fisheries business, leading to overexploitation of resources economically (Bẽnẽ, 2003). Some studies reveal that many small-scale fishermen still live in poor condition with low-income level due to few alternative livelihoods, distance from the city center or isolated islands, lack of access to fisheries extension and inadequate marketing and financial services (Bẽnẽ, 2003; Arthur & Sheriff, 2008; Bẽnẽ& Friend, 2011). One of the common assumptions concerning the higher concentration of poverty among coastal communities is low marketing power of fishing households (Russell &Hanoomanjee, 2012). It also observed that poverty in the rural area will only be reduced significantly if the communities can successfully be involved in the market (Russell &Hanoomanjee, 2012). Inefficient fish market caused by high operational cost and inability to find a better market also resulted in low income of the fishers.
It is essential for small-scale fishers to strengthen their organization for resource management, improved marketing system and product development (Jacinto & Pomeroy, 2011). Small scale fisheries sector can succeed if the value of catches can be increased instead of quantity (Sauzade & Rousset, 2013). The drive to increase value-added and the profit margin can be achieved by increasing production efficiency, diversification of goods and market growth (Budi, Fauzi, Fahrudin, & Purnomo, 2016). This will increase the profit and benefit all actors involved in fish processing. The identification of profitable market is also important for the fishers.
1.1. Coral Reef Rehabilitation and Management Program (COREMAP)
Coral reefs are a substantial productive asset for Indonesia, and about eight million small-scale fishermen depend directly on coastal and marine resources. The Coral Reef Rehabilitation and Management Program (COREMAP) is among the conservation program introduced by the Government of Indonesia (GoI) to support livelihoods, particularly of small-scale fishers, in the Indonesian coastal and marine sector. The COREMAP is divided into two areas-- the Western part of Indonesia is funded by the Asian Development Bank (ADB), and the Eastern part of Indonesia is funded by the World Bank. This study focuses on the Eastern part of Indonesia due to high dependency on fishing activities. The COREMAP covers 336,651 ha of coral reef, 7,383 ha of seagrass and 9,493 ha of mangroves (World Bank, 2012).
The COREMAP program offered technical and financial assistance to increase the fishers’ income in terms of capacity building, financial and business management, and soft skills on alternative livelihood by providing seed fund to help the fishers. The objectives of this program are improving the marine ecosystem and creating alternative livelihoods. The program encouraged the communities to engage in other livelihood activities including fish processing and provided revolving funds as capital seeds for the household to engage in other businesses that suit their area best.
This study extends the analysis of Hidayat, Muawanah, and Pabuayon (2016) on the positive impact of COREMAP by focusing on marketing practices and value-added fish products in COREMAP and non-COREMAP area (control). This study aims to analyze; i) the fish marketing practices adopted in COREMAP and non-COREMAP areas, ii) marketing efficiency in the two areas, and iii) development of value-added fish products in the two areas.
2.1. Study Sites and Data Collection
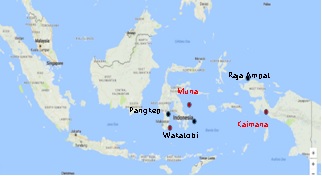
The study sites located in East Indonesia consist of three provinces and six districts, namely, West Papua, Southeast Sulawesi and South Sulawesi. The districts of COREMAP are Raja Ampat (West Papua), Wakatobi (Southeast Sulawesi), Pangkep (South Sulawesi) and funded by World Bank. The non-COREMAP areas consist of Kaimana (West Papua), Muna (Southeast Sulawesi) and Makassar (South Sulawesi). Non-COREMAP sites are located in other districts but within the same province. It differs from COREMAP because the villages do not belong to the COREMAP and do not receive any program assistance from COREMAP. The selection of COREMAP and non-COREMAP sites was purposely to compare the marketing practices between these two areas.
Qualitative and quantitative data were gathered through i) focus group discussions (FGD) with fishers, traders and COREMAP officers and ii) surveys and iii) interviews with fisher households to acquire detail information on the marketing practices, market actors, and relationship between seller and buyer.
For the household survey, the respondents were chosen randomly. About 115-137 fishermen were sampled proportionally for each district in the identified villages. Surveys for households and traders were conducted between January and March in 2016. In total, 714 households and 33 traders were surveyed using structured questionnaires in both COREMAP and non-COREMAP sites. The surveys inquired information on demographic and socio-economic of respondents, fish related information such as catch and prices; marketing information such as market actors, marketing practices, marketing cost, market access, production cost and capital, and related information such as the relationship between buyers and sellers.
[Table 1:] Result for a household survey in both COREMAP and non-COREMAP areas
Result for a household survey in both COREMAP and non-COREMAP areas
2.2.1. Estimation of Marketing Efficiency Index (MEI) and Efficiency Index (EI)
Marketing efficiency refers to the efficient allocation of resources to achieve the greatest possible consumer satisfaction (Anroy, 2004). Several studies such as Aidoo, Nimoh, John-Eudes, Kwasi, Simon, James, and Abaidoo (2012), Chongela, Nandala, and Korabandi (2013) and Janifa, Omar, Sabur, Moniruzzaman, and Haque (2015) conducted marketing efficiency in the fishery and agricultural products. Chongela et al. (2013) used Shepherd’s Index (SI) to represent marketing efficiency by dividing the value of products sold by the total marketing cost. Aidoo et al. (2012) computed marketing efficiency by dividing the value-added along with marketing activities by the marketing cost, then multiplied by 100. Janifa et al. (2015) measured it by dividing the net price received by the farmers by the total marketing cost plus total net marketing margin of intermediaries. Marketing costs include expenses incurred in cleaning, sorting, grading, and others, such as handling, transport, product losses, storage, processing, and capital costs (Shepperd, 2007).
This study employed Shepherd’s Index as adopted by Chongela et al. (2013) to analyse the marketing channels in both COREMAP and non-COREMAP villages. Marketing efficiency is determined by prices of fish sold and the marketing cost (including costs of transportation, grading, loading and unloading, storage, product losses and space rental). The higher ratio implies higher marketing efficiency and vice versa. The ratio was computed for each stage of the marketing channel represented by the marketing agent. If the value of the ratio is greater than 0 (positive value), it means that marketing costs were covered by the selling price. Otherwise, if the value is less than 0 (negative value), it means that marketing costs were higher than the selling price. The formula can be expressed as follow:
Where:
MEI = Marketing Efficiency Index
PF = Price of fishery products sold (Indonesian Rupiah/Kg)
MC = Marketing Cost (Indonesian Rupiah/Kg)
To extend the analysis of marketing efficiency, the study includes the efficiency index (EI) of marketing channel by including the cost of production (marketing cost plus raw materials). The ratio was calculated by dividing the selling price of the product to the production cost minus 1. If the value of the ratio is greater than 0 (positive value), it implies the production cost, including marketing cost, was covered by the selling price.
2.2.2. Estimation of Net Fishing Income
The net income of fishing activity for fishers in both COREMAP and non-COREMAP was calculated by the difference between the total gross revenue and total costs (variable and fixed cost). The net income was calculated based on fishing activity per month in the two areas.
2.2.3. Estimation of Value-Added Products
The value-added approach primarily focuses on value creation, innovation, product and market development (Webber, 2007). It is demand-driven and facilitated by full information about the market system. The consumer preferences are identified by producers due to extensive information flow in the value chain marketing system. Value –added in fisheries enables the producer to determine the consumer preference for certain types of fish, which require the use of specific fishing tools and equipment. Consequently, the specific market will connect fishers to marketing agents based on quality and quantity required, since different types of fish species may have different market outlets.
The value-added depends on the value of raw fish used and the value of the processed output. The higher the value-added gained by the actors, the higher the revenue. It also implies a) a higher level of operational marketing efficiency due to lower marketing cost and b) higher selling price of the fish product. To calculate the value-added of fishery products, the study used the following formula:
Where:
VAij = Value-added of fishery product
VYi = Value of the processed output (
VRFij = Value of raw product used (fish) in the productive activities for product
3.1. Marketing Practices and Marketing Channel
3.1.1. Fish Catch and Price by Species
The study found that fishers in the non-COREMAP have higher average fish catch than those in COREMAP (Table 2). On average, fishers in non-COREMAP had more average fish catch of about 32 kg per trip, while fishers in COREMAP had a lower catch of 21 kg per trip. The difference is significant between both areas at 1% probability level as shown by t-value 4.19. The low fish catch of COREMAP fishers may indicate that the COREMAP project is successful in controlling the fishing activity in the area. COREMAP fishers face some restrictions, and only certain fishing gears are allowed in COREMAP sites. This may imply that COREMAP could have reduced the pressure on fishing dependency through alternative livelihood introduced in the area. Also, people’s awareness to preserve their marine resources through less fishing effort may have increased.
For the fish price, the average price of fish in COREMAP (IDR 29,890 per kilogram) was relatively lower than in non-COREMAP (IDR 31,356 per kilogram) due to a low number of buyers in the former as compared to the latter. However, this overall result is not significant at 10 percent probability level. It is found that fish price in both areas is affected by fish species and the number of buyers in the areas.
[Table 2:] Average fish catch (kg per trip) and price (IDR per kg) in COREMAP and non-COREMAP
Average fish catch (kg per trip) and price (IDR per kg) in COREMAP and non-COREMAP
3.1.2. Market Outlet
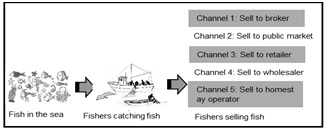
The buyers in both COREMAP and non-COREMAP consist of brokers, retailers, wholesalers and home-stay operators (Table 3). Besides selling fish to the traders, some fishermen also sold fish directly to consumers in the public market assisted by their wives. Majority of fishers in both areas sold the fish catch to the brokers (56% of fishers in COREMAP and 77% non-COREMAP). Some fishers who live in small islands sell directly to consumers since fishers do not have many options with limited buyers, and it is different with the fishers who live in the coastal area (mainland), as they have several types of buyers such as brokers, retailers, wholesalers and household consumers.
This study noted that brokers have a major role in the marketing of fishery products as they exist in both COREMAP and non-COREMAP market outlets (68% on average for both sites). In addition, the brokers have a “loan-relationship” with the fishers by providing the fishers with fishing tools and equipment such as a boat, machine, fishing gear, bait, ice plants, staple food and even advance payment. The advantage of the relationship is fishers being assisted by the brokers in the form of ‘capital support’. This helps the fishers to overcome the complicated process of applying for a loan with the bank. On the other hand, limited option to sell their fish products seems to be the major disadvantage for the fishers. This relationship indirectly obliges the fishers to sell their fish to the loan provider. Although they pay their debts by instalment, the fish price received by fishers is largely determined by the broker.
3.1.3. Method of Payment
Two methods of payment for fish products were identified as follows: 1) cash on delivery―applies when buyer immediately pays fishers upon sale (95% of fishers in COREMAP and 77% in non-COREMAP)and 2) cash advance―applies when fishers get a part of the payment before actual sale (5% of fishers in COREMAP and 23% in non-COREMAP). The study found the first method to have been applied for fishers who have no debt relationship with the buyers; while, the latter was for fishers who have debt relationship with the buyers (Table 3).
3.1.4. Transportation
The boats are used to bring the catch from one small island to another island, while in the mainland, they used buses, motorcycles or even by foot. However, sometimes buyers directly approach the fishers to pick up the fish. About 58% of the fishers transported their fish to the buyer by boat and 42% through land transport in both COREMAP and non-COREMAP. About 49% of the fishers in non-COREMAP and 12% in COREMAP informed their fishes were picked up by the buyers respectively (Table 3). This may indicate lower marketing cost spent by fishers in non-COREMAP as compared to COREMAP.
3.1.5. Grading
Fish grading was conducted in four ways (see Table 3): 1) by species -- 48% in both sites, 2) by size-- 6% in both sites, 3) by both species and size -- 28% in both sites and 4) no grading --18% in both sites. Fish grading is normally done by fishermen to make it easier for buyers to determine the prices of fish based on fish species and size.
3.1.6. Storage
The use of storage facility allows maintaining the fish quality to ensure that fish is fresh and to avoid spoilage. Fish in both areas is stored either in a box with ice or box without ice. Most fishers used the box without ice (73%) in both COREMAP and non-COREMAP since the fishing activity is done only once a day, while in some areas ice is not available due to lack of electricity. Those who used the box with ice usually had a fishing trip for several days (27%) (see Table 3).
3.1.7. Marketing channel
The only difference between COREMAP and non-COREMAP was no wholesaler in the COREMAP and no homestay operator in non-COREMAP. The most common market channels in COREMAP are channel 1 and channel 2 (Table 4). These are reported by 56% and 36% of the fishers, respectively. There is no channel 4 in the COREMAP. Channel 5 only exists in COREMAP (West Papua) and adopted by fishers living in small islands, which are remote to market center in the mainland. Instead, fishers sold their catch to homestay operator for their guests. Whereas, as reported by 79% of fishers in non-COREMAP most fishers practiced channel 1. Channel 3 is considered as the second option practiced by 11% of fishers. The least practiced is channel 4 with only 2%.
[Table 3:] Marketing practice of fishers in COREMAP and non-COREMAP
Marketing practice of fishers in COREMAP and non-COREMAP
[Table 4:] Market channels in COREMAP and non-COREMAP
Market channels in COREMAP and non-COREMAP
3.2. Operational Efficiency by Market Channel
Marketing efficiency is analyzed in terms of two components ― marketing cost incurred and net income received by market participants. In a competitive market, the market is considered efficient when revenue received is able to cover all production and marketing cost and ensures normal profit to the market participants. There is a large number of buyers and sellers who compete, and prices are set according to demand and supply conditions, causing profit to move to a normal level only. Two market channels are selected as the most widely practiced in both COREMAP and non-COREMAP, namely, channel 1 (sell to broker) and channel 2 (sell to public market). The average operational marketing costs are included for both COREMAP and non-COREMAP as in Table 5. The costs include transportation cost, storage cost, grading cost and space rental of the public market.
This study found that COREMAP has higher operational marketing cost for both channel 1 and 2. The average costs were IDR 2,226 per kilogram for channel 1 and IDR 1,496 per kilogram for channel 2. For non-COREMAP, the average cost was IDR 1,260 per kilogram for channel 1, which is lower as compared to COREMAP but higher for channel 2 (IDR 1,680 per kilogram). Higher marketing cost in COREMAP was identified due to poor infrastructure in transportation (gasoline) and electricity (ice storage). Moreover, fishers in COREMAP areas are living far away from the buyers. The result may indicate that fishers in non-COREMAP are more operationally efficient than fishers in COREMAP.
[Table 5:] Average marketing costs (IDR) by market channel, COREMAP and non-COREMAP
Average marketing costs (IDR) by market channel, COREMAP and non-COREMAP
Table 6 shows the marketing efficiency index (MEI) and efficiency index (EI) to evaluate the marketing efficiency of the market channels in both areas. The higher ratio implies higher marketing efficiency, and it may indicate lower marketing cost or higher price, or both.
All COREMAP provinces have positive EI, which indicates that all markets are efficient since the selling price was able to pay for all costs spent (raw fish and marketing cost). Among the four channels in COREMAP, channel 2 (sell to public market) is the most efficient, primarily due to low marketing cost. While in non-COREMAP, channel 3 (sell to the retailer) is the most efficient.
Marketing efficiency index (MEI) and efficiency index (EI) in both COREMAP and non-COREMAP
The study noted that, on average, non-COREMAP has higher fishing income and RoI as compared to COREMAP (Table 7). It was found that lower fishing income in COREMAP was due to lower fish catch (93 kilograms per month) and fish price (IDR 29,890 per kilogram). In non-COREMAP, the average fish catch and fish price were 145 kilograms and IDR 31,356 per kilogram, respectively. Higher RoI in non-COREMAP (19%) was identified due to higher net return than COREMAP sites. RoI determines if the investment in fishing activity is worthwhile. In this case, the rate of return is higher than the opportunity cost of capital approximated by the bank’s interest rate of 1% per month.
[Table 7:] Cost and return from one-month fishing operation in COREMAP and non-COREMAP
Cost and return from one-month fishing operation in COREMAP and non-COREMAP
3.4. Value-added of Processed Fish
Among 714 households and 33 traders surveyed, it was identified only 6 fishers and 24 traders add value into their catches. So, they were selected for further interview to get more information. It is noticed only a few fishers were engaged in fish processing where most of the processed fish were produced by traders and generally involved women.
[Table 9:] Value-added analysis of processed fish
Value-added analysis of processed fish
The processed fish includes dried fish, shredded fish, fish cracker, smoked fish, crab meat and. The dried fish was processed by fishers, while shredded fish and fish cracker were produced by the housewives. The smoked fish was produced by the small traders, and meat crab was produced by the brokers. It was discovered that few fishers were engaged in fish processing due to unavailability of the market for those products. In COREMAP areas, training on fish processing such as fish ball, shredded fish, fish nugget, chip fish and other fish products was only temporary, and COREMAP did not provide marketing assistance to processors. Lack of technical support to be adopted, poor infrastructures and limited markets were identified as the major problems to develop value-added of fishery products in both COREMAP and non-COREMAP villages. Hence, fishers only produced dried fish. There are more traders who produced processed fish but only on a small-scale basis.
As in Table 9, dried fish was particularly produced by fishers to avoid spoilage. Specifically, in the peak season of fish harvesting, there are more dried fish produced due to the abundance of fish and low price of fresh fish in the market. The fish species that were processed into dried fish were mackerel (tenggiri), red snapper (kakapmerah) and other coral fish. However, based on fishers’ perception, few fishers produced dried fish due to the low profit gained as compared to selling fresh fish.
Notably, the biggest component of total value-added is profit which goes to the processor. Higher value-added implied a higher level of efficiency and higher selling price of the fish product. However, the limited market of processed fish was a problem, and not many fishers and traders benefited from fish processing in COREMAP area.
This study analyzed the marketing and value-added of fisheries products in COREMAP and non-COREMAP area in East Indonesia. The results showed that fishers in the non-COREMAP have higher average fish catch than in COREMAP, which implies COREMAP successfully reduced fishing pressure through alternative livelihood. Mostly fishers in both COREMAP and non-COREMAP rely on brokers as buyers of their fish. We found brokers playing a major role in marketing fishery products from fishermen to wholesaler/exporter until they are consumed. Brokers also provide capital to support the fishermen through fishing tools and equipment such as a boat, machine, fishing gear, bait, ice plants, staple food and even advance payment.
We observed there are five marketing channels in both COREMAP and non-COREMAP sites. In COREMAP, fishers sell to brokers and to wholesaler/exporter, some of them directly sell to the consumer through the public market. While in non-COREMAP, besides selling to brokers and to wholesalers, the fishers also sell to retailers and directly to the consumers. The study found that market development in non-COREMAP was more efficient than COREMAP. This conclusion was supported by higher operational marketing cost, lower marketing efficiency index, lower overall efficiency index in market channel 1 (sell to broker) and lower net fishing income per month in COREMAP as compared to non-COREMAP. However, in terms of household welfare and environmental awareness, COREMAP areas are better off than non-COREMAP (Hidayat et al., 2016).
It was found that only a few fishers engaged in the development of value-added products. The most common forms of fish processing were dried fish, smoked fish, shredded fish and crab meat. Dried fish was only produced by fishers’ households, while smoked fish and boiled crab were produced by traders and mini-plan/processor in COREMAP areas. Shredded fish resulted in the highest value-added fish products. Higher value-added implies a higher level of efficiency and higher selling price of the fish products. However, from the fishers’ perspective, the unavailability of the market for processed fish was a major problem. Poor infrastructure and limited market are the main constraints toward market development and promotion of fish processing in COREMAP areas.
This study suggests the need to establish small and medium enterprise opportunities and promote value-added fish products in the COREMAP, so fishers would be able to process the raw fish into a fish ball, canned fish and other processed fish products with well-known markets. It is obvious that cold storage facilities are needed in small island villages to maintain fish quality. The government should pay attention to improve the infrastructure, specifically on transportation and electricity, so fishers would be able to reduce the marketing cost and increase the revenue. These facilities have to be set up by the government with proper organization and structure.
Lastly, it is critical to supply the capacity building needed to enhance the fishers’ skill in the business management to those who form cooperatives or small/medium enterprises on both either involve in the seafood processing and or seafood marketing business. Exchange learning with other successful cooperatives will motivate and provide confidence that they can succeed as well. Financial management is one of those needed training for them.