A Study of the Innovation Resistance of Users and Intention to Use toward Smart Learning for Education Business Ventures*
교육벤처창업을 위한 스마트러닝 사용자의 혁신저항과 이용의도에 관한 연구*
Publish:
Asia-Pacific Journal of Business Venturing and Entrepreneurship
Volume 10, Issue1, p55~67, Feb
2015
ABSTRACT
A Study of the Innovation Resistance of Users and Intention to Use toward Smart Learning for Education Business Ventures*
본 연구는 최근 교육시장의 벤처기업이나 사내 벤처를 위한 혁신기술로 부상하고 있는 스마트러닝(Smart Learning)의 혁신저항에 대하여 연구하였다. 스마트러닝 학습 방법에 대한 지각된 혁신 특성의 상대적 이점, 복잡성 및 적합성이 혁신저항에 유의한 영향을 미치는지 알아보았다. 이어서 기존 학습법에 대한 태도와 지각된 자기효능이 혁신저항에 유의한 영향을 미치는지 알아보았다. 그리고 이용자의 이러한 혁신저항이 향후 이용에 영향을 미치는지 알아보았고, 인구통계에 따라 조절효과가 나타나는지 살펴보았다. 구조방정식 모형을 사용하여 분석한 결과, 상대적 이점만을 제외한 모든 요인이 혁신저항에 영향을 주는 것으로 나타났다. 이를 통해 혁신저항 역시 향후 이용의도에 유의한 영향을 미친다는 결과를 얻을 수 있었다.
KEYWORD
Innovation Resistance
,
Intention to Use
,
Technology Innovation
,
Smart Learning
Startups and corporate ventures with brilliant, innovative products and well-developed technology often fail to maximize their potential or disappear from the market due to inappropriate management strategies. Although the market is rarely predictable, corporations constantly release innovative products to the market, with varying degrees of success or failure. Developing and releasing innovative products and technology successfully are directly related to a corporation’s survival and are necessary for maintaining its compeence. In this study, we examine smart learning, an emerging innovative technology in recent the education market that combines various technologies.
Globally, the number of people using smartphones around the globe has increased over the years. Unlike cellphones intended for simple communication, smart devices with wireless Internet environment, which allows access to various contents, can be used as an educational tool. Due to the development of information technology (IT), smart learning (which depends on wireless Internet technology on mobile devices) has emerged as an alternative to learning in the education market (Yang et al., 2005). According to the National IT Industry Promotion Agency (NIPA), the size of the smart- learning market grew by approximately 7–12% annually from 2.091 trillion won in 2009 to 2.7478 trillion won in 2012; it is estimated to reach 4 trillion won in 2016. Educational facilities, general conglomerates, carriers, and even foreign companies are diving in to this business, and the smart learning market is expected to grow exponentially.
However, according to Hunet’s report, on workers who use smartphones, 56.8% do not use smart learning and would not use smart learning in the future, although they are aware of its usefulness in learning. This shows that smart learning is not actively accepted or used. There are learners who resist this technology, and certain factors influence this resistance. Ram (1987) argued that innovation resistance occurs when faced with new technology, and overcoming the resistance leads to complete acceptance. In other words, negative attitudes and behaviors arise in the face of new technology (smart learning), and users tend to resist smart learning as a learning method. In order for smart learning to proliferate, it is necessary to understand learner resistance and observe the factors influencing such resistance. Carefully monitoring the diffusion process with appropriate intervention and action is important. However, prior studies on smart learning concentrated on acceptance and adoption (Lee, 2012), not resistance. Since learners were expected to accept such technology, previous studies focused on performance such as “services and qualities that would satisfy smart learning users.” However, regardless of how high the quality of the contents or how ideal the system environment is if a fundamental disturbance in participation of learning exists, the intended effectiveness of smart learning will not show. Therefore, there is a need to identify and analyze the factors that lead to learner resistance in accepting smart learning.
Corporations commit a lot of money and resources to R&D. Technological innovation leads to the development of new products and the improvement of existing products, bringing in increased revenue and stable income to businesses. However, the risks associated with technological innovation increase proportionately. Corporations must identify and manage innovation resistance in the process of technology innovation.
The objectives of this study are: First, discovering why user resistance to smart learning exists by focusing on users resistant to smart learning; to identify how learner resistance affects future intention to use smart learning; and to analyze how the influence of each factor varies according to demographic characteristics.
The Ministry of Education and Science Technology (MEST) defines smart learning as “An intelligent custom teacher-learning supportive system to transform required education method, curriculum, evaluation, and general education system in the 21st knowledge and information society.” Smart learning is a human-oriented form of study combined with social and adaptive learning, delivered through the best communication environment.
Learning Smart learning involves accessing learning contents material using mobile devices (smartphones, tablet PCs, e-book devices). Additionally, it can exploit smartphone features such as location-based services or 3D, virtual reality. Smart learning is a many-to-many educational method. That is based on the concept of learning wherever and whenever possible— a ubiquitous environment extended from electronic learning, which was constrained by limitations of time and space. Smart learning enables learning without constraints of time, space, or environmental causes.
Learning has progressed from offline learning, to e-learning, and evolved to smart learning. Offline learning means learning through face-to-face experience with a lecturer in a classroom-like settings, while e-learning means an on-line based experience, through which one is being lectured, using computer and internet. E-learning takes a place in a specific location, such as an office or a home, with a PC that enables an access to learning contents. Smart learning, in a sense that it is based on-line, is similar to e-learning; however, smart learning is distinctive from e-learning since smart learning supports mobility via smart devices.
Smart learning initiatives include such as massive open on-line courses (MOOC) involving participation from Harvard, Stanford, Pennsylvania, Duke, MIT, Princeton, and other universities and the online courses related to computer science, science, mechanical engineering, and applied science provided by EDX, Udacity, and Coursera. These initiatives are intended to eliminate barriers and to provide an open platform for learners (Lim, 2011).
Researchers have interpreted innovation in various ways: “Ideas, practices, objects that has appropriate unit of adoption”, (Zaltman and Wallendorf, 1983); “Newly developed ideas, practices, objects in a proper environment perceived as ‘new’ by the initial user” (Biemans, 1992).
Brown (1992) defined innovation using management concepts: “A New technology, a product, or a process with the potential to create new market, alter existing competition pattern, or consumer behavior.” He emphasized that innovation does not have to be a product with technical advancement, but the product must be recognized as “new” by the consumers. Brown’s research was based on Rogers (1983) study. He was the first to define innovation from the perceiver’s point of view: “An idea, practice, or an object perceived as new to an individual or specifically to a receiving unit.”
Diffusion of innovation
Rogers (1983) proposed that the innovation process involving decision making and adoption is a set of mental processes— individuals first face an innovation, then form attitudes toward the innovation, and finally decide whether to adopt it. He defines five intrinsic characteristics of innovations that influence an individual’s decision to adopt or reject an innovation: relative advantage, compatibility, complexity, trial ability, and observability. The speed of innovation adoption and the diffusion process is influenced by the extent of a user’s innovation perception as well as the adopter’s characteristics.
The Technology Acceptance Model (TAM) developed by Davis (1989) is a representative model for explaining the process of receiving new information technologies and is useful for describing user behavior adoption and use of IT. The TAM is a variation (involving IT) of the innovation diffusion model.
According to the TAM, intention to use depends on perceived usefulness and perceived ease of use. The model assumes that these two factors influence users to form a positive attitude toward information system, and devise plans of action, leading to the actual use or adoption of technology (Zhou, 2008). The results of prior studies indicate that smart learning should be viewed as a new innovation (from the perspective of learners).
Innovation resistance
While introducing a new technology or product, promoting its positive aspects and reducing resistance to technology acceptance are crucial in determining its success or failure. Resistance to change is a natural reaction for most consumers due to fear and uncertainty about embracing new technology (Moore, 2002) and the tendency to maintain status quo. An analysis of innovation resistance could provide several implications for the innovation process. Park and Nam (2012) applied the TAM to study the relationship between intention to use and influencing factors in a mobile learning context. However, there are no prior studies on the relationship between smart learning and innovation resistance. Therefore, a study of smart learning based on the model of innovation resistance would benefit the smart learning industry.
Sheth (1981) was the first to use the notion of innovation resistance and proposed lifestyle and perceived risks as factors that influence innovation resistance. According to Ram’s (1987) innovation resistance model, psychological stability is broken when faced with change and consumers opt for resistance to solve this problem. In this model, he identified the factors influencing innovation resistance as user’s perceived innovation characteristic, user characteristics, and diffusion path characteristics. From perceived innovation characteristic, he derived compatibility, perceived risk, relative advantage, and complexity. He distinguished user characteristics into attitude towards existing product and demographic attributes such as user’s gender, age and educational level. Finally, the characteristics of the message and the type of diffusion paths make up the diffusion path characteristics. However, Ram’s (1987) model of innovation resistance had several limitations. Yoo and Lee’s (1994) extended and modified model of innovation resistance showed that diffusion path characteristics are not influencing factors with regard to innovation resistance; rather they serve as a barrier. They modified the model by including detailed macro-environmental factors that influence innovation resistance. Further, they criticized the dynamic results of innovation resistance and rejection and applied the acceptance stage proposed in Rogers (1983), according to which dismissal and acceptance can vary in each decision step; these modifications increased the model’s suitability.
After the publication of Ram’s (1987) initial theories and model of innovation resistance, various studies examined the characteristics of the product, and new technology in many industries. For instance, Yang and Shin (2010) studied touch interface technology in mobile phones; Yoon (2013) performed an empirical study innovation resistance toward social networking service (SNS) among college students in their twenties. Different factors of resistance were obtained in these studies, which is natural given the different consumer characteristics in each industry.
Intention to Use
The concept of intention to use includes customer’s satisfaction with a product or service provided (Zeithaml, Berry and Parasuraman, 1996). It is defined as the thought or intention to use an innovative product in the future. The notion “intention to use” was derived from Fishbein and Ajzen’s (1975) theory of reasoned action. They opposed the theory that attitudes directly influence behavior; they insisted that the intention of the behavior is formed first, before the action. In this study, the intention to use smart learning includes actively including smart learning in the learning process, having an interest in the device(s) and information necessary to perform smart learning, and informing others about the advantages of smart learning.
Moderating Effects of Gender and Age
Ram (1987) listed demographic characteristics of gender, age, educational level, and income as factors of resistance. Oliver and DeSarbo (1988) suggested that in determining customer satisfaction, group’s characteristics have relatively different influencing powers. Ong and Lai (2006) studied cognition of use in adopting electronic learning; they found out that men’s perceived intention to use and perceived ease of use were higher than those of women. Age is an important variable leading to differences in customer behavior.
Choi, Woo, and Jung (2013) studied smart learning in the context of a remote university; they reported that students above 40 expect more customized learning and interactive practical learning than those below 40. Moreover, students aged below 40 prefer smart learning, which can provide real-time information.
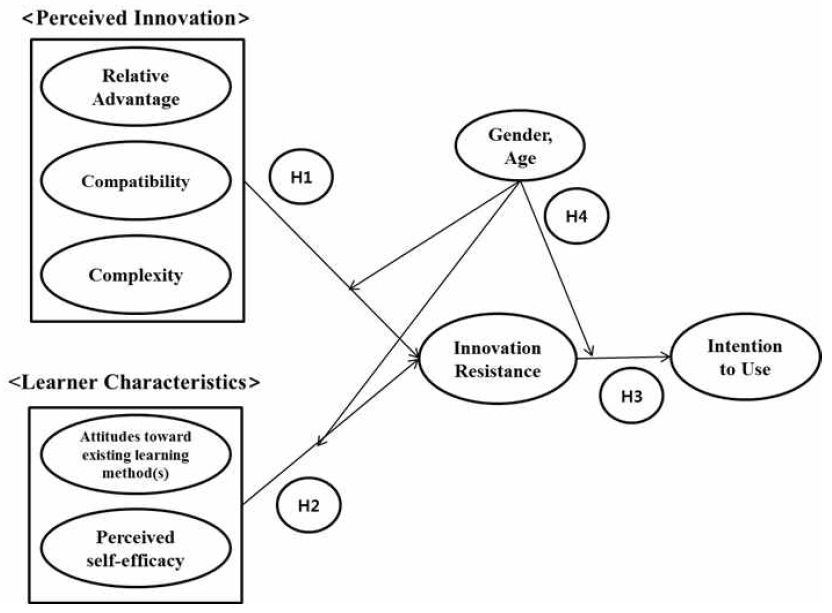
The model was based on Ram’s (1987) model of innovation resistance. The independent variable included some of the resisting factors in Ram’s model that were modified according to learner characteristics in a smart learning context. Following Yoo and Lee (1994), the independent variables were separated into two variable groups: perceived innovation characteristics and learner characteristics. Figure 1 presents the research model.
Perceived innovation characteristics and innovation resistance
Relative Advantage:
When users are encountered a new innovation, they perceived a relative advantage compared to existing technology and products, compatibility to themselves, and its complexity. According to Ram (1987), recognizing how good an innovation is compared to existing one in terms of efficacy, convenience of use and price is a relative advantage. Schiffman and Kanuk (1991) argued that consumer resistance occurs when this relative advantage is low. When comparing smart learning with electronic learning or offline lectures, the relative advantage of the former diminishes due to the high price of the device and frequent malfunctions with small screens and sensitive touch pad; therefore, learners will have innovation resistance.
Compatibility:
The degree of conformity perceived in past experience, desire of the consumer, and existing value is called innovation compatibility (Ram, 1987). Schiffman and Kanuk (1991) suggested that low compatibility leads to higher innovation resistance. Consumers might not be comfortable choosing between an innovative product and an existing product that they use, leading to innovation resistance. If users think that smart learning is not as compatible as electronic learning and offline courses or if it does not live up to the expectations of learners, higher innovation resistance will occur.
Complexity:
Complexity causes delay or resistance in accommodating innovation (Rogers, 1983). If consumers find an innovative product or technology difficult to understand, resistance will occur. Ram (1987) and Shiffman and Kanuk (1991) argued that greater complexity leads to greater resistance. Difficult functions and complex interfaces in smart learning devices would lead to resistance.
Learner characteristics and innovation resistance
Attitudes toward existing learning method(s):
If the attitude towards an existing learning method is positive, innovation resistance will appear high. If users feel comfortable and familiar with the actions taken, they would resist any innovation that would alter the existing situation (Harrison, 1968). If a user believes that traditional electronic learning and offline lectures allow learners to focus better and become efficient, the following hypothesis would hold.
Perceived self-efficacy:
Kim and Choi (2009) defined self-efficacy as the degree of subjective evaluation of the efficacy with which one can perform the required tasks and actions. In the context of this study, self-efficacy would be the self-evaluation of one’s capability in using mobile technology and information. Ellen, Bearden, and Sharma (1991) found that perceived self-efficacy and satisfaction with an existing product influence innovation resistance. This study argues that people with higher self-efficacy have less innovation resistance.
Innovation resistance and intention to use
If there were no resistance to innovation, consumers would adopt innovation immediately; the problem is how to reduce resistance in the adoption process (Ram, 1987). Having innovation resistance does not mean the consumers will not adopt the innovation; the range of acceptance can be widened through continuous improvement. Yoo and Lee (1994) suggested that acceptance and resistance can coexist during the innovation process. Ram (1987) used the “resistance threshold” concept to explain the coexistence of acceptance and resistance. Subjective levels of acceptability decide user acceptance and resistance. When smartphones were first released, feature phone users displayed innovation resistance. Today, people use smartphones more than feature phones, well beyond the acceptable levels of innovation acceptance. Thus, higher innovation resistance will lead to lower intention to use.
Moderating effects of gender and age
Ram (1987) identified demographic characteristics such as age, gender, occupation, and income level as factors leading to resistance. Analyzing the factors of learner resistance according to gender and age would help to understand smart learning customers by segmenting them. In this study, the sample was divided based on gender and age. We investigate the moderating variables of gender and age by dividing the sample into users aged over 40 and those under 40 (following Choi, Woo, and Jung 2013); we analyze the structure of the relationship on innovation characteristics and user characteristics affecting innovation resistance and intention to use.
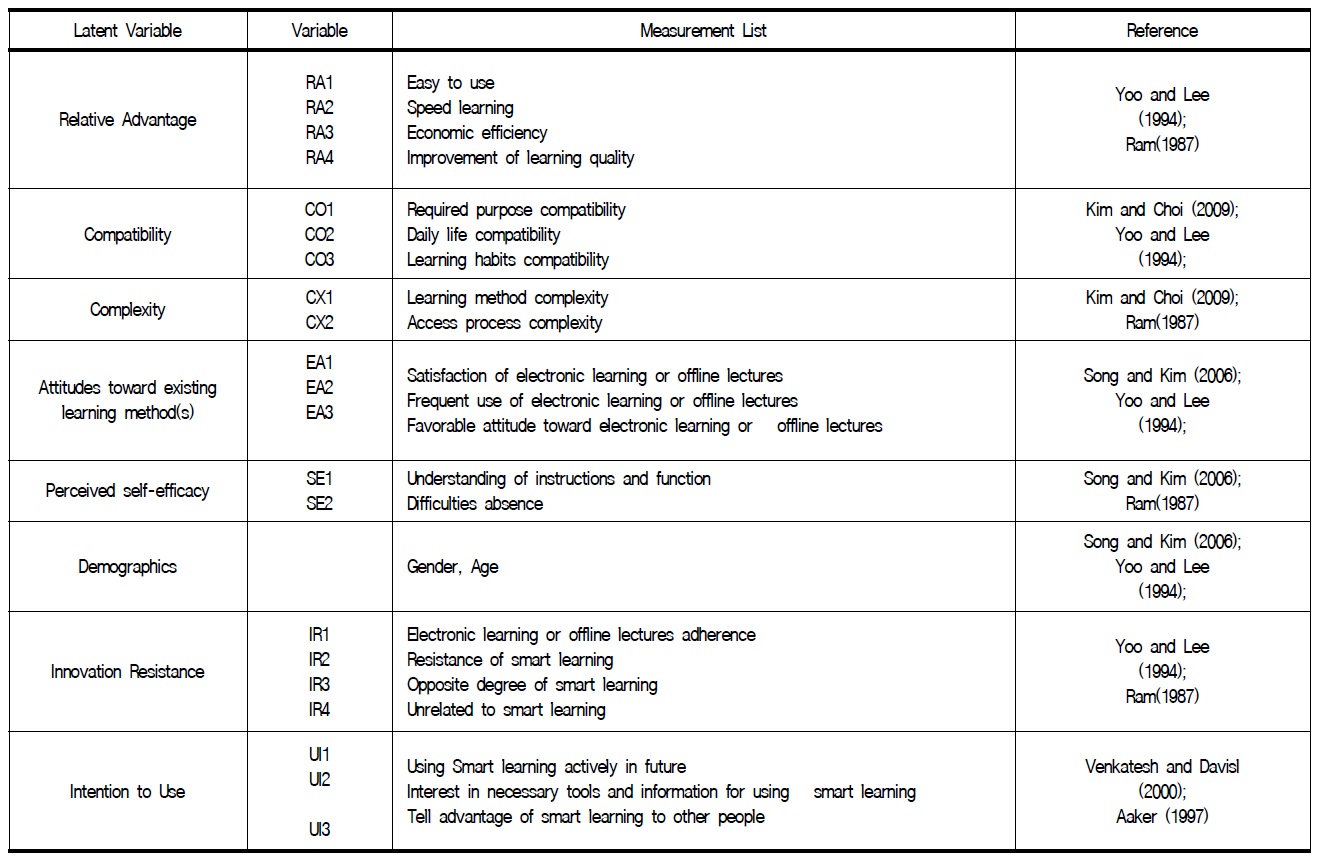
The measurement lists and references used in this study are listed in table 1; the questionnaire was created using survey questions that retained validity and reliability in advanced research contexts. The measurement articles of research variables (except the questions related to demographic characteristics) were measured using a 7-point Likert scale.
The data used in this research was collected using survey. After explaining the definition and characteristics of smart learning in detail, the survey was conducted with people who were involved with smart learning experience, had experience in using equipment to learn or were familiar with the concept of smart learning. A professional research firm executed the survey, and 233 responses, out of 651 requests sent out to both male and female throughout the country, were gathered. The collected data was run through SPSS AMOS 20.0; the specimen characteristics are as follows. Gender: there were 127 men (54.5%) and 106 women (45.5%); Age: 24 respondents were teenagers (10.3%), 46 were in their twenties (19.7%), 51 were in their thirties (21.9%), 55 were in their forties (23.6%), 51 were in their fifties (21.9%), and 6 respondents were in their sixties (2.6%). Occupation: there were 10 high school students (4.3%), 33 university students (14.2%), 4 graduate school students (1.7%), 141 office workers (60.5%), and 24 homemakers (10.3%), and 21 respondents were employed in other jobs (9%); office workers formed the leading group.
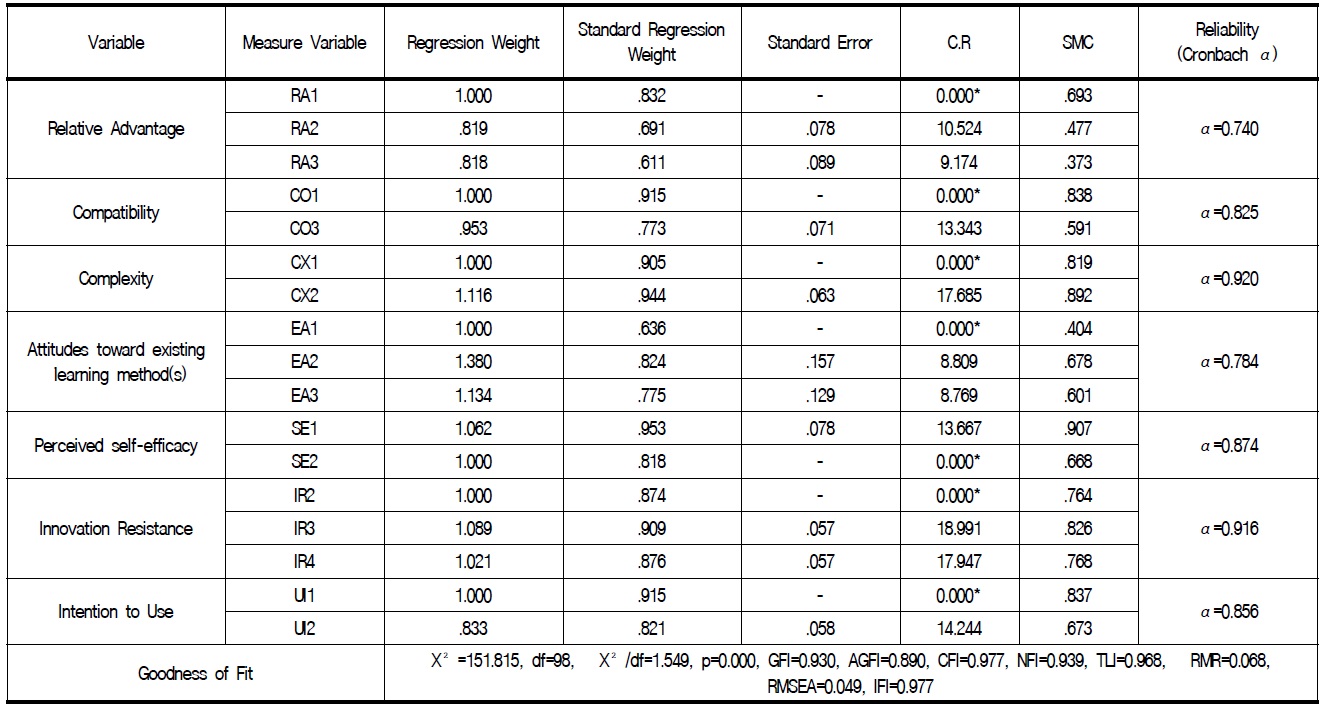
Before evaluating the model proposed in this research, the measurement model was evaluated. Table 2 shows the results of the evaluation of the measurement model in which all the variables were confirmed to be single level through confirmatory factor analysis (to examine covariance). This evaluation was intended to find out whether the indicators of the variables used in the research show acceptable suitability in terms of a single figure model, before the hypotheses of the proposed model were examined.
The evaluation of the measurement model shows that χ2 statistic(in the χ2 examination) is 151.815 (p = 0.000), which rejects the model (i.e., the model is not suitable). However, the fact that it was rejected in the χ2 test is a necessary condition rather than a sufficient condition. The Comparative Fit Index (CFI), Normed Fit Index (NFI), Turker Lewis Index (TLI), and Incremental Fit Index (IFI) indicator values were greater than 0.9, and the Root Mean Square Error of Approximation (RMSEA) values coincided with the standard conditions. However, as Adjusted Goodness of fit Index (AGFI) can be influenced by inconsistencies coming from the specimen characteristics, and considering the fact that free CFI is recommended from the specimen characteristics, model suitability can be evaluated as acceptable since the CFI indicator value is 0.977 (Bentler, 1990). Furthermore, as Bollen (1989) suggested, the estimation of the parameter for the relationship between the latent variable and the measurement variable shows that with the exception of the intention of continuous use variable (which has only one question), the other variables have values significantly greater than 0, and the Construct Reliability (CR) values of the estimations are all greater than 2. Most had an Squared Multiple Correlation (SMC) value (which can be understood as the latent variable) greater than 0.4, which sufficiently explains the variation in the observation variable. Finally, the reliability level of the variables were Cronbach’s α = 0.740~0.920.
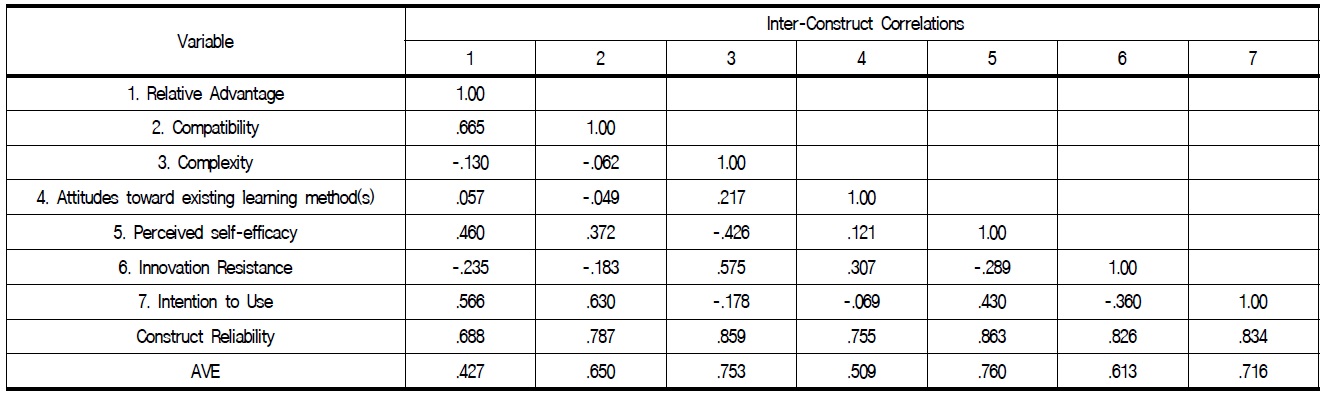
Table 3 shows the results of the evaluation of the measurement model’s validity. The validity of the measurement model was sorted into concentration validity and distinction validity. Concept reliability value (Hair et al., 1995) and standardized regression coefficient (Anderson and Gerbing, 1988) were used to evaluate concentration validity; average variance extraction (AVE) value was used to evaluate distinction validity (Fornell and Larcker, 1981). The figures of concept reliability (except relative advantage) were all greater than 0.7, which means that the concentration validity is confirmed. Another method for verifying concentration validity is to use standardized regression weights. The general suitability figure for confirming concentration validity is greater than 0.5. Thus, concentration validity is confirmed because all three questions of the relative advantage are greater than 0.5. While calculating the AVE value to examine distinction validity, the value of the correlation coefficient between intention of continuous use and word-of-mouth effect squared exceeded the AVE value. However, since no correlation coefficient included 1 in the two-standard error interval estimates, the distinction validity of the measurement model is confirmed.
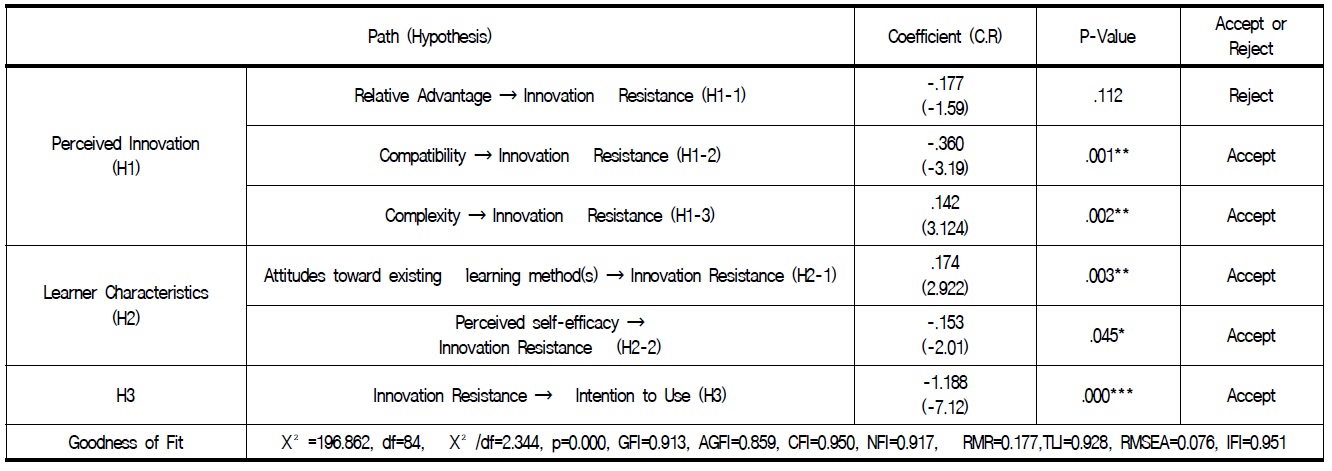
Table 4 presents the results of the estimation of the structural equation model. The goodness of fit of the measurement model is confirmed to be suitable. Specifically, it showed χ 2=196.862,df=84,χ2/df=2.344,p = 0.000, GFI = 0.913, AGFI = 0.859, CFI = 0.950, NFI = 0.917, RMR = 0.177, TLI = 0.928, RMSEA = 0.076, and IFI = 0.951.
The results of the hypotheses examinations are as follows. Hypothesis 1-1 (relative advantage has a negative influence on innovation resistance) had a t value of -1.590 (p = 0.112); thus, it was not influential below the 95% significance level. However, hypothesis 1-2 (compatibility has a positive influence on innovation resistance) had a t value of -3.190 (p = 0.001); thus, it was influential below the 95% significance level. Hypothesis 1-3 (complexity has a positive influence on innovation resistance) had a t value of 3.124 (p = 0.002); thus, it was influential below the 95% significance level. Therefore, compatibility and complexity—perceived innovation characteristics of smart learning —have a positive influence on innovation resistance. Consequently, hypotheses 1-2 and 1-3 were validated, and hypothesis 1-1 was rejected.
Hypothesis 2-1 (perceived attitudes have a positive influence on innovation resistance) had a t value of 2.922 (p = 0.003); thus, it was influential below the 95% significance level. Hypothesis 2-2 (perceived self-efficacy has a negative influence on innovation resistance) had a t value of -2.005 (p = 0.045); thus, it was influential below the 95% significance level. Thus, learner characteristics—attitudes toward existing learning method(s) and perceived self-efficacy—have a positive influence on innovation resistance. Consequently, hypotheses 2-1 and 2-2 were both validated.
Further, hypothesis 3 (learner resistance has a negative influence on intention to use) had a t value of -7.12 (p = 0.000); thus, it was influential below the 95% significance level. Thus, resistance toward smart learning has a negative influence on intention to use. Consequently, hypothesis 3 was validated.
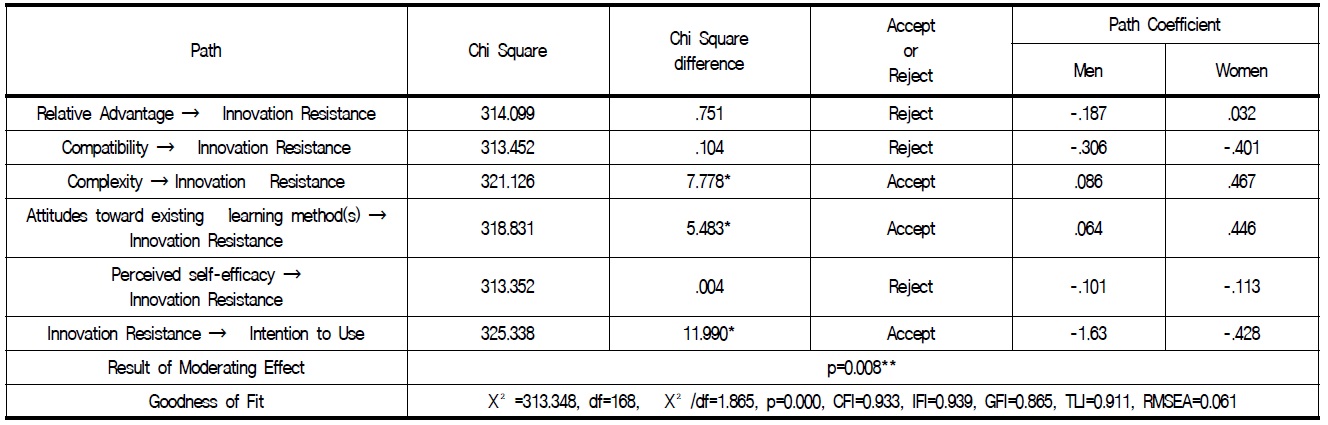
Table 5 presents the results of the examination of hypothesis 4-1—the relationship among the perceived innovation characteristics and the learner characteristics affecting innovation resistance and intention to use will have moderating effects depending on gender. After the sample was categorized based on gender, the number in each group was 127 (men) and 106 (women). Although the final model did not have high levels/figures of suitability, it can be understood as being (comparatively) acceptable. Specifically, it showed χ2 = 313.348, df = 168, χ2/df = 1.865, p = 0.000, CFI = 0.933, IFI = 0.939, GFI = 0.865, TLI = 0.911, and RMSEA = 0.061. The result of examining moderating effect was p = 0.008, implying that there are moderating effects by gender in the structural relationship among the perceived innovation characteristics and the learner characteristics affecting innovation resistance and intention to use. Thus, hypothesis 4-1 was validated.
Since gender is a categorical variable, equivalent multi-group analysis is required to verify its effects. To verify hypothesis 4-1, equivalent analysis was done using the χ2 difference test between the constrained model and the unconstrained model (following Byrne 2004).
In this study, since only the equivalent analysis between paths is required, structural weight equivalent analysis including estimate weight was performed. Thus, if there is a Chi square difference between the constrained and unconstrained models of structural weight for each path, it is determined to have controlling effect depending on gender.
The equivalence verification of the male and female groups in Table 5 shows that only the equality constraint model with chi square difference between constrained and unconstrained models of complexity, the path of attitudes toward existing learning method(s) to innovation resistance, the path of innovation resistance to intention to use according to gender have controlling effect; the others were rejected. The regression coefficient of the path of complexity to innovation resistance was 0.086 for men and 0.467 for women; thus, women have greater influence. Furthermore, the regression coefficient of the path of attitudes toward existing learning method(s) to innovation resistance was 0.064 for men and 0.446 for women; thus, women have greater influence. On the contrary, the regression coefficient of the path of innovation resistance to intention to use was -1.63 for men and -0.428 for women; thus, men have greater influence.
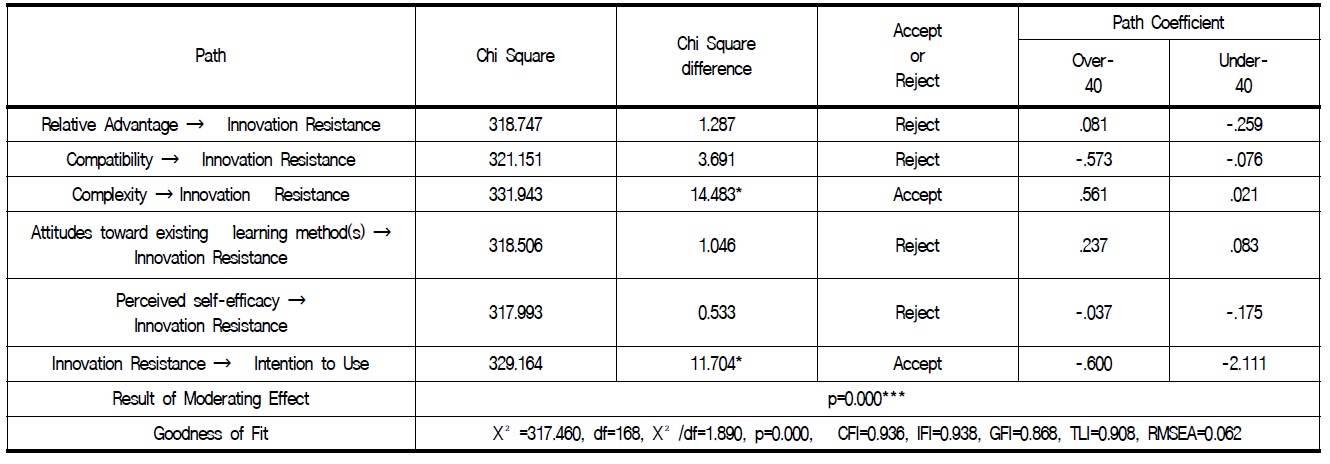
Table 6 presents the results of the examination of hypothesis 4-2—the relationship among the perceived innovation characteristics and the learner characteristics affecting innovation resistance and intention to use will have moderating effects according to age. The sample was divided into a young group comprising respondents below 40 and an old group comprising respondents over 40 (Choi, Woo, and Jung, 2013); the number of respondents in each group was 121 (under 40) and 112 (over 40). Although the final model did not have high figures of suitability, it can be understood as being (comparatively) acceptable. Specifically, it showed χ2= 317.460, df = 168, χ 2/df = 1.890, p = 0.000, CFI = 0.936, IFI = 0.938, GFI = 0.868, TLI = 0.908, and RMSEA = 0.062. The result of examining moderating effect was p = 0.000, implying that there are moderating effects according to age in the structural relationship among the perceived innovation characteristics and the learner characteristics affecting innovation resistance and intention to use. Thus, hypothesis 4-2 was validated.
Since age is a categorical variable like gender, equivalent multi-group analysis is required to verify its effects. The equivalence verification between the under-40 and the over-40 groups in table 6 shows that only the equality constraint model with chi square difference between constrained and unconstrained models, the path of complexity to innovation resistance, and the path of innovation resistance to intention to use according to age have controlling effect; the others were rejected. The regression coefficient of the path of complexity to innovation resistance was 0.561 for the over-40 group and 0.021 for the under-40 group; thus, the over-40 group has greater influence. On the contrary, the regression coefficient of the path of innovation resistance to intention to use was -0.600 for the over-40 group and -2.111 for the under-40 group; thus, the under-40 group has greater influence.
While technological innovation brings increased revenue and stable income to businesses, there are significant risks associated with technological innovation. Startups and corporate ventures need to identify and manage innovation resistance that hinders technology innovation and acceptance. In this paper, we examined the resistance factors that hinder innovation and block learner acceptance as well as the effects of innovation resistance on the intention to use. Further, we analyzed these factors according to gender and age and came to the following conclusions.
First, we found that the lower the compatibility of perceived innovation characteristics, the higher the innovation resistance; the higher the complexity, the greater the innovation resistance. The more learners think that smart learning is not an appropriate service and is not compatible, the greater the innovation resistance. Moreover, learners who think that the process is more complex tend to form a cynical attitude and resist smart learning. However, the relative advantage of existing learning methods (such as offline lectures and e-learning) does not seem to influence innovation resistance. This shows that user experience and time is required for learners to become familiar with smart learning. We conclude that smart learning has not become popular enough yet to have an impact on innovation resistance.
Second, we found that a positive attitude toward existing learning method(s) increases innovation resistance, while lower perceived self-efficacy increases innovation resistance in smart learning. Learners with a positive attitude or greater satisfaction towards traditional learning methods form a critical attitude toward smart learning. Thus, if such learners were allowed to choose between smart learning and traditional education methods, the chances of them selecting e-learning and offline learning methods are higher. The more a learner understands how to use smart learning technology, the greater the positive effect on smart learning acceptance.
Third, innovation resistance has a negative effect on intention to use. A learner’s resistance itself might decrease the intention to use in the future; i.e., low interest in the device(s) required for smart learning lowers the chance of understanding the advantages of this learning method.
Fourth, certain control effects exist in the relationship between the factors of innovation resistance and demographic characteristics (gender and age). The results of the sample analyses show that the two user groups have different effects in every pathway. Women tend to have greater influence in terms of complexity and attitudes toward existing learning method(s), while the innovation resistance of men has greater influence on the intention to use. This could be because women are less familiar with complex machines than men are. Moldafsky and Kwon (1994) showed that women tend to feel more uncomfortable using computers in education and work than men do, and that men prefer using technology. Further, women tend to be more conservative, with a tendency to maintain the existing methods. If men have critical thoughts about smart learning, the possibility of future acceptance can be much lower. Our results show that if certain learning goals cannot be satisfied, men would not use smart learning again. This could be because women tend to be more relational, whereas men tend to be more goal-oriented (Meyer-Levy, 1988).
If we also look at the moderating effects of age, differences exist between the under-40 and over-40 groups. The over-40 group has more influence in terms of perceived complexity, whereas the under-40 group has greater influence on innovation resistance in terms of intention to use. Faced with difficulties in handling complex devices and services, the over-40 group resists smart learning. This result corresponds to Zelinski and Gilewski’s (2003) findings indicating a decrease in cognitive function with age. Once the under-40 group forms a critical view about smart learning, the effect on the future use of smart learning will be more negative compared to the effect in the over-40 group. Kumar and Lim (2008) proposed that if the mobile services provided were satisfactory, loyalty would increase in the younger group; this corresponds with our finding.
The results of this study present the following academic and practical implications. We identified the factors influencing innovation resistance and proved the relationship involving these factors.
Prior studies on smart learning focused on acceptance and adoption (Lee, 2012). The academic significance of this study is that it focused on innovation resistance in the context of smart learning, which has not been attempted before. Second, these results provide practical information to corporations planning to adopt smart learning now or in the near future. The information related to the design of the smart learning system and the need to develop a system based on the reasons for the spread of innovation would be helpful in the development and design of a smart learning environment.
This study has the following limitations. First, only five variable factors that influence smart learning resistance were dealt with in this study. Other perceived innovation characteristics and user characteristics, content characteristics, and infrastructure environment characteristics need to be explored in future research. Second, in establishing the relevant variables and hypotheses, we used new products and new technology innovation resistance due to the lack of prior research in smart learning. More systematic research is required in future studies in the context of smart learning.
참고문헌
1.
Aaker J. L.
(1997)
Dimensions of Brand Personality
[Journal of Marketing Research.]
Vol.34 P.347-403
2.
Anderson J. C., Gerbing D. W.
(1988)
Structural equation modeling in practice: A review and recommended two-step approach
[Psychological bulletin]
Vol.103 P.411
3.
Bentler P. M.
(1990)
Comparative fit indexes in structural models
[Psychological Bulletin]
Vol.107 P.238-246
4.
Biemans W. G
(1992)
Managing innovation within networks
5.
Bollen K. A.
(1989)
Structural equations with latent variables
6.
Brown R.
(1992)
Managing the “S” curves of innovation
[Journal of Business & Industrial Marketing]
Vol.7 P.41-52
7.
Byrne B. M.
(2004)
Testing for multigroup invariance using AMOS graphics: A road less traveled
[Structural Equation Modeling]
Vol.11 P.271-300
8.
Choi H. S., Woo Y. H., Jung H. J.
(2013)
Students’ Perception of Smart Learning in Distance Higher Education
[Korea Contents Society]
Vol.13 P.584-593
9.
Davis F. D.
(1989)
Perceived usefulness, perceived ease of use, and user acceptance of information technology
[MIS quarterly]
Vol.13 P.319-340
10.
Ellen P. S., Bearden W. O., Sharma S.
(1991)
Resistance to Technological Innovations: An Examination of the Role of Self-Efficacy and Performance Satisfaction
[Journal of the Academy of Marketing Science]
Vol.19 P.297-307
11.
Fishbein M., Ajzen I.
(1975)
Belief, attitude, intention and behavior: An introduction to theory and research, Reading
12.
Fornell C., Larcker D. F.
(1981)
Structural equation models with unobservable variables and measurement error: Algebra and statistics
[Journal of Marketing Research]
Vol.18 P.382-388
13.
Hair J. F., Anderson R. E., Tatham R. L., Black W. C.
(1995)
Multivariate Data Analysis with Reading
14.
Harrison A. A.
(1968)
Response competition, frequency, exploratory behavior and linking
[Journal of Personality and social psychology]
Vol.9 P.363-368
15.
Kim Y. H., Choi Y.
(2009)
Determinants of Psychological Resistance against IPTV - Modification of Innovation Resistance Model
[Korean Association for Broadcasting & Telecommunication Studies]
P.163-191
16.
Kumar A., Lim H.
(2008)
Age differences in mobile service perceptions: comparison of Generation Y and baby boomers
[Journal of Services Marketing]
Vol.22 P.568-577
17.
Lee S. N.
(2012)
Study of the Impacts of Smart Learning and Accounting Information Characteristics on Student’s Satisfaction and Educational Performance
[Accounting Research]
Vol.17 P.149-171
18.
Lim K.
(2011)
Research on developing instructional design models for enhancing smart learning
[Journal of Korean Associate Computer Education]
Vol.14 P.33-45
19.
Moldafsky N. I., Kwon I. W.
(1994)
Attributes affecting computer-aided decision making―a literature survey
[Computers in Human Behavior]
Vol.10 P.299-323
20.
Moore G. A.
(2002)
Crossing the chasm
21.
Oliver R. L., DeSarbo W. S.
(1988)
Response determinants in satisfaction judgments
[Journal of Consumer Research]
Vol.14 P.495-507
22.
Ong C. S., Lai J. Y.
(2006)
Gender differences in perceptions and relationships among dominants of e-learning acceptance
[Computers in Human Behavior]
Vol.22 P.816-829
23.
Park S. Y., Nam M.W.
(2012)
An Analysis of Structural Equation Model in Understating University Students` Behavioral Intention to Use Mobile Learning based on Technology Acceptance Model
[Education Information Media Research]
Vol.18 P.51-75
24.
Ram S.
(1987)
A Model of Innovation Resistance
[Advances in Consumer Research]
Vol.14 P.208-212
25.
Rogers E. M.
(1983)
Diffusion of Innovations, Fourth Edition.
26.
Schiffman L. G., Kanuk L. L.
(1991)
Consumer Behavior, Fourth Edition.
27.
Sheth J. N.
(1981)
Psychology of innovation resistance: the less developed concept (LDC) in diffusion research
[Research in Marketing]
Vol.4 P.273-282
28.
Song H. S., Kim G.C.
(2006)
Resistance to Mobile Commerce Services
[Society for E-business Studies]
Vol.11 P.111-134
29.
Venkatesh V., Davis F. D.
(2000)
A theoretical extension of the technology acceptance model: four longitudinal field studies
[Management Science]
Vol.46 P.186-204
30.
Yang E. J., Park B. H., Lim E. S., Jun S. K.
(2005)
A Study on factors influencing the intention to use of m-Learning
[Education Information Media Research]
Vol.11 P.147-165
31.
Yang Y. S., Shin C. H.
(2010)
Innovation Resistance of Consumer in Accepting New Technology -With Emphasis on Mobile Phone Touch Interface Technology-
[Design Learning Research]
Vol.23 P.37-52
32.
Yoo P. H., Lee S. H.
(1994)
A Study on the Innovation Resistance of Consumers in Adoption Process of New Product -Concentrated on Innovation Resistance Model-
[Business administration Research]
Vol.23 P.217-250
33.
Yoon S. W.
(2013)
A study on the innovation resistance on social network service
[Media Science Research]
Vol.13 P.331-360
34.
Zaltman G., Wallendorf M.
(1983)
Consumer behavior, basic findings and management implications
35.
Zeithaml V. A, Berry L. L., Parasuraman A.
(1996)
The behavioral consequences of service quality
[Journal of Marketing]
Vol.60 P.31-46
36.
Zelinski E. M., Gilewski M. J.
(2003)
Effects of demographic and health variables on Rasch scaled cognitive scores
[Journal of aging and health]
Vol.15 P.435-464
37.
Zhou Y.
(2008)
Voluntary adopters versus forced adopters: integrating the diffusion of innovation theory and the technology acceptance model to study intra-organizational adoption
[New Media & Society]
Vol.10 P.475-496
OAK XML 통계
이미지 / 테이블
[
<Figure 1>
]
Research Model
[
<Table 1>
]
The measurement lists and references
[
<Table 2>
]
Confirmatory Factor Analysis
[
<Table 3>
]
Validity Evaluation of Measurement Model