검색 전체 메뉴
PDF
맨 위로
OA 학술지
저산소에 노출된 넙치(Paralichthys olivaceus)의 호흡대사와 혈액의 화학적 변화 Changes in Respiratory Metabolism and Blood Chemistry of Olive Flounder Paralichthys olivaceus Exposed to Hypoxia
  • 비영리 CC BY-NC
  • 비영리 CC BY-NC
ABSTRACT
저산소에 노출된 넙치(Paralichthys olivaceus)의 호흡대사와 혈액의 화학적 변화
KEYWORD
Olive flounder , Paralichthys olivaceus , Hypoxia , Respiratory metabolism , Blood chemistry
  • 서 론

    수중 저산소(hypoxia)는 공기에 의한 수중의 산소포화도가 100%일 때의 용존산소(DO) 농도에 비하여 DO가 낮은 상태를 말하며(Noga, 1999), 유기호흡을 하는 수산생물이 산소부족에 의해 생육하기 어려운 DO 범위를 지칭하는 빈산소, DO가 거의 없는 무산소 환경을 포함한다. 저산소 환경에서 어류는 유영속도, 섭식 및 성장이 저하되고, 저산소가 장시간 지속되거나 산소부족이 극심하면 호흡부전에 의해 질식사하게 된다(Miller et al., 2002; Johansen et al., 2006).

    어류의 대사율은 생리활성 상태에 따라 표준대사율(standard metabolic rate, SMR), 활동대사율(active metabolic rate, AMR)과 일상대사율(routine metabolic rate, RMR)로 구분한다. SMR은 절식, 휴식 상태인 어류에서 보이는 최소 유지 대사율을, AMR은 어류가 최대속도로 유영할 때의 대사율을 의미한다. RMR은 SMR을 능가하는 대사율로서 어체에 random activity가 수반된 상태의 대사율을 칭한다(Randall, 1982). 저산소에 노출된 어류의 호흡대사율(MO2) 변동유형에는 산소포화도가 낮을수록 MO2가 감소하는 산소순응자와 일정수준까지는 산소포화도가 낮아지더라도 MO2를 SMR 내지 RMR 수준으로 조절하는 산소조절자가 있다(Steffensen, 2006). 산소조절자의 대사율 조절은 저산소 환경에 직면한 어류가 항상성을 유지하기 위해 respiratory volume을 증가시킨 결과이며(Randall, 1982), 저산소가 심화되면 대사율은 SMR 이하로 감소하게 되는데 이때의 산소포화도를 임계산소포화도(critical oxygen saturation, Scrit) 또는 임계산소분압(Pcrit)으로 나타낸다(Fry, 1971; Schurmann and Steffensen, 1997; Richards, 2009). Scrit 이하의 저산소에 노출된 어류는 산소요구량의 부족에 따른 생리적 변화가 초래되며, Scrit는 어종, 수온, 섭식상태 등에 따라 차이를 보이는 것으로 알려져 있다(Jobling, 1982; Priede, 1985; Schurmann and Steffensen, 1997; Maxime et al., 2000; Thuy et al., 2010). 저산소에 노출된 어류의 생리적 반응에는 산소 부족에 따른 체내 이온 및 pH 교란에 대한 내성 기작, 저산소에 대응하여 MO2를 줄이는 기작, 해수의 산소포화도가 정상 수준으로 회복된 조건에서는 활성산소에 의한 위해를 줄이는 기작과 함께 스트레스 반응이 수반된다(Maxime et al., 2000; Hebert and Steffensen, 2005; Richards, 2009).

    양식장 사육수의 산소포화도는 일차적으로 수용밀도와 단위시간당 사육수조에 유입되는 수량에 의존된다(Maxime et al., 2000). 특히, 수중 산소용해도가 낮은 고수온기에는 섭식한 먹이의 소화·흡수과정에 나타나는 특이동적작용(specific dynamic action, SDA)으로 어류의 산소소비는 급격히 증가한다(Peck et al., 2005; Fu et al., 2005). 수온이 20℃ 이상으로 상승되는 고수온기 넙치양식장 사육수의 DO는 먹이공급 후 점진적인 저산소가 일정시간 동안 지속된 후 정상 산소포화도(normoxia)로 회복되는 현상이 현장조사에서 관찰되었다. 따라서 점진적인 저산소와 저산소에서 normoxia로 복귀되는 조건에서 넙치의 MO2와 생리상태의 변화 및 Scrit를 측정한 결과는 양식생리학적 기초자료로서 의미가 있을 것으로 생각된다.

    저산소 환경에 노출된 어류의 발생, 생존, 성장 및 생리상태에 미치는 영향은 연어, 송어, 잉어, 대구 및 메기류 등 많은 어종을 대상으로 다양한 연구가 수행되었다(Richards, 2009). 해산 가자미과 어류에 관한 연구는 주로 plaice Pleuronectes platessa (Jobling, 1982; White and Fletcher, 1989), flounder Platichthys flesus (Steffensen et al., 1982; Lennard and Huddart, 1992; Soldatov, 1996), sole Solea solea (Van Den Thillart et al., 1994; Dalla Via et al., 1994) 및 turbot Scophthalmus maximus (Maxime et al., 2000)에 대해 저산소 노출에 따른 대사율과 생리적 변화를 조사한 연구가 다수 보고되어 있다. 하지만 국내 육상양식장의 주요 양식어종인 넙치에 대하여 저산소 농도별 노출에 따른 호흡대사와 Scrit 및 생리상태의 변화를 조사한 연구는 찾아보기 어렵다.

    본 연구는 수온 20℃에서 저산소환경에 노출된 넙치의 MO2와 Scrit를 평가하고, 점진적인 저산소 및 저산소에서 normoxia로 회복 시의 생리적 반응과 혈액화학적 변화를 파악하기 위해 실시하였다.

    재료 및 방법

      >  실험어

    실험에 사용된 양식산 넙치(Paralichthys olivaceus)는 전장 29-34 cm (체중, 382-478 g)의 외관상 건강한 개체를 선별하여 항온사육실내 순환여과식 수조에 수용하였다. 사육 시 수온과 염분은 20℃, 32-33 psu로 유지하였고, 사료는 시판되는 넙치부상사료(Ø 9 mm)를 공급하면서 실험실 조건에 순치·사육하였다. 순치사육 동안 수온, pH, DO 및 염분은 수질분석기(YSI 6920, U.S.A.)로 2-3일 간격으로 수질을 측정하였고, 실험어는 실험 전에 2일간 절식시켰다.

      >  MO2 측정장치

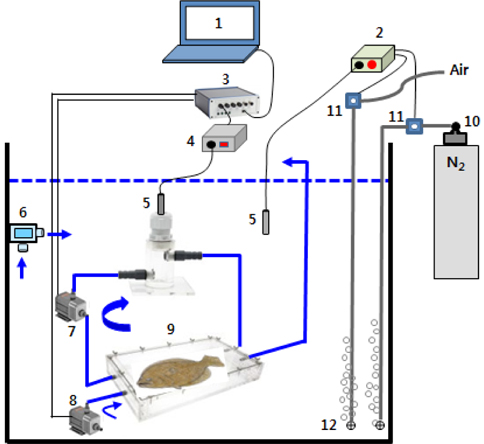
    MO2 측정장치는 수온과 DO 조절장치, 연속 자동호흡측정기(AIFR, automatic intermittent-flow respirometer)로 구성되었다(Fig. 1). AIFR은 PC에 설정한 시간주기에 따라 실험어가 수용된 호흡실에 수조 속의 해수를 주기적으로 교환하면서 MO2가 반복 측정되도록 장치되었다. 해수의 DO는 수조 내 산소전극(Mini Probe, Oxyguard, Denmark)에서 감지된 DO가 설정농도의 1%를 초과하면 산소분석기(OXY-REG, Loligo Systems, Denmark)에 장착된 relay가 N2 regulator에 연결된 solenoid valve (SV, Burkert 6011, Germany)를 개방하여 N2가, 설정농도의 1% 이하로 낮아지면 N2 SV는 닫히고 relay가 공기공급을 제어하는 SV를 열어 aeration되도록 하여 자동 조절되었다. 수온은 온도센스(Pt-100)와 온도조절기로서 히터와 냉각기를 제어하여 실험수온으로 조절하였다.

      >  MO2 측정

    호흡실(21 cm×35 cm×6.5 cm, 4.78 L)에 해수를 약 1/2 가량 채운 후 실험어 1마리를 수용해서 뚜껑을 밀봉하여 수조 속에 넣었다. 이어서 flush pump (FP)와 recirculation pump (RP)를 작동시켜 해수를 완전히 채운 뒤 호흡실과 tubing속의 기포를 모두 제거하였다. 호흡측정은 AutoResp software (Loligo Systems, Denmark)에 통제되어 10분을 주기로 실시되었다. 즉, 3분간의 호흡측정 후 FP에 의해 6분간 호흡실의 해수가 충분히 교체되도록 하였고, 이어서 FP 정지 후 RP에 의해 호흡실과 산소전극을 연결하는 tubing 내에 있는 해수의 DO가 균일하도록 1분간 내부 순환시킨 다음 실험어의 호흡을 측정하는 주기가 반복되었다. FP와 RP의 pumping rate는 4.5 L/min이였고, AIFR이 담긴 수조 속의 수량은 200 L이였다. 호흡 측정시 수온은 20±0.3℃, 염분 32.1-32.6 psu, pH는 7.8-8.1이었고, MO2는 다음의 식으로 산출되었다.

    MO2=α·VRC·βW-1

    여기서 MO2는 1시간당 체중 kg당 호흡대사율(mg O2kg-1h-1), α는 실험어가 3분간 소비한 DO (%)의 1시간 환산치, VRC는 호흡실 용적(tubing 포함)에서 실험어의 용적(mL/g)을 뺀 순환해수의 총량, β는 실험수온과 염분에서 순환해수의 포화산소용해도(mg O2 L %-1)이다. W는 호흡측정이 끝난 후 어체 표면의 물기를 티슈로 닦아내고 전자저울(Sartorius BP3100S)로 0.1 g까지 계측한 실험어의 체중(kg)을 나타내었다.

      >  표준대사율(SMR) 및 일상대사율(RMR)

    본 연구에서는 해수의 산소포화도가 85% DO 이상인 조건(normoxia)에서 최저 MO2가 3회 이상 반복 관측된 후 6회의 MO2 측정치(1시간에 걸친 호흡대사율 측정치)의 평균값을 SMR로, SMR을 능가하는 MO2 범위를 RMR로 표현하였다.

      >  점진적인 저산소 노출 시 MO2와 Scrit

    저산소에 노출된 넙치의 MO2 변동 유형을 파악하기 위하여, 해수의 산소포화도를 normoxia에서 60%, 이후 60% DO에서 10%씩 점진적으로 낮춘 저산소 조건(50, 40 및 30% DO)에 각각 1시간 및 25-15% DO에서는 30-10분간 MO2를 측정하였다. Scrit는 점진적인 저산소에 노출된 넙치에서 측정된 MO2가 SMR 이하로 감소되는 산소포화도별 MO2의 회귀직선이 SMR과 교차하는 지점의 산소포화도로 평가하였다. 모든 실험에서 해수 및 실험구의 DO가 설정농도로 조절되는데 소요되는 시간은 최대 5분 이내였다.

      >  급격한 저산소 및 저산소에서 normoxia에 노출 시 MO2

    Normoxia에서 해수의 DO를 50%, 이후 50% DO에서 10%씩 단계적으로 낮춘 저산소 조건(40 및 30% DO)에 각각 1시간, 30%에서 20% DO로 낮춘 조건에서는 30분간 MO2를 측정하였다. 이어서 해수의 DO를 20%에서 70%로, 70%에서 normoxia로 높여서 각각 1시간 동안 MO2를 측정하였다.

      >  급격한 저산소 및 저산소에서 normoxia에 노출 시 혈액의 화학적 변화

    저산소와 저산소에서 normoxia 조건에 각각 노출된 넙치 혈액의 화학적 변화를 조사하기 위해, 노출시험에 사용된 수조(수량, 150 L)는 대조구를 포함하여 총 8개로 구성되었다. 각 실험구에는 평균체중 395±43 g의 넙치를 5마리씩 수용하여 2일간 절식상태로 유지하였다. 노출실험은 7개 실험구의 DO를 normoxia에서 50%, 이후 50% DO에서 10%씩 점진적으로 낮춘 저산소 조건(40 및 30% DO)에서 각각 1시간, 30%에서 20%로 낮춘 조건에서는 30분간 노출시킨 후 혈액을 채취하였다. 7개 실험구중 2개는 normoxia에서 20% DO까지는 위와 동일한 절차로 저산소에 노출시킨 후 DO를 70% 및 70%에서 normoxia로 높여서 1시간 노출 후 실험구별로 채혈하였다. 대조구는 aeration에 의해 DO가 85% 이상 유지되도록 하였다. 실험구의 DO 조절은 전술한 방법의 DO조절시스템이 적용되었다.

      >  채혈 및 혈액분석

    실험농도의 산소포화도에 노출시킨 후 실험어 포획 시에는 내부구획이 쉽고 물 흐름이 원활하도록 만든 아크릴 칸막이로 1마리를 격리한 뒤 뜰망으로 신속히 채집하여, 포획에 따른 동일 실험구의 다른 어체에 교란이 없도록 하였다. 포획 어체는 lithium heparinized syringe를 사용하여 미부혈관에서 혈액을 채혈한 즉시 각 분석에 사용하였다. 채혈 주사기의 바늘을 제거한 뒤 혈액가스분석기(IDEXX VetStat, U.S.A.) 주입구에 꽂아 125 μL을 자동 흡입되게 한 뒤 혈액의 pH, 산소분압(PO2) 및 전해질(Na+, K+, Cl-)을 분석하였다. 여분의 혈액은 Eppendorf tube에 주입한 다음 5,000 rpm에서 5분간 원심분리하여 혈장을 수거하였다. Plasma glucose는 혈액생화학분석기(Fuji Dri-chem 3500s, Japan)로 측정하였다. Plasma lactate는 enzymatic kit(Sigma L3916 & Sigma diagnostics procedure)로 발색시킨 뒤 시료의 흡광도를 340 nm에서 측정하여 검량선과 비색 정량하였다. Plasma cortisol은 cortisol ELISA kit (IBL RE52061, Germany)로서 분석하였다.

      >  통계처리

    저산소 및 normoxia에 반복노출 시 MO2와 혈액화학적 측정결과는 one-way ANOVA를 실시하여 평균 간의 차이를 검정하였다. 이로부터 95% 유의수준에서 차이가 인정된 측정치 간의 다중비교는 Zar (1984)가 제시한 방법에 준해 SPSS (version 19.0) 통계패키지를 이용하여 Turkey test를 실시하였다(P<0.05).

    결 과

      >  표준대사율(SMR) 및 일상대사율(RMR)

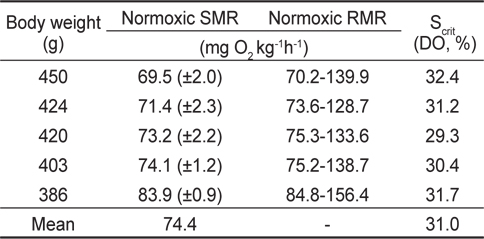
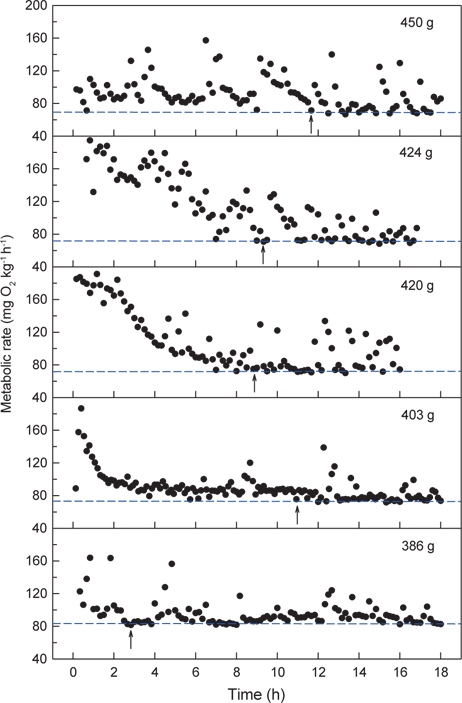
    수온 20℃에서 체중 386-450 g의 넙치 5개체에 대해 각각 normoxia에서 MO2를 측정한 결과는 Fig. 2와 같다. 호흡측정 개시 후 실험어별로 3시간에서 12시간 동안의 MO2는 호흡측정 과정에 수반된 실험어 포획과 호흡실 투입 등의 취급에 따른 스트레스로 인하여 높고 불안정한 MO2가, 이후에는 초기에 비해 낮고 안정된 MO2가 반복적으로 관측되었다. 수온 20℃에서 넙치의 normoxic SMR은 개체크기에 따른 대사강도의 차이가 나타나 69.5-83.9 mg O2 kg-1h-1이었고, RMR은 70.2-156.4 mL O2 kg-1h-1의 범위를 보여주었다(Table 1).

    [Table 1.] Normoxic SMR, RMR and critical oxygen saturation (Scrit) of olive flounder Paralichthys olivaceus exposed to normoxic and hypoxic water at 20℃

    label

    Normoxic SMR, RMR and critical oxygen saturation (Scrit) of olive flounder Paralichthys olivaceus exposed to normoxic and hypoxic water at 20℃

      >  점진적인 저산소 노출 시 MO2 와 Scrit

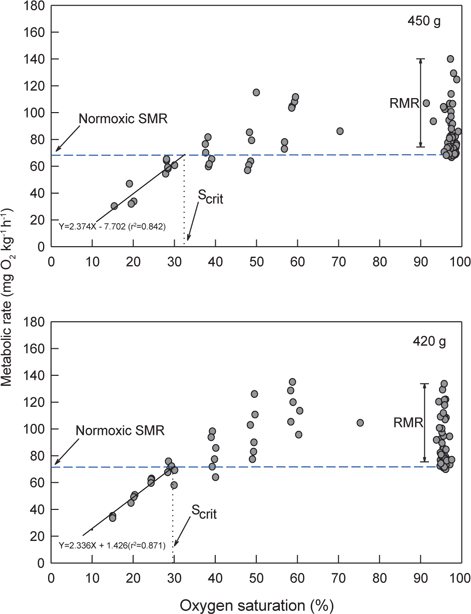
    Normoxia에서 해수의 DO가 40%로 낮아진 저산소 조건에 노출되면 초기에는 normoxic SMR에 근접하는 MO2를 보이다가 시간이 경과할수록 SMR을 초과하는 값이 관측되었다. 30% DO에서는 normoxic SMR 이하이거나 비슷한 대사율이 유지되었고, 30% 이하에서는 DO가 낮아질수록 MO2는 현저하게 감소하였다. 수온 20℃에서 생체중량 400 g 전후의 넙치는 해수의 DO가 감소함에 따라 normoxic SMR 이하로 MO2가 감소되는 산소포화도(Scrit)는 평균 31.0% (29.3-32.4%)로 평가되었다(Fig. 3Table 1).

      >  급격한 저산소 및 저산소에서 normoxia에 노출 시 MO2

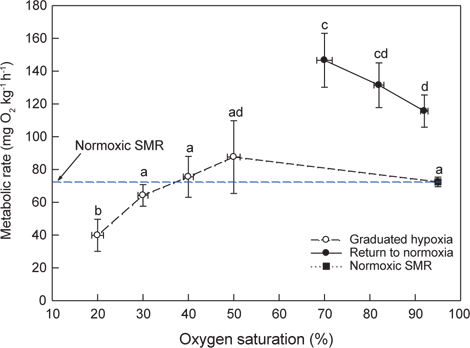
    Normoxia에서 50, 40, 30 및 20% DO에 노출시킨 후 저산소(20% DO)에서 70% DO와 normoxia로 복귀시켜 MO2를 측정한 결과는 Fig. 4와 같다. 해수의 DO가 30%로 낮아지면 MO2는 감소하기 시작하였고, 20%에서는 normoxic SMR (74.5±2.7 mg O2 kg-1h-1)에 비해 유의하게 낮았다(P<0.05). 해수의 DO가 20%에서 70%로 높아지면 normoxic SMR의 2배에 달하는 높은 MO2가 관찰되었고, 이후 normoxia로 회복된 조건에서는 시간이 경과함에 따라 MO2는 점차 감소되는 경향을 보여주었다.

      >  급격한 저산소 및 저산소에서 normoxia에 노출 시 혈액의 화학적 변화

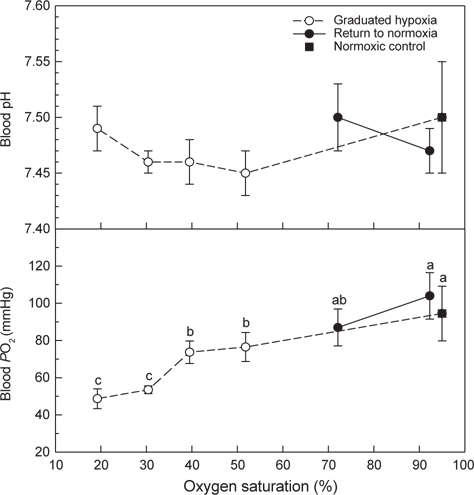
    Normoxia에서 50-20% DO 및 저산소(20% DO)에서 70% DO와 normoxia에 노출된 넙치 혈액의 pH와 PO2Fig. 5와 같다. Normoxia에서 50, 40 및 30% O2에 노출된 후에는 혈액 pH가 감소하는 경향을 보였지만 normoxic control (대조구)과 차이는 없었다. PO2는 점진적인 저산소 상태가 심화될수록 감소하였고, 해수의 DO가 30%와 20%인 저산소에 노출된 것은 대조구에 비해 낮은 PO2가 관찰되었다(P<0.05). 저산소에 노출 후 DO가 70%와 normoxia로 회복된 조건에서는 대조구와 차이가 없었다.

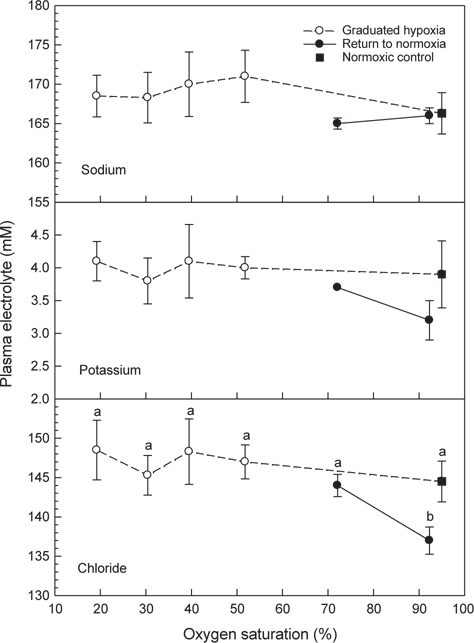
    혈장 sodium과 potassium은 저산소 및 저산소에서 normoxia에 노출된 조건에서도 대조구와 차이는 없었다(Fig. 6). Chloride는 저산소에 노출 후에는 대조구와 차이가 없었으나 저산소 노출 후 해수의 DO가 normoxia 수준으로 회복된 조건에서는 혈액 chloride 농도가 감소하였다(P<0.05).

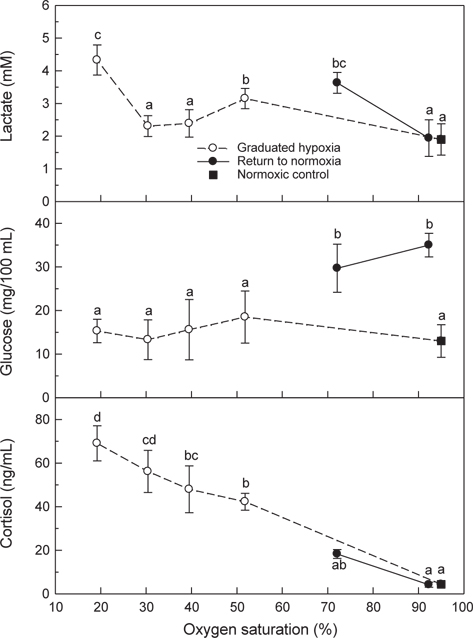
    혈장 lactate는 50 및 20% DO의 저산소에 노출된 후에는 대조구에 비해 높은 농도가 측정되었고, 저산소(20% DO) 노출 후 해수의 DO가 70%로 회복된 조건에서도 높은 농도가 유지되었다가 normoxia에서는 대조구 수준을 나타내었다(Fig. 7). 혈장 glucose는 저산소에 노출되는 동안에는 변화가 없었으나 해수의 DO가 20%에서 70%와 normoxia로 회복된 조건에서는 대조구와 비교하여 유의하게 높은 농도가 관찰되었다. 혈장 cortisol은 normoxia에서 저산소 조건이 심화될수록 지속적으로 증가하는 현상을 나타내었다. 저산소 노출 후 해수의 DO가 70%와 normoxia로 회복된 뒤에는 plasma cortisol이 급격히 감소하여 대조구와 유사한 수준을 나타내었다(Fig. 7).

    고 찰

    수중의 DO 결핍은 어체에 스트레스로 작용하여 어류 행동과 생리적 변화를 초래하는 요인이 될 수 있으며(Herbert and Steffensen, 2005), 어류는 저산소 영역에서 도피하거나 유영 활동 및 섭식 활동을 억제하여 대사 에너지 소비를 감소시키는 등 다양한 조절작용을 보인다(Poon et al., 2001).

    저산소 환경을 접한 어류는 MO2 조절 유형에 따라 산소조절자와 산소순응자로 구분한다. 산소조절자는 일정 범위의 저산소 수준 이내에서는 산소요구량에 상당하는 산소를 섭취하기 위하여 호흡수와 심장박동당 혈액 박출량을 증가시켜 대사율을 일정하게 조절하지만, Scrit이하로 DO가 낮아지면 MO2가 감소하면서 근육이나 혈중에 lactate를 축적하는 혐기성 대사가 수반된다. 이에 반하여 산소순응자는 수중의 DO가 낮아질수록 MO2도 지속적으로 감소하는 형태를 보인다(Steffensen, 2006). 수온 20℃에서 normoxia와 점진적인 저산소에 노출된 넙치의 MO2 변동 유형을 조사한 바, 넙치는 산소포화도가 약 30% 이상인 저산소 조건에서는 해수의 DO가 감소하더라도 대사율을 조절하여 SMR 범위를 유지하였지만 30% 이하에서는 MO2가 SMR 이하로 감소하는 현상이 뚜렷하여 전형적인 산소조절자로 나타났다(Fig. 3).

    저산소 수중에서 어류가 직면하는 일차적인 문제는 호흡 항상성을 유지하는 것이다. Maxime et al. (2000)은 산소조절자인 turbot S. maximus에서 관찰된 저산소 노출 시 MO2 조절 기작은 호흡수 및 단위시간당 심장박출량의 증가를 통해 아가미로부터 이용가능한 산소량을 증가시켜서 MO2를 일정하게 유지하지만, 저산소 노출 동안 아가미 근육 운동의 증가에도 불구하고 turbot의 MO2는 증가하지 않는 현상을 관찰하였다. 저서어류에서 흔히 관찰되는 이러한 조절 반응은 첫째, 저산소 환경에서는 호흡에 사용되는 에너지 비용을 낮추고 둘째, 호흡에 사용되는 에너지가 일정하거나 증가하는 경우에는 다른 조직의 산소흡수를 감소시키거나 각 기관별 임계산소장력이 다양하게 변화될 수 있으며 셋째, 산소부족 시에는 호기성대사 뿐만 아니라 혐기성대사로부터 생성된 에너지 사용이 동반될 수 있다고 하였다. Turbot에서와 같이 20% DO에 노출된 넙치의 혈중 lactate는 normoxic control (대조구)에 비해 현저하게 높은 점(Fig. 7)은 혐기성대사에서 생성된 에너지의 사용 가능성을 부분적으로 추론할 수 있겠으나 30-40% DO에서는 대조구와 유사한 수준을 나타내어 반복 조사가 필요한 것으로 여겨진다.

    수온 20℃와 염분 32 psu에서 측정된 넙치의 Scrit는 31% DO였다. 해산 가자미류의 Scrit를 살펴보면 수온 13℃와 염분 5 psu에서 P. flesus는 ≤20% DO (Tallqvist et al., 1999), 그리고 수온 14-18℃, 염분 34 psu에서 S. maximus는 20-30 mmHg로써 이를 산소포화도로 환산하면 약 13-20% DO (Maxime et al., 2000)이었다. 이에 반하여 Steffensen et al. (1982)Jorgensen and Mustafa (1980)은 수온 10℃에서 P. flesus의 Scrit는 각각 60-100 mmHg와 55 mmHg로 보고하였다. Maxime et al. (2000)은 어종별 Scrit 측정치의 차이는 MO2 측정방법(closed respirometry, flow-through respirometry, intermittent-flow respirometry)과 종간의 차이로 추정하였다. 그렇지만 Steffensen (1989)은 수서동물의 MO2 측정에서는 반복되는 호흡측정 시 해수의 산소분압을 일정하게 유지하고 자가오염원(CO2 및 질소배설물 등)이 시험어류에 미치는 영향을 배제시킬 수 있으면서 재현성이 높은 측정법으로 intermittent-flow respirometry를 제안하였다.

    어류의 Scrit는 수온 및 섭식 상태 등에 따라 달라지는 데, Schurmann and Steffensen (1997)은 체중 70-473 g의 Atlantic cod Gadus morhua의 Scrit는 수온 5, 10 및 15℃에서 각각 16.5, 23.2 및 30.3% DO로서 수온이 높아질수록 Scrit는 증가하였다. 또한 Thuy et al. (2010)은 농어류의 일종인 Perca fluviatilis의 임계산소분압(Pcrit)은 절식한 어체에 비해 섭식한 어체에서 3.4-4.9 kPa (25.5-36.7 mmHg≒ 16-23% DO)가 증가하는 현상을 관찰하고, 양식장에서 최적 산소조건을 산정하는데 고려되어야 한다고 하였다. 따라서 본 연구에서 측정된 넙치의 Scrit는 수온 20℃에서 48시간 절식개체에서 측정된 것이며, 여름철 고수온 시기(25-27℃)에 섭식한 넙치의 Scrit는 다소 높아질 것으로 추정된다.

    저산소 조건에서 어류는 혐기성대사가 수반되며, 혐기적대사산물인 lactate는 근육에 축적되거나 혈액에 방출된다. 넙치의 혈중 lactate 농도는 20% DO에서 유의하게 높았으며, normoxia로 회복된 조건에서는 점차 감소하였다. 저산소 노출 후 70% DO로 회복된 조건에서 측정된 높은 MO2는 극심한 저산소 조건(20% DO)에서 초래된 산소결핍 및 이 과정에 생성된 lactate의 산화에 필요한 산소부채와 연관된 것으로 사료된다(Fig. 4).

    저산소에 노출된 넙치의 혈중 전해질 농도는 산소포화도에 따른 차이를 나타내지 않았지만 Cl-의 경우 저산소 환경에 노출 후 normoxia 조건에 유지된 후에는 대조구에 비해 감소하였다(Fig. 6). 해산어류의 체액은 환경수인 해수보다 저장액으로써 체내 수분이 쉽게 상실되기 때문에 어류는 해수중의 수분을 섭취하고 과잉의 이온을 배출하여 삼투농도를 일정하게 유지한다. 하지만 어체가 급성 스트레스에 노출되면 전해질 조절에 다소 영향을 주는 것으로 알려져 있다(Robertson et al., 1987).

    혈액 PO2는 수중의 산소포화도가 낮아질수록 점진적으로 감소하였고, 점진적인 저산소에 유지된 후 20% DO에 30분간 노출된 후에는 대조구의 60% 수준이었다. 20% DO에서는 낮은 MO2 (Fig. 4) 및 혈중 PO2가 현저하게 감소된 점으로 보아 넙치는 산소요구량의 부족에 따른 호흡부전이 어체에 스트레스로 작용할 것으로 추정되었다. 저산소에 노출된 넙치의 스트레스 반응은 혈중 cortisol과 glucose 농도 변화를 통해 확인할 수 있었다(Fig. 7). 어류가 스트레스 환경에 노출되면 catecholamine 및 cortisol 방출이 자극되며, 혈중의 cortisol과 glucose는 스트레스 반응의 지표로 널리 사용되고 있다. 본 연구에서 넙치의 혈장 cortisol 농도는 저산소가 심화됨에 따라 현저하게 증가하였으며, normoxia로 회복된 조건에서는 대조구 수준으로 급격하게 감소하였다. Barton and Iwama (1991)Wendelaar Bonga (1997)는 어류가 스트레스 환경에 노출되면 혈중 cortisol 농도는 신속히 상승하고 스트레스 요인이 해소되면 급격히 감소하지만, glucose는 cortisol 상승 후에 나타나는 생화학적 반응으로서 스트레스 요인이 해소되더라도 장시간 지속된다고 하였다. 넙치의 혈장 glucose농도는 3.5시간에 걸쳐 점진적인 저산소에 노출되는 동안에는 대조구와 차이가 없었지만 normoxia로 회복된 후에는 현저하게 상승하는 결과를 보여주었다(Fig. 7).

    이상의 결과로부터 넙치는 저산소 환경에 노출되면 산소조절자로서 대사활성을 조절하지만 점진적인 저산소 환경에서는 생리상태의 변화 및 생리적 스트레스 반응이 가중되는 현상을 확인할 수 있었다.

참고문헌
  • 1. Barton BA, Iwama GK 1991 Physiological changes in fish from stress in aquaculture with emphasis on the response and effects of corticosteroids [Annu Rev Fish Dis] Vol.1 P.3-26 google cross ref
  • 2. Dalla Via J, Van Den Thillart G, Cattani O, De Zwaan A 1994 Influence of long-term hypoxia exposure on the energy metabolism of Solea solea. II. Intermediary metabolism in blood, liver and muscle [Mar Ecol Prog Ser] Vol.111 P.17-27 google cross ref
  • 3. Fry FEJ, Hoar WS, Randall DJ 1971 The effect of environmental factors on the physiology of fish P.1-98 google
  • 4. Fu SJ, Xie XJ, Cao ZD 2005 Effect of feeding level and feeding frequency on specific dynamic action in Silurus meridionalis [J Fish Biol] Vol.67 P.171-181 google cross ref
  • 5. Herbert NA, Steffensen JF 2005 The response of Atlantic cod, Gadus morhua, to progressive hypoxia: fish swimming speed and physiological stress [Mar Biol] Vol.147 P.1403-1412 google cross ref
  • 6. Jobling M 1982 A study of some factors affecting rates of oxygen consumption of plaice, Pleuronectes platessa L [J Fish Biol] Vol.20 P.501-516 google cross ref
  • 7. Johansen JL, Herbert NA, Steffensen JF 2006 The behavioural and physiological response of Atlantic cod Gadus morhua L. to short-term acute hypoxia [J Fish Biol] Vol.68 P.1918-1924 google cross ref
  • 8. Jorgensen JB, Mustafa T 1980 The effect of hypoxia on carbohydrate metabolism in flounder (Platichthys flesus)-I. Utilization of glycogen and accumulation of glycolytic end products in various tissues [Comp Biochem Physiol B] Vol.67 P.243-248 google
  • 9. Lennard R, Huddart H 1992 The effects of hypoxic stress on the fine structure of the flounder heart (Platichthys flesus) [Comp Biochem Physiol A Physiol] Vol.101 P.723-732 google cross ref
  • 10. Maxime V, Pichavant K, Boeuf G, Nonnotte G 2000 Effect of hypoxia on respiratory physiology of turbot, Scophthalmus maximus [Fish Physiol Biochem] Vol.22 P.51-59 google cross ref
  • 11. Miller DC, Poucher SL, Coiro L 2002 Determination of lethal dissolved oxygen levels for selected marine and estuarine fishes, crustaceans, and a bivalve [Mar Biol] Vol.140 P.287-296 google cross ref
  • 12. Noga EJ 1999 Problems 1 through 9 P.55-74 google
  • 13. Peck MA, Buckley LJ, Bengtson DA 2005 Effects of temperature, body size and feeding on rates of metabolism in young of the year haddock [J Fish Biol] Vol.66 P.911-923 google cross ref
  • 14. Poon WL, Hung CY, Randall DJ, Thurston RV 2001 The effect of aquatic hypoxia on fish [Proceedings of the Sixth International Symposium on Fish Physiology, Toxicology and Water Quality] P.31-49 google
  • 15. Priede IG, Tytler P, Calow P 1985 Metabolic scope in fishes P.33-64 google
  • 16. Randall D 1982 The control of respiration and circulation in fish during exercise and hypoxia [J Exp Biol] Vol.100 P.275-288 google
  • 17. Richards JG, Richards JG, Farrell AP, Brauner CJ 2009 Metabolic and molecular responses of fish to hypoxia P.443-485 google
  • 18. Robertson L, Thomas P, Arnold CR, Trant JM 1987 Plasma cortisol and secondary stress responses of red drum to handling, transport, rearing density, and disease outbreak [Prog Fish-Cult] Vol.49 P.1-12 google cross ref
  • 19. Schurmann H, Steffensen JF 1997 Effects of temperature, hypoxia and activity on the metabolism of juvenile Atlantic cod [J Fish Biol] Vol.50 P.1166-1180 google
  • 20. Steffensen JF, Brouner CJ, Suvajdzic K, Nilsson G, Randall D 2006 Oxygen consumption of fish exposed to hypoxia: Are they all oxyregulators or are any oxyconformers? [Proceedings of the 9th International Symposium on Fish Physiology, Toxicology and Water Quality] P.239-250 google
  • 21. Steffensen JF 1989 Some errors in respirometry of aquatic breathers: how to avoid and correct for them [Fish Physiol Biochem] Vol.6 P.49-59 google cross ref
  • 22. Steffensen JF, Lomholt JP, Johansen K 1982 Gill ventilation and O2 extraction during graded hypoxia in two ecologically distinct species of flatfish, the flounder (Platichthys flesus) and the plaice (Pleuronectes platessa) [Environ Biol Fish] Vol.7 P.157-163 google cross ref
  • 23. Soldatov AA 1996 The effect of hypoxia on red blood cells of flounder: a morphologic and autoradiographic study [J Fish Biol] Vol.48 P.321-328 google cross ref
  • 24. Tallqvist M, Sandberg-Kilpi E, Bonsdorff E 1999 Juvenile flounder, Platichthys flesus (L.), under hypoxia: Effects on tolerance, ventilation rate and predation efficiency [J Exp Mar Biol Ecol] Vol.242 P.75-93 google cross ref
  • 25. Thuy NH, Tien LA, Tuyet PN, Huong DTT, Cong NV, Bayley M, Wang T, Lefevre S 2010 Critical oxygen tension increases during digestion in the perch Perca fluviatilis [J Fish Biol] Vol.76 P.1025-1031 google cross ref
  • 26. Van Den Thillart G, Dalla Via J, Vitali G, Cortesi P 1994 Influence of long-term hypoxia exposure on the energy metabolism of Solea solea. I. Critical O2 levels for aerobic and anaerobic metabolism [Mar Ecol Prog Ser] Vol.104 P.109-117 google cross ref
  • 27. Wendelaar Bonga SE 1997 The stress response in fish [Physiol Rev] Vol.77 P.591-625 google
  • 28. White A, Fletcher TC 1989 The effect of physical disturbance, hypoxia and stress hormones on serum components of the plaice, Pleuronectes platessa L [Comp Biochem Physiol A] Vol.93 P.455-461 google cross ref
  • 29. Zar JH 1984 Biostatistical Analysis P.718 google
OAK XML 통계
이미지 / 테이블
  • [ Fig. 1. ]  Schematic (not to scale) of apparatus used to measure oxygen consumption and to maintain different oxygen levels in olive flounder Paralichthys olivaceus. Arrows indicate directions of water flow. 1: PC for control and data storage, 2: DO meter and solenoid valve (SV) relay, 3: pump relay, 4: DO meter and A/D convertor, 5: oxygen probe and flow-through probe chamber, 6: circulation pump of ambient water, 7: recirculation pump, 8: flush pump, 9: respiratory chamber, 10: N2 regulator, 11: SV of air and N2, 12: disperser of air and N2.
    Schematic (not to scale) of apparatus used to measure oxygen consumption and to maintain different oxygen levels in olive flounder Paralichthys olivaceus. Arrows indicate directions of water flow. 1: PC for control and data storage, 2: DO meter and solenoid valve (SV) relay, 3: pump relay, 4: DO meter and A/D convertor, 5: oxygen probe and flow-through probe chamber, 6: circulation pump of ambient water, 7: recirculation pump, 8: flush pump, 9: respiratory chamber, 10: N2 regulator, 11: SV of air and N2, 12: disperser of air and N2.
  • [ Fig. 2. ]  Metabolic rate (MO2) data collected during 16-18 h period and used to estimate the standard metabolic rate (SMR) and routine metabolic rate (RMR) of the olive flounder Paralichthys olivaceus at normoxic water and 20℃. The horizontal dotted lines indicate SMR calculated as the mean of the six (equals 1 h) lowest measurements following the elevated MO2 by initial handling stress. The arrows represent the point in time which MO2 of the fish were stabilized after the initial stress, and numeric values are the flounder's body weight.
    Metabolic rate (MO2) data collected during 16-18 h period and used to estimate the standard metabolic rate (SMR) and routine metabolic rate (RMR) of the olive flounder Paralichthys olivaceus at normoxic water and 20℃. The horizontal dotted lines indicate SMR calculated as the mean of the six (equals 1 h) lowest measurements following the elevated MO2 by initial handling stress. The arrows represent the point in time which MO2 of the fish were stabilized after the initial stress, and numeric values are the flounder's body weight.
  • [ Table 1. ]  Normoxic SMR, RMR and critical oxygen saturation (Scrit) of olive flounder Paralichthys olivaceus exposed to normoxic and hypoxic water at 20℃
    Normoxic SMR, RMR and critical oxygen saturation (Scrit) of olive flounder Paralichthys olivaceus exposed to normoxic and hypoxic water at 20℃
  • [ Fig. 3. ]  Examples of critical oxygen saturation (Scrit) of the olive flounder Paralichthys olivaceus exposed to stepwise hypoxic water at 20℃. The total period taken for one determination of MO2 was 10 min. Data include SMR and RMR measurements in Fig. 3. Numeric values are the flounder's body weight.
    Examples of critical oxygen saturation (Scrit) of the olive flounder Paralichthys olivaceus exposed to stepwise hypoxic water at 20℃. The total period taken for one determination of MO2 was 10 min. Data include SMR and RMR measurements in Fig. 3. Numeric values are the flounder's body weight.
  • [ Fig. 4. ]  Variations in metabolic rate (MO2) of the olive flounder Paralichthys olivaceus exposed to stepwise hypoxic and normoxic water at 20℃. The MO2 was measured for 1 h and 30 min in ≥30% and 20% of oxygen saturation, respectively. The experiments were separately performed with 3 olive flounders (420.3±7.4 g in body weight). Each data point represents the mean±SD of MO2 and oxygen saturation. Different letters indicate significant differences(P<0.05) between oxygen saturation.
    Variations in metabolic rate (MO2) of the olive flounder Paralichthys olivaceus exposed to stepwise hypoxic and normoxic water at 20℃. The MO2 was measured for 1 h and 30 min in ≥30% and 20% of oxygen saturation, respectively. The experiments were separately performed with 3 olive flounders (420.3±7.4 g in body weight). Each data point represents the mean±SD of MO2 and oxygen saturation. Different letters indicate significant differences(P<0.05) between oxygen saturation.
  • [ Fig. 5. ]  Changes in blood pH and partial oxygen pressure (PO2) of the olive flounder Paralichthys olivaceus exposed to stepwise hypoxic and normoxic water at 20℃. The blood was collected after exposure for 1 h and 30 min in ≥30% and 20% of oxygen saturation, respectively. Each data point represents the mean±SD of measurements (n=5). Different letters indicate P<0.05.
    Changes in blood pH and partial oxygen pressure (PO2) of the olive flounder Paralichthys olivaceus exposed to stepwise hypoxic and normoxic water at 20℃. The blood was collected after exposure for 1 h and 30 min in ≥30% and 20% of oxygen saturation, respectively. Each data point represents the mean±SD of measurements (n=5). Different letters indicate P<0.05.
  • [ Fig. 6. ]  Changes in blood electrolyte (Na+, K+ and Cl-) of the olive flounder Paralichthys olivaceus exposed to stepwise hypoxic and normoxic water at 20℃. The blood was collected after exposure for 1 h and 30 min in ≥30% and 20% of oxygen saturation, respectively. Each data point represents the mean±SD of electrolytes (n=5). Different letters indicate P<0.05.
    Changes in blood electrolyte (Na+, K+ and Cl-) of the olive flounder Paralichthys olivaceus exposed to stepwise hypoxic and normoxic water at 20℃. The blood was collected after exposure for 1 h and 30 min in ≥30% and 20% of oxygen saturation, respectively. Each data point represents the mean±SD of electrolytes (n=5). Different letters indicate P<0.05.
  • [ Fig. 7. ]  Changes in plasma lactate, glucose and cortisol of the olive flounder Paralichthys olivaceus exposed to stepwise hypoxic and normoxic water at 20℃. The blood was collected after exposure for 1 h and 30 min in ≥30% and 20% of oxygen saturation, respectively. Each data point represents the mean±SD of measurements (n=5). Different letters indicate P<0.05.
    Changes in plasma lactate, glucose and cortisol of the olive flounder Paralichthys olivaceus exposed to stepwise hypoxic and normoxic water at 20℃. The blood was collected after exposure for 1 h and 30 min in ≥30% and 20% of oxygen saturation, respectively. Each data point represents the mean±SD of measurements (n=5). Different letters indicate P<0.05.
(우)06579 서울시 서초구 반포대로 201(반포동)
Tel. 02-537-6389 | Fax. 02-590-0571 | 문의 : oak2014@korea.kr
Copyright(c) National Library of Korea. All rights reserved.