Over recent decades, an emerging transmission technology called FACTS (Flexible Alternating-Current Transmission Systems) has been extensively employed to increase the power-transfer capability of long-distance transmission-line networks as well as for the improvement of the stability of transmission systems [1].
FACTS is an electronics-based power technology that the utility industry uses to deal with power-delivery challenges. A major thrust of FACTS technology is the development of electric-based power systems that provide a dynamic-control capability regarding the power-transfer parameters transmission voltage, line impedance and phase angle [2].
The Unified Power Flow Controller (UPFC) is used for the simultaneous and independent control of the bus voltage and the real and reactive transmission-line power flows. An additional task of the UPFC is the transmission-capacity increase that occurs as a result of power oscillation damping and loss reduction. The effectiveness of the UPFC depends on its optimal location and a proper signal selection in the power-system network.
Genetic algorithms (GAs), which are probabilistic global optimization techniques inspired by a natural-selection process and population genetics theory, provide a general architecture for the solving of complex optimization problems; actually, GAs have been applied widely in almost every field. GAs only need a fitness-function value gradient information is not necessary to guide the GA search direction [3].
This paper proposes the application of a GA method to solve the optimal UPFC-location problems for restructured power systems in consideration of the system loadability and loss reduction in the lines; therefore, the presented problem becomes a composite objective optimization problem, whereby the location and rated value of the UPFC must be determined simultaneously.
2. OPERATING PRINCIPLE OF UPFC
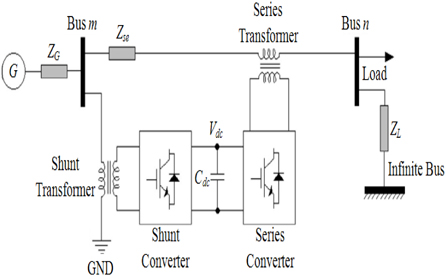
A UPFC consists of the following two voltage-sourced converters: one is connected in a shunt and the other is connected in a series. The series converter provides the main function of a UPFC by injecting an AC voltage with a controllable magnitude and phase angle in a series with the transmission line via a series-connected coupling transformer; alternatively, the basic function of the shunt converter is the supply or absorption of the real power that is demanded by the series converter at the common DC link. The shunt converter can also generate or absorb controllable reactive power and provide an independent shunt-reactive compensation for the line. Overall, the UPFC can supply real power in addition to reactive power, meaning that there is no restriction on the relative phase of the injected voltage with respect to the line current [4].
The UPFC structure is described in Fig. 1, whereby the Generator
It is therefore possible to simultaneously control all of the parameters that affect the power flow in the transmission line, i.e. voltage, impedance, and phase angle; that is, both the real and the reactive line-power flows and the voltage magnitude can be independently controlled at the UPFC terminals.
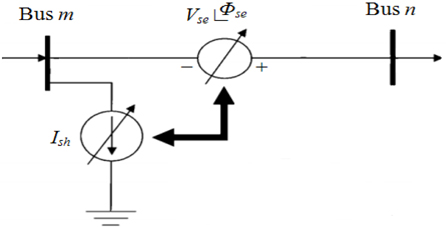
The equivalent UPFC circuit is presented in Fig. 2. The series part of a UPFC can be modeled by a controllable voltage source
3. OPTIMAL LOCATION OF UPFC DEVICES
The benefits of the optimal location of UPFC devices in terms of dynamic issues are expressed in this section. Normally, the decision to install a UPFC device often occurs at the planning stage when the system planner needs to accommodate load growth and power-plant integration; therefore, the natural question is, “Do we need to build a line or can we do it with a UPFC device?” We therefore initially focused on the UPFC as a loadability tool.
Regarding the optimal location for a UPFC device, the device must be placed on the bus that is most affected when defects must be identified. With increased-load transmission lines and distribution, voltage instability becomes a serious problem for the planners and managers of a power network. The main challenge of this problem is the refinement of the places where voltage instability could be initiated and gaining an understanding of the problem origin. An effective method (GA) for the refinement of a workspace involves the identification of the low buses (branches) in a system that are most likely to cope with a voltage collapse.
4. GENETIC ALGORITHM FOR OPTIMAL LOCATION OF UPFC DEVICES
GAs are global search techniques that are based on the mechanism of natural selection and genetics. Without any prior knowledge of the objective (fitness) function a GA can search several possible solutions simultaneously. GAs are best suited for complex problems; moreover, they produce high quality solutions.
A GA starts with the random generation of an initial population, followed by reproduction, crossover, and mutation operations that are carried out until the best population is found. A GA is a simple and practical algorithm that can be easily implemented in a power system [7].
The total number of UPFCs that can be inserted in a power system is limited, due to the cost of the devices and the influences on the operating characteristics of the power system. A GA is governed by the following three factors: mutation rate, crossover rate, and population size. A GA is a search process that can be applied to constrained problems; the constraints may be included in the fitness function as added penalty terms.
In this algorithm, the following optimization issues must be noted:
· Location of UPFC: No more than one UPFC can be installed in one branch of power-flow computations. · Control parameters: The performance of the GA depends on the control parameters such as population size, crossover probability, and mutation probability; therefore, the selection of the proper values of the GA parameters has a major effect on the attainment of the optimum solution [3,8].
The aim of optimization is to perform the most effective utilization of the transmission lines. In this respect, the location of the UPFC device is for the maximization of the system loadability while the thermal and voltage constraints are also observed; that is, in terms of branch loading and the voltage levels, the holding power system is in a security state to maximize the power that is transmitted by the power system to the customers.
The objective function is designed to penalize the UPFC configurations that lead to overloaded transmissions lines and over- or under-voltage at buses.
To achieve our objective, the load factor
First, the generating powers of the generation buses were modified according to (1), as follows:

where
Then, for the load buses (

where
At each iteration, according to (1) and (2), the load factor was increased and the optimization constraints are the following: the verification of the bus-voltage violation and branch loading. When it is no longer possible to satisfy the constraints, the maximum loadability has been reached; in fact, this is a multi-stage greedy algorithm that follows the solving heuristic where the locally optimal choice is made at each stage in the hope of finding a global optimum.
The corresponding objective function that maximizes the power-system loadability could be formalized as follows:

To simplify the enforcement of the process constraints while the UPFC devices are placed at random locations, let us define a fitness function
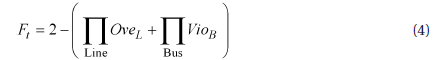
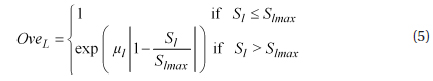

where the parameters
If the constraints are fulfilled, then each of the fitness-function terms in
5.3 Optimization strategy using GA
The number of individuals

where

where
The parameters of the GA are set as follows: population size = 120, crossover probability = 0.9, and mutation probability = 0.1.
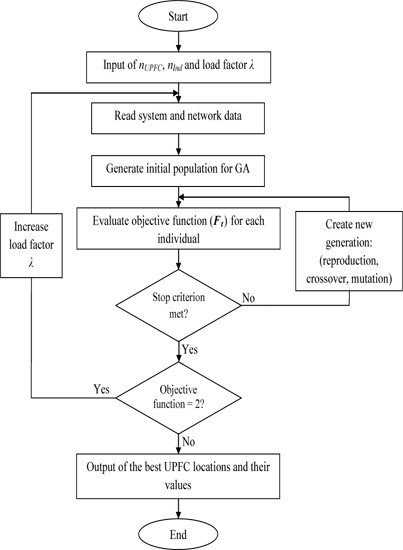
The optimization strategy is summarized in Fig. 3.
To verify the performance of the GA method, a number of UPFC-device combinations were optimally positioned on different IEEE test networks, and the chosen test systems are IEEE 14 Bus, 30 Bus, and 57 Bus.
The allocation results are presented in Table 1.
[Table 1.] UPFC-device-location results for the selected networks.
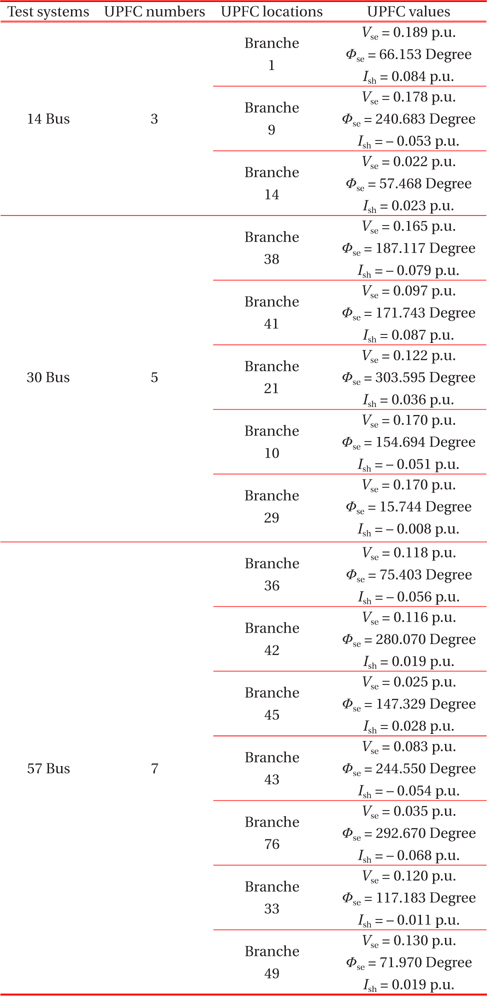
UPFC-device-location results for the selected networks.
We found the figures that show the following variations:
· Influence of UPFC devices on bus voltages · Total line losses of the power system for different system loadabilities
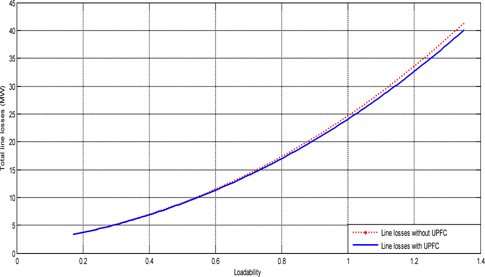
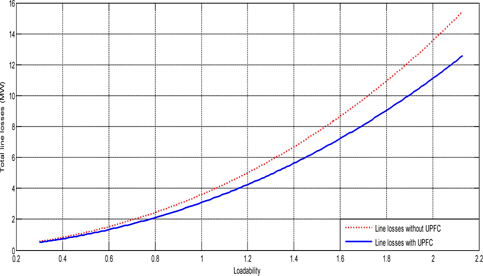
All of the simulation results from before and after the use of the UPFC devices for the selected test systems are shown in the figures below.
(1) For the 14 Bus test system:
- Total number of locations is 20 - Line losses without UPFC are 64 MW - Line losses with UPFC are 61 MW
(2) For the 30 Bus test system:
- Total number of locations is 41 - Line losses without UPFC are 10 MW - Line losses with UPFC are 8 MW
(3) For the 57 Bus test system:
- Total number of locations is 80 - Line losses without UPFC are 391 MW - Line losses with UPFC are 149 MW
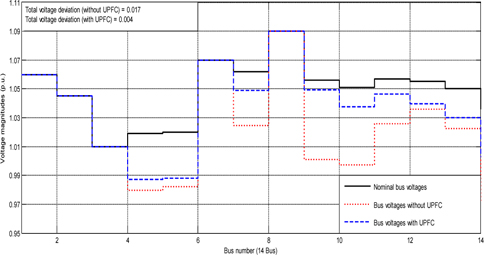
According to Table 1, the locations of the UPFC devices in the IEEE 14 Bus network show that the most sensitive buses are 1 bus, 9 bus, and 14 bus (these voltage buses have exceeded their lower limits). To avoid this problem, we selected 1 bus, 9 bus, and 14 bus as reinforcement places by installing three UPFC devices at these points.
After the installation of five UPFCs devices at the optimal locations with the corresponding rated values in the 30 Bus test system, we observed an improvement of the system loadability, meaning that a significant reduction of the transmission losses occurred and all of the security constraints had been fulfilled.
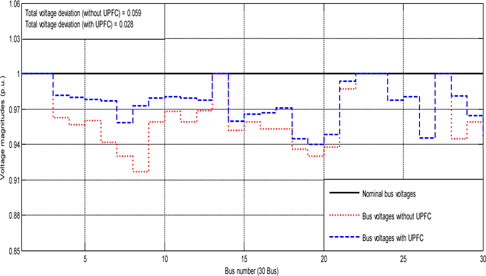
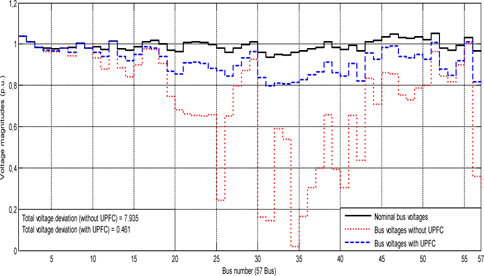
For the case study of the 57 Bus test system, the voltage gaits that are presented in Fig. 8 show that, under the same load-capacity conditions, the network without the UPFC has a greater voltage drop in the buses. The results of Fig. 8 confirm the significant influence of the UPFC in the maintenance of the bus voltages within acceptable ranges.
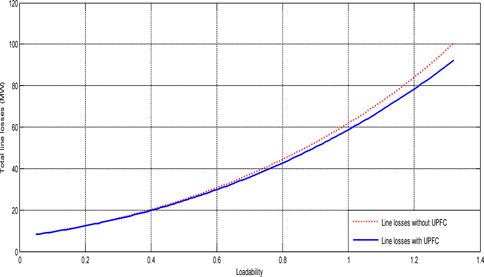
The figures that illustrate the variation of the total line losses according to the load factor show that the appropriate control of the UPFC devices reduces systemic losses. From the obtained results, the efficiency of the UPFC appears clearly on the long networks.
Notably, the limited number of UPFC devices is less than half the number of independent network meshes, and the 57 Bus test network serves as an example (number of branches − number of buses + 1 = 80 − 57 + 1 = 24 UPFC devices) [10].
As previously mentioned, FACTS devices are presently considered a competitive solution for the needs of power systems. To date, many studies have proven that the use of FACTS devices can contribute greatly to solutions for the fresh problems that are derived from the liberalization of electricity markets, thereby minimizing the costly capital investments that are required for new lines. Although there are several types of FACTS devices that can be used for the control of the power flow and voltage profile in a power system, the attention of this study is focused mainly on UPFC devices. The proper placement of FACTS devices is very important for the rapid and successful operation of a power system because of the high cost and the circuit complexities.
In this paper, the effectiveness of the optimal location and sizing of UPFC devices to minimize losses is proposed. A UPFC can control the voltage magnitude, voltage phase angle, and impedance. The advantages of the GA method are an effective searching ability for the identification of optimum solutions and its accuracy. It has been verified that the use of UPFC devices decreases voltage deviations and minimizes real systemic power losses.