Many countries around the world are facing the growing risks of more frequent and severe power shortages over the next decade. The development of energy storage technology has emerged as a potential solution to this issue. The use of ion batteries based on silver vanadium oxides (SVOs) is one possible solution. They are being extensively researched owing to their novel electrical, optical, magnetic, and ionic properties, and their applications for devices such as cathodic electrodes for lithium batteries, gas sensors, photocatalysts, and implantable cardioverter deflbrillators (ICDs) [1-4]. β-AgVO3, a typical SVO compound, has potential applications in high-energy lithium batteries due to its high specific capacity of 302 mA h g-1 and good rate dischargeability [5]. Its properties, however, are strongly dependent on the synthesis method used, and its size, morphology, crystal structure and surface properties. L.Q. Mai et al. [6] prepared AgVO3 nanowires with a 1st and 20th capacity of 211 and 131 mAh g-1, the latter number representing 62% capacity retention after 20 cycles. S.Y. Zhang et al. [5] reported a novel hydrothermal method for preparing β-AgVO3, showing 1st and 20th capacities of 302 and 90.6 mAh g-1, with only 30% capacity retention after 20 cycles. S. Liang et al. [7] reported simple synthesis using a soft chemical method without a template. R. Leising et al. [8] discussed the effect of different SVO structures on the final electrochemical properties.
In this paper, we report the development of an efficient and scalable strategy for the synthesis of β-AgVO3 nanorods via a chemical method followed by heat treatment. The physical characteristics and electrochemical properties of β-AgVO3, such as morphology, capability, and cyclability of the positive electrodes in lithium ion batteries, are discussed.
All reagents employed in this study were of analytical grade and were used without further purification. β-AgVO3 nanorods were synthesized using a soft chemical method followed by heat treatment using the following materials: NH4VO3 (Aldrich Co., purity: 99.95%), H2O2 (Aldrich Co., purity: >99%), and AgNO3 (Aldrich Co., purity: >99.999%). The procedures were carried out as follows. First, 4 mmol NH4VO3 was mixed with 10 mL H2O2 and stirred at room temperature for 10 min. A colorless, homogeneous mixture resulted. Then, 10 ml AgNO3 was added to the mixture and stirred rigorously. After 10 min stirring, an orange precipitate appeared. After 6 h stirring, a red precipitate was obtained. The obtained mixture was heat-treated at 500℃ for 2 h before being used for cathode fabrication [7].
β-AgVO3 nanorod electrodes were fabricated using the asprepared cathode materials, carbon black (SP-270), and polyvinylidene fluoride (PVDF) in a weight ratio of 70:25:5. This composite was used to evaluate its electrochemical properties. The obtained slurry was coated onto Al foil and dried at 90℃ for 1 h. The coated electrode film was then roll-pressed. Prior to use, the electrodes were dried again at 110℃ for 24 h under vacuum. Coin-type cells (CR2032) were assembled in an argon-filled glove box using lithium metal as the anode and 1 M LiPF6/EC-DMC (1:1) as the electrolyte.
The crystal structures and morphologies of the synthesized β-AgVO3 nanorod composites were characterized using high-resolution X-ray diffraction (HR-XRD, D/MAX Ultima III, Rigaku, Japan) with scanning steps of 0.02° over the range of 20°~80°, and field emission scanning electron microscopy (FE-SEM, Hitachi, Japan).
Cyclic voltammetry (CV) was performed at a scanning rate of 0.1 mV s-1 in the voltage range of 1.5~4.0 V. Electrochemical impedance spectra (EIS) of the β-AgVO3 nanorod composites were recorded from 2 MHz to 100 mHz using an impedance measurement system (ZAHNER IM6, Germany). The charge-discharge cycle performance of the cells was evaluated using a galvanostatic charge-discharge unit battery cycler (WBCS-3000, Wonatech, Korea) in the voltage range of 1.5~3.5 V at 25℃.
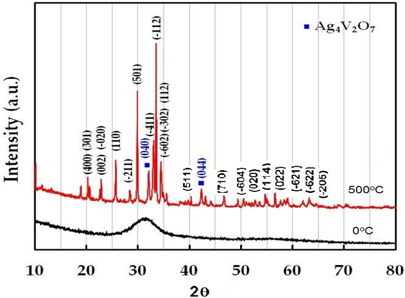
Figure 1 represents the powder-XRD patterns of as-prepared β-AgVO3 nanorods before and after heat treatment. The observed XRD refiections are indexed according to the monoclinic β-AgVO3 phase (space group: I2/m (12), JCPDS card no. 29-1154.) No peaks from other phases were detected except for two very small peaks assigned to Ag4V2O7, indicating the high purity of the product. The strong three-dimensional network of V4O12 double chains is isolated in β-AgVO3, held together by AgO6 octahedra and firmly interlinked by Ag2O5 and Ag3O5 square pyramids [9].
Dissolving NH4VO3 in H2O2 solution is easier than in deionized water at room temperature, and no precipitates form. The dissolution of NH4VO3 in H2O2 solution produces a peroxovanadate solution. The decomposition reaction of peroxovanadate can be catalyzed by Ag+ ions upon introduction of aqueous AgNO3 into the reaction system, which produces O2 microbubbles and the VO3- ion. NH4+ ions do not react with NO3- ions in aqueous solution but remain in solution as separate ions, whereas Ag+ ions and the [VO2(O2)2]3- ion can react with each other as shown in Eqs. (1) and (2).


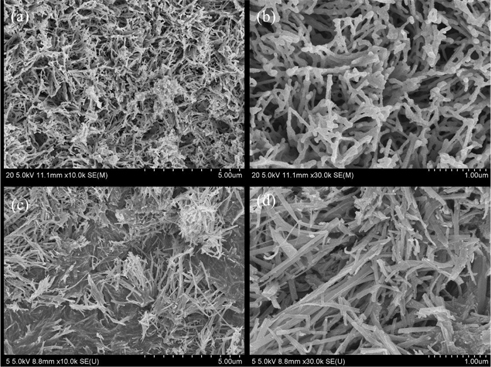
The morphology of the β-AgVO3 nanorod before and after heat treatment was observed by FE-SEM (Fig. 2). As shown in Fig. 2(a-b), a large number of nanowires with lengths of about several macrometers are distributed homogeneously. This result indicates that a significant proportion of the product exists in a long, wire-like morphology. After heat treatment at 500℃, they were converted to nanorod morphology and more homogeneously separated with more agglomeration as shown in Fig 2(c-d). The nanorods with smooth surfaces are very uniform with diameters of about 100~200 nm and lengths of the order of several macrometers. It is believed that an improvement in their morphology will lead to an increase in the electrochemical performance of β-AgVO3 nanorods.
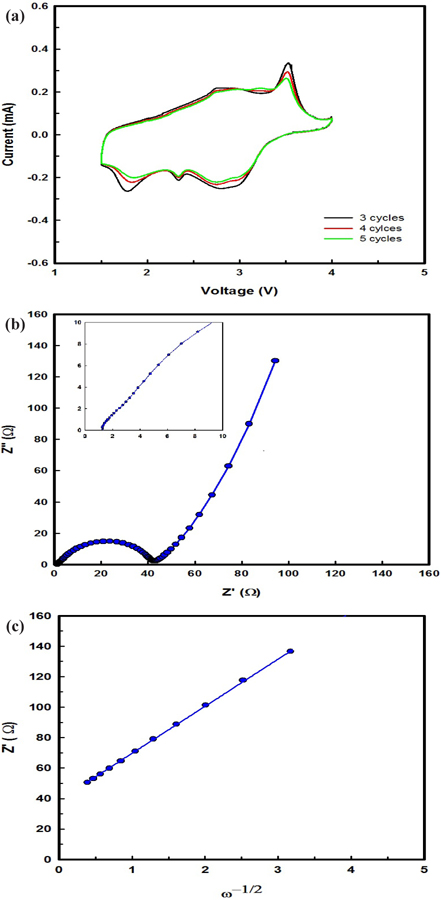
The CV at a scanning rate of 0.1 mV s-1 with the EIS after 2 cycles of β-AgVO3 battery operation are shown in Fig. 3(a). A set of oxidation and reduction peaks typical for Ag+/Ag and V5+/V3+ in the β-AgVO3 battery are clearly seen in every curve, indicating that there is only one well-defined step in the electrochemical process, i.e., oxidation-reduction, for β-AgVO3. The oxidation peaks of the β-AgVO3 battery were reached at 2.75 and 3.58 V, where the reduction peaks of the β-AgVO3 battery were at 1.78, 2.35, and 2.85 V.
The impedance spectra of the β-AgVO3 electrodes after 20 cycles are shown in Fig. 3(b). The impedance spectra are composed of a semicircle, which is assigned to the charge-transfer impedance of the electrode, and an inclined line, indicating the Warburg impedance, which is related to lithium ion diffusion in the particles. As can be seen from Fig. 3(b), the charge-transfer impedance of β-AgVO3 was 42 Ω, indicating its superior suitability for diffusion of lithium ions. The lithium ion diffusion coefficient is calculated by Eq. (3).

where n is the number of electrons per molecule during the oxidization, A is the surface area of the cathode, D is the diffusion coefficient of the lithium ion, R is the gas constant (8.3144621 J mol-1 K-1), T is the absolute temperature, F is the Faraday constant (96,485 C/mol), C is the concentration of lithium ion, and σ is the Warburg factor which is interdependent on Z' (Eq. (4)).

The interdependence between Z’ and the root square angular frequency ω-1/2 in the low frequency region are illustrated in Fig. 3(c). Straight lines imply diffusion of lithium ions into layers in the electrode. The lithium ion diffusion coefficient is calculated from Eqs. (3) and (4), and Fig. 3(c). β-AgVO3 showed a lithium ion diffusion coefficient of 1.65 × 10⁻¹³ cm2 s-1, indicating its superior suitability for cycling performance in a battery.
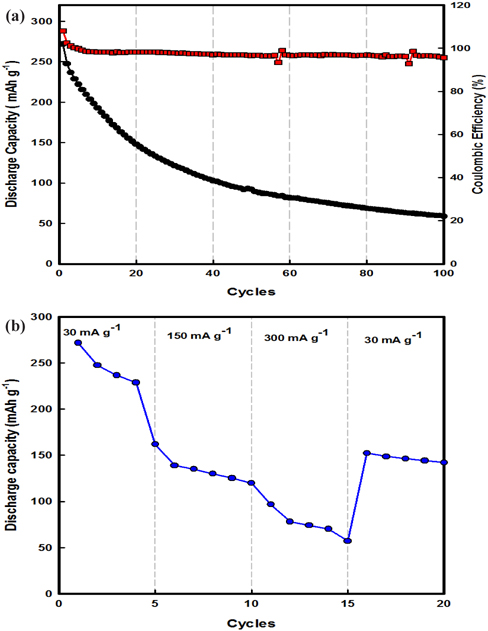
Figure 4(a) illustrates the cycling performance of a β-AgVO3 battery charged-discharged at 30 mA g-1 at 25℃. In the voltage range of 1.5~3.5 V, the discharge capacities of the β-AgVO3 battery at the 1st and 100th cycles were 275 and 51 mAh g-1, respectively. More interestingly, the β-AgVO3 battery exhibited good cycling performance in terms of both discharge capacity and stability with coulombic efficiency of 98%. These numbers mean that the intercalation/deintercalation of lithium ions into the active material within β-AgVO3 occurred more easily during the charging-discharging process. Furthermore, Fig. 4(b) shows the rate capacity results for β-AgVO3 at 25℃. At a low current density of 30 mA g-1, the discharge capacity exhibited for β-AgVO3 was 275 mAh g-1. On increasing the current density to 300 mA g-1, the discharge capacity slightly decreased to 60 mAh g-1 after 15 cycles. When the current rate was lowered back to 30 mA g-1, the discharge capacity rebounded to about 150 mAh g-1, showing good electrochemical reversibly. These results are better than previously published results [6-8].
In summary, β-AgVO3 nanorods were successfully synthesized using a soft chemistry route followed by heat treatment. The observed XRD refiections were indexed to the monoclinic β-AgVO3 phase (space group: I2/m). The nanorods with a smooth surface are very uniform, having diameters of 100~200 nm and lengths of the order of several macrometers. In the voltage range of 1.5~3.5 V, the discharge capacities of the β-AgVO3 battery at the 1st and 100th cycles were 275 and 51 mAh g-1 with a coulombic efficiency of 98%, respectively. β-AgVO3 also showed superior C-rate performance. These results suggest that β-AgVO3 nanorods are good candidates for use as lithium ion battery cathodes.