Measurements of surface color have been developed to quantify color stimulus based on understanding of human color perception. For fundamentals of colorimetry, the Commission International de l’Eclairage (CIE) defined the standard physical data of illuminants and the standard observer data on spectral sensitivities of human eyes. [1] With these bases and surface reflectance of an object, the surface color of the object is quantified and described. The CIE tristimulus values were defined as basic quantities to describe color stimulus, and various chromaticity coordinates and color spaces were developed for its better description. In particular, much attention has been paid to mathematical models describing colors and color differences to be analogous to those that a human perceives, which results in the uniform color spaces of CIE (L*a*b*) and CIE (L*u*v*) and the color-difference formula of CIEDE2000. [1, 2] With these mathematical models, various methods and instruments for measuring surface color were developed and disseminated to the color industry. [2-4] Also, as novel material technology has grown and its application has extended to commercial products to cause complex color perception such as gloss, pearlescence, texture, and goniochromatism, new measurement techniques have been developed to characterize material properties with relevance to the complex color perception. [5-8] On account of such development of colorimetry and its industrial applications, surface color measurements have been investigated in terms of an uncertainty. An uncertainty in surface color measurements is interpreted as a detection threshold of color difference, .i.e., it is analogous to the color discrimination of human eyes. However, a few publications report correlations among spectral components in detail, although an intrinsic spectral overlap of color stimulus causes a correlation and makes a large contribution to an uncertainty of surface color. [9, 10]
In this paper, we present an uncertainty analysis on spectroreflectometric surface color measurement. We focus on where an uncertainty occurs in a spectro-reflectometric measurement and how the uncertainty propagates to surface color. First, we introduce quantities and formulas of surface color in Section 2.1. and explain measurement methods of a color-filter-employed method and a spectro-reflectometric method in comparison with each other in Section 2.2. In Section III, we explain an uncertainty analysis of surface color. We derive relations between the quantities of surface color and relations between uncertainties of surface color and those of spectral reflectance corresponding to the measurand of a spectro-reflectometric measurement in Sections 3.1. and 2. We refer to ref. [9] in dealing with correlations among spectral components. An uncertainty evaluation method for spectro-reflectometric measurements is described in Section 3.3. In Section IV, we perform spectro-reflectometric surface color measurements for various color plates as an experimental example. Quantities and uncertainties of surface color are determined and analyzed with the measurement results of spectral reflectance.
2.1. Quantities of Surface Color
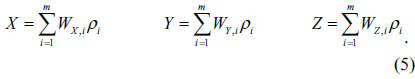
Human eyes respond to visible electromagnetic radiation in a wavelength range from 360 nm to 830 nm. When light enters an eye, the light is converted into electrical signals by photoreceptors on the retina and the signals are transmitted to the brain via optic nerves. Among two types of photoreceptors, i.e. cones and rods, cones are mainly responsible for color perception due to three cone types with different spectral sensitivities. The three cone types are called long-, middle-, and short-wavelength sensitive cones, respectively, according to their positions of spectral sensitivities in the visible wavelength range. Humans perceive two stimuli as identical color when the two stimuli activate cones to make the same signals. [11] The CIE defines tristimulus values on color stimulus as sums of products of the CIE color matching functions and color stimulus functions at each wavelength in the entire visible wavelength range from 360 nm to 830 nm as follows:
Here,
Chromaticity coordinates were developed to transform the tristimulus values into two-dimensional coordinates. The CIE 1931 chromaticity coordinates (
With this transformation, two-dimensional description of chromaticity is possible using (
The CIE recommends uniform coordinates in cases where a perceptually uniform color space is required. [1, 2] Among uniform color spaces, the CIE 1976 (
Here,

where
There are two methods in measuring surface color. One uses color filters to mimic a colorimetric observer so that it directly determines tristimulus values. The other is a spectro-reflectometric measurement, which measures spectral reflectance and determines tristimulus values as well as chromaticity coordinates through the calculations of Eqs. (1)~(4). The color-filter-employed method is practical in field experiments, because the equipment, which consists of a color-filter set and a light source, is small, easy to use, and rapidly operating. However, the color-filter-employed method is inferior to the spectro-reflectometric method in precision and accuracy. Furthermore, the spectro-reflectometric method is advanced in determining chromaticity coordinates under any pair of an observer and an illuminant as being based on a spectral reflectance measurement, whereas the color-filter employed method is restricted to a specified pair of an observer and an illuminant. In the following chapter, we evaluate a measurement uncertainty of surface color through an analysis of a spectro-reflectometric measurement.
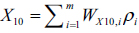
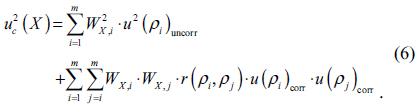
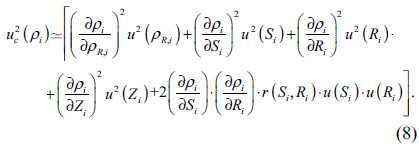
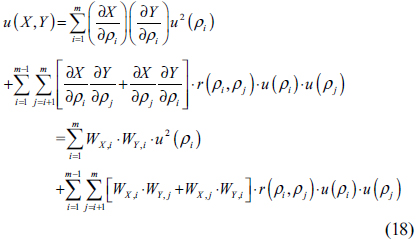
To evaluate uncertainties of the tristimulus values, we analyze uncertainties of the spectro-reflectometric measurement and their propagation to the tristimulus values. The tristimulus values of (
Here,

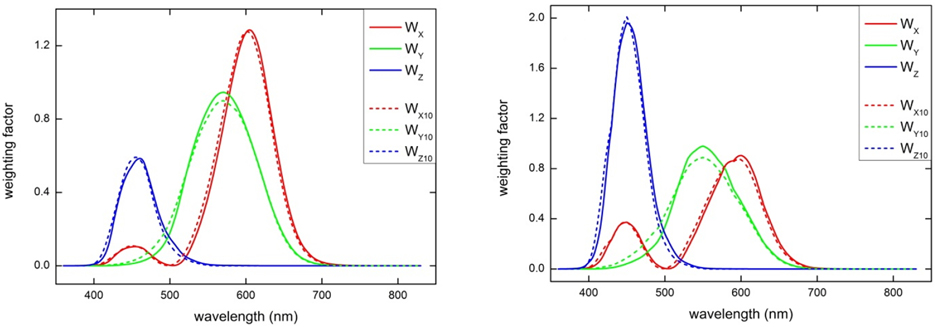
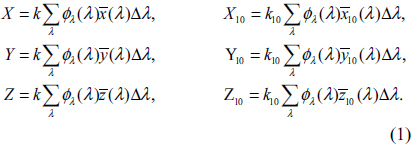
In Fig. 1(a) and (b) are plotted the weighting factors as a function of wavelength for the CIE illuminants A and D65, respectively. A combined standard uncertainty of a tristimulus value

Here,
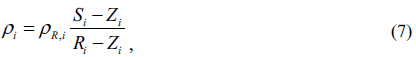
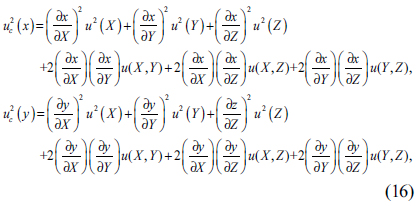
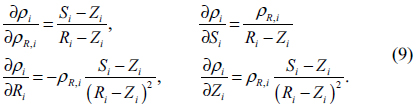
Let us look at a spectro-reflectometric measurement to analyze uncertainties of the tristimulus values. Spectral reflectance of a sample is determined by comparison with that of a reference reflectance standard such as polytetrafluoroethylene (PTFE) or pressed barium sulphate plates. Therefore, a mathematical model of a spectro-reflectometric measurement is given by

where
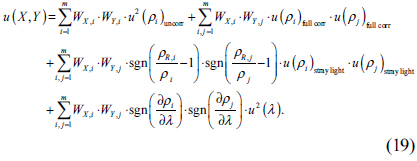
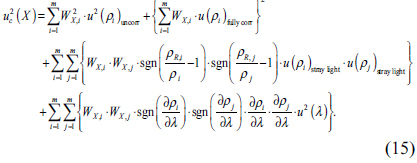
Here, the correlation of
The uncorrelated uncertainty
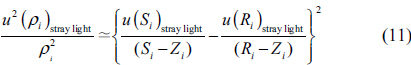
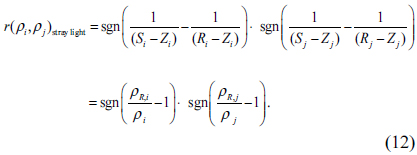
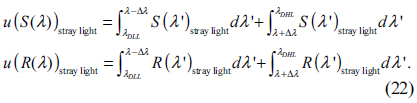
Stray light contributes to both the signals of a sample and that of a reference, and the uncertainties are considered to be fully correlated. Therefore, an uncertainty of stray light

with stray light uncertainties of signals,

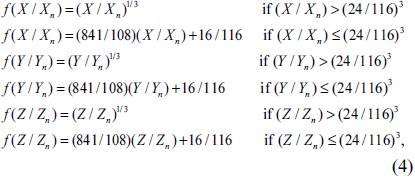
Here, sgn(
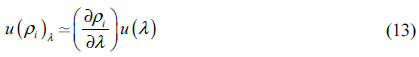
Wavelength inaccuracy of equipment effects all spectral measurements over the entire wavelength range. An uncertainty of spectral reflectance originated from wavelength inaccuracy,

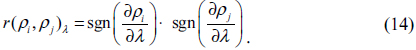
A correlation among wavelength components depends on variation of spectral reflectance with wavelength change; the correlation coefficient between two wavelength components is approximated as +1, −1, or 0, for increase, decrease, or zero contribution to reflectance variation, respectively, since wavelength inaccuracy has systematic components such as a wavelength offset. [9] So, the correlation coefficient

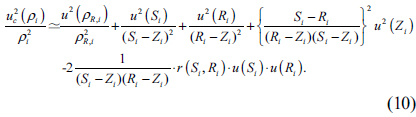
Using the Eqs. of (11)~(14), Eq. (6) of
Here,
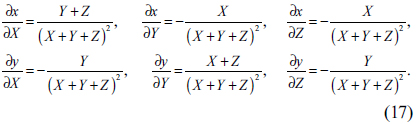
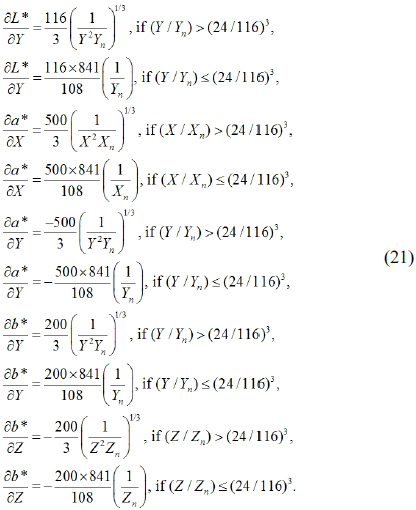
Uncertainties of the chromaticity coordinates are obtained from those of tristimulus values according to the error propagation formula. [12] By differentiating Eq. (2), the uncertainties of the CIE 1931 (

where the sensitivity coefficients correspond to
And the covariance of
is expressed with Eq. (19), depending on the type of the correlation coefficient:

The covariance of
The uncertainties of CIE 1976 (
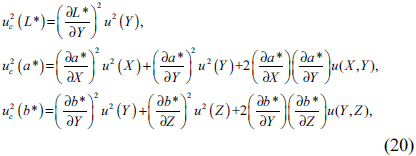
with the sensitivity coefficients of
3.3. Uncertainty Evaluation of Spectral Reflectance
In the previous sections we looked into how uncertainties of spectral reflectance propagate into tristimulus values and chromaticity coordinates. In this section, we introduce evaluation methods of uncertainties in spectral reflectance measurements. First, we evaluate an uncorrelated uncertainty
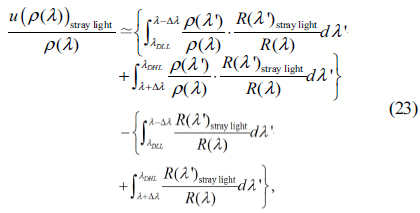
Next, we evaluate an uncertainty of stray light
Here,

and simplified as Eq. (24) with an assumption that the uncertainty of stay light
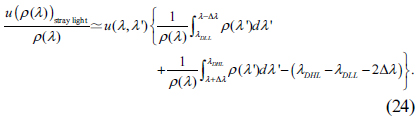
Here,
IV. EXAMPLE OF SURFACE COLOR MEASUREMENT
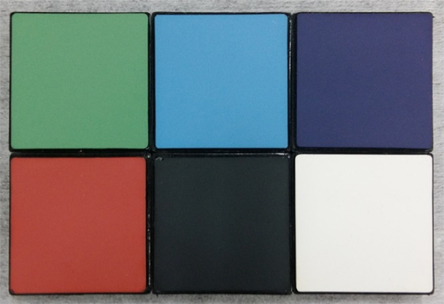
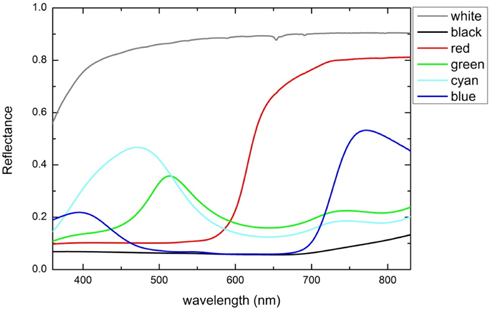
In this chapter, we show an example of surface color measurements. We used a spectrophotometer (Lambda1050, Perkin Elmer) for the spectro-reflectometric measurement. Spectral reflectance of a sample was determined to be relative to a reference standard with 99% reflectance (Spectralon, Labsphere), which was calibrated traceable to the KRISS spectral reflectance scale. We summarize the uncertainties of the spectro-reflectometric measurements in Table 1. We note that we exclude the uncertainty terms of sample non-uniformity, misalignment between sample and reference, and measurement repeatability in the Table 1, since they depend on a sample and a signal magnitude. Figure 2 shows samples of matte color plates (Ceramic colour standard, Ceram). We measured spectral reflectance under a reflection measurement geometry of 8°:de, i.e., light was incident at 8° and reflected flux was collected hemispherically using an integrating sphere with specular reflection excluded. [1]
[TABLE 1.] Uncertainties of spectro-reflectometric measurement
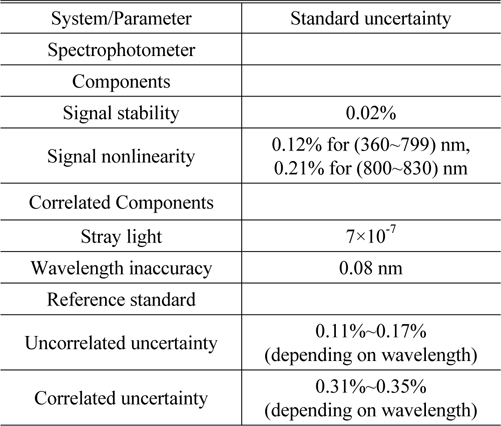
Uncertainties of spectro-reflectometric measurement
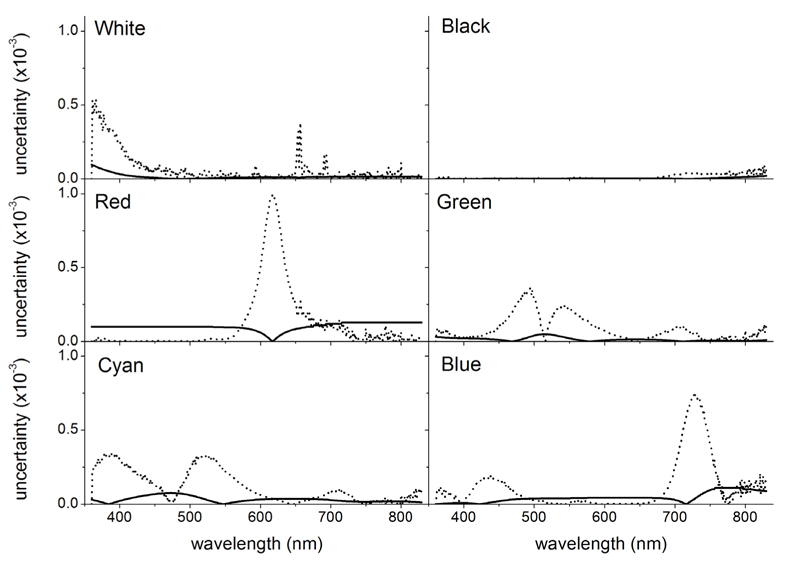
In Fig. 3 are plotted the measured data of white, black, red, green, cyan, and blue color plates, and in Table 2 are summarized the uncertainties described in Section 3.3. Signal noise is the dominant source in the uncorrelated uncertainty so that the black plate with a small signal-to-noise ratio shows the larger uncorrelated uncertainty. Similarly, the red and blue plates with partially low reflectance have large uncorrelated uncertainty in a wavelength range under 550 nm and from 500 nm to 670 nm, respectively. For the fully correlated uncertainty, systematic effects of a reference standard measurement contribute dominantly so that the samples show equal uncertainty of 0.3%~0.4%, which depends on wavelength. The uncertainties of stray light and wavelength inaccuracy vary depending on the spectral shape of reflectance. Figure 4 shows the uncertainty of stray light (solid curve) and the uncertainty of wavelength inaccuracy (dashed curve) as a function of wavelength for each sample. As shown in Figs. 3 and 4, the contribution of stray light becomes large when a sample has large variance in spectral reflectance, which is verified in the cases of red and blue plates. The uncertainty of wavelength inaccuracy is large when a sample has rapidly-changing slope in spectral reflectance, which is revealed at the red and the blue plates.
[TABLE 2.] Uncertainties of spectral reflectance
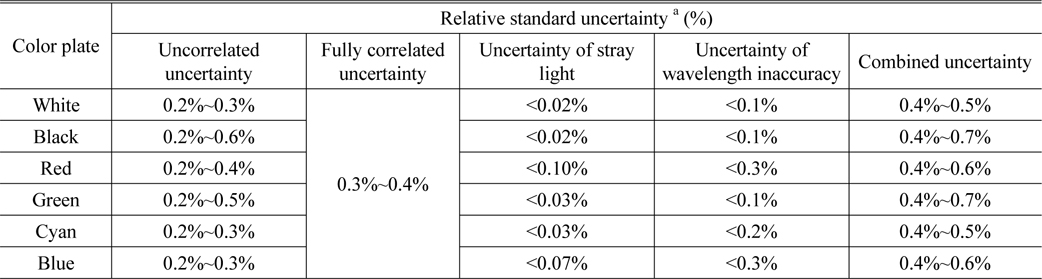
Uncertainties of spectral reflectance
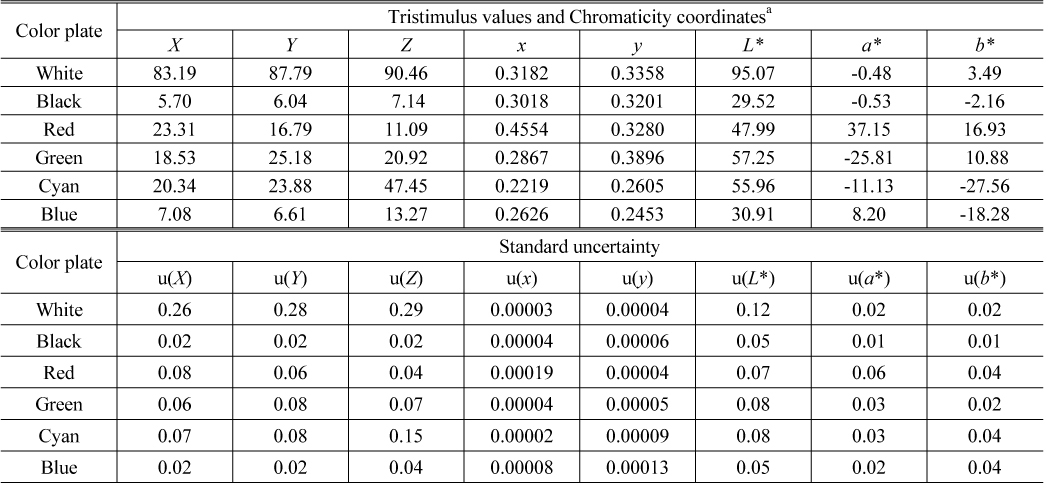
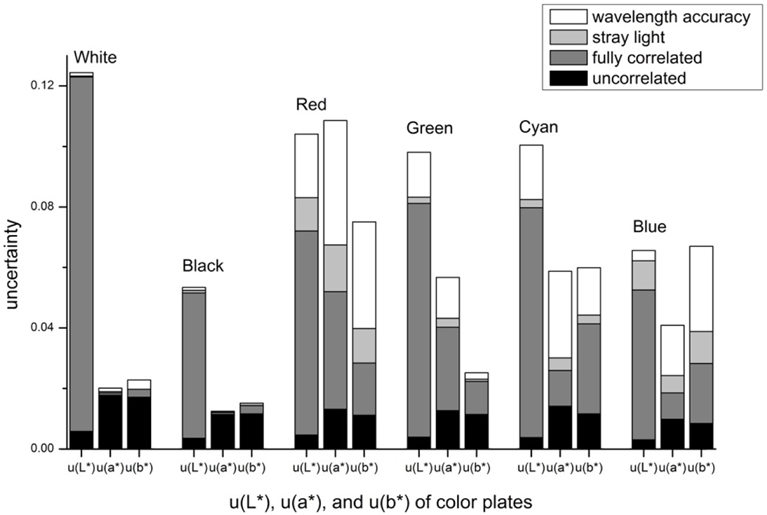
With these measured data, we calculated the tristimulus values and the chromaticity coordinates for the CIE D65 illuminant and the CIE 1931 standard colorimetric observer according to the equations in Section 2.1. and the uncertainties using the equations derived in Section 3.1. and 2, which are summarized in Table 3. In order to look into the uncertainty of each color plate, uncertainty components of CIE 1976 (

Values and uncertainties of tristimulus values and chromaticity coordinates for color plates
In summary, we investigated how a spectral reflectance measurement determines surface color with focus on an analysis of an uncertainty. Since surface color possesses correlations among wavelength components which arise from spectral shapes of color matching functions, we divided the uncertainty terms by their correlations, i.e., an uncorrelated uncertainty, a fully correlated uncertainty, and a correlated uncertainty with spectrally varying correlation. The latter one includes uncertainty components of stray light and wavelength inaccuracy, of which correlations depend on difference in reflectance between a sample and a reference standard, and the slope of spectral reflectance, respectively. In order to show an example in practice, we performed spectro-reflectometric measurements for ceramic colour standards using a spectrophotometer and a reference standard calibrated traceable to the KRISS spectral reflectance scale. With determination of the uncertainty of spectral reflectance, we showed how the uncertainty of spectral reflectance propagates to that of surface color. It is expected that this thorough study for surface color measurements should provide reliability to color application techniques and allow effective approach to complex color measurements.