Insects, which account for more than 80% of all animal species, live and breed in a variety of habitats. Heterothermic insects are especially sensitive to changes in habitat temperature, and are found in extremely low and high temperature environments. Their bodies possess the inherent ability to adapt to the environment (Chown
Typically, these previous studies used cultured insect cells, such as the S2 cell line of
RNA interference (RNAi) is a biological process in which RNA molecules inhibit gene expression, typically by causing the destruction of specific mRNA molecules, and has been used for applications in gene precise function analysis, gene inhibition mechanism analysis, and gene therapy (Daneholt
The present study used the BmN-SID-1 (Kobayashi
>
Insect cell culture and treatment temperature
The
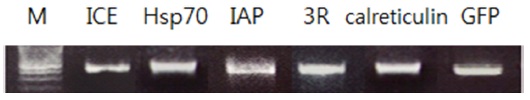
IAP-1 (Inhibitor of Apoptosis Protein-1), GFP (Green Fluorescent Protein), 3R*, and Calreticulin were synthesized at 60℃ for 30 s, 72℃ for 70 s (5X), 94℃ for 30 s, 68℃ for 30 s and 72℃ for 70 s. To create dsRNA of these genes, a PCR cycle was run 30 times at 94℃ for 30 s with the T7 promoter attached to the 5′ end of the T7 promoter-terminal primer (MEGAscript RNAi kit, Ambion). Each gene synthesized was ~300–500 bp in size (Fig. 1). The dsRNAs were then transfected into BmN4 with FuGENE HD (Promega, USA) and BmN-SID-1 was soaked with dsRNA alone.
*: Novel gene selected by subtraction and low temperature specific gene
>
RNA extraction and semi-quantitative PCR
The samples were centrifuged for 15 min at 15,000 rpm, 4℃, after being dissolved in trizol (Ambion). Next, chloroform was added (200 μL) and the samples were centrifuged for 15 min at 15,000 rpm. Isopropanol (500 μL) was then added to the supernatant. After washing with 70% ethanol, the precipitate was centrifuged for 5 min at 15,000 rpm and was dissolved in 0.1% DEPC DW (10 μL) and stored until use at –80℃. In order to determine the expression level of the gene by using Gene Specific Primer (GSP; Table 1), we performed the following PCR protocol: 94℃ 30 s, 55℃ 30 s, and then amplified 23 times, followed by 72℃ 30 s 3 stage. Amplification was confirmed using agarose gel electrophoresis, using 2% EtBr.
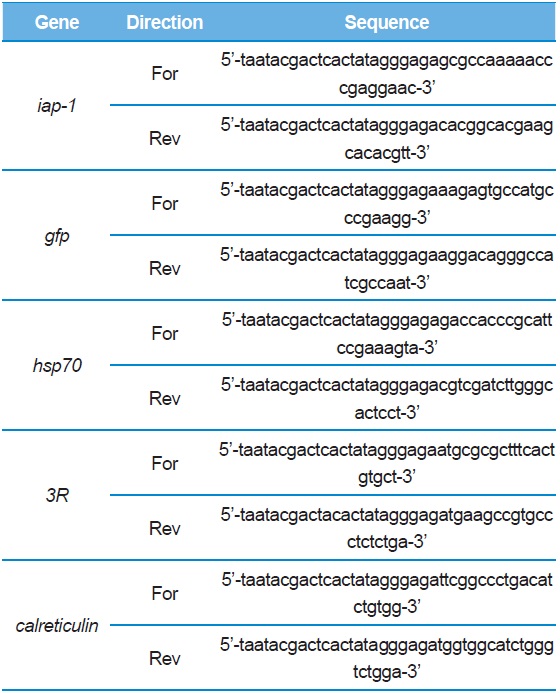
[Table 1.] Primers used in this study.

Primers used in this study.
>
MTS assay and Trypan blue staining
Cells were plated (100 uL), at 60%–70% of the cell culture area, then 20 μL of 3-(4,5-dimethylthiazol-2-yl)-5 (3-carboxymethonyphenol)-2-(4-sulfophenyl)-2H-tetrazolium (MTS) (Promega, USA) was added to each well of the plate and was incubated for 24 h at 27℃. Plates were read directly at 492 nm using a microplate reader. The plates were also examined under the microscope under 10X and 20X after being treated with 0.5% (4 μL) Trypan blue (Olympus, JP/CKX41SF).
I-1. RNAi effect of different amounts of dsRNA
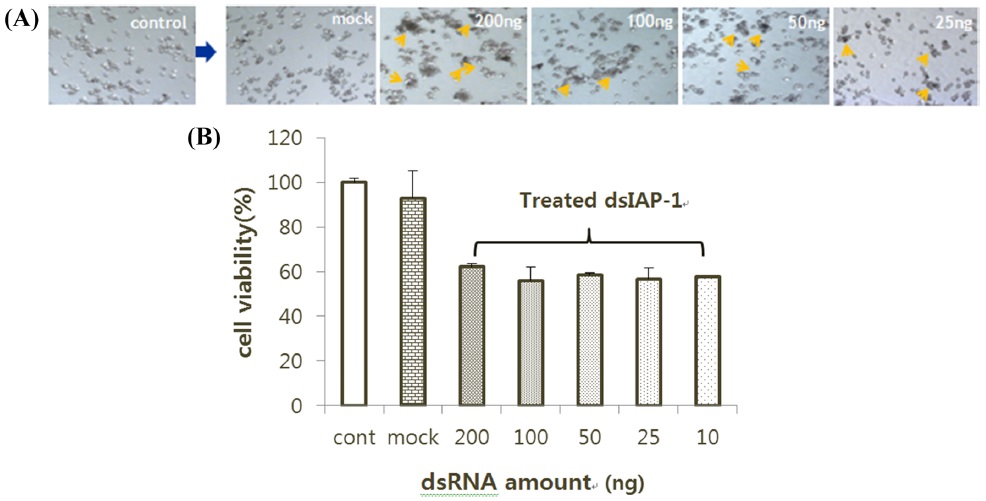
The RNAi effect was confirmed by the results obtained after the treatment with dsRNA. The BmN-SID-1 cells were adjusted to a cell concentration of 45% and dispensed in 500-μL aliquots into a 24-well plate. We injected 200 ng, 100 ng, 50 ng, or 25 ng for each dsIAP-1. After 24 h, dsIAP-1 among all the cells displayed the apoptotic phenotype on a medium, regardless of the throughput (Fig. 2A). The MTS assay showed cells injected with dsIAP-1 had different cell viability than those without, but showed similar cell viability regardless of the amount of dsIAP-1 added (Fig. 2B).
I-2. RNAi effect of cell density
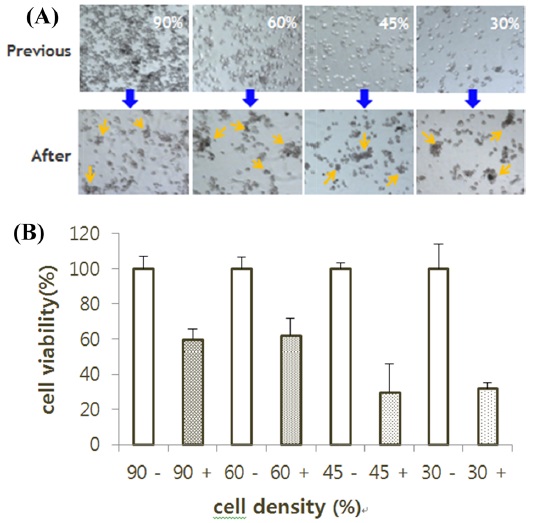
To examine whether there is a difference in the RNAi effect based on cell density, 500 μL of BmN-SID-1 cell culture was placed in 24-well plates at 90%, 60%, 45%, or 30% cell density. Wells with and without injected dsIAP-1 were compared. Cells treated with dsIAP-1 showed apoptotic phenotype on the medium regardless of cell density (Fig. 3A). Cell viability was reduced in all cells that processed dsIAP-1 in the MTS assay, but cell viability at a cell density of 30% to 45%, in particular, decreased the most (Fig. 3B).
I-3. RNAi effect of the type of cells
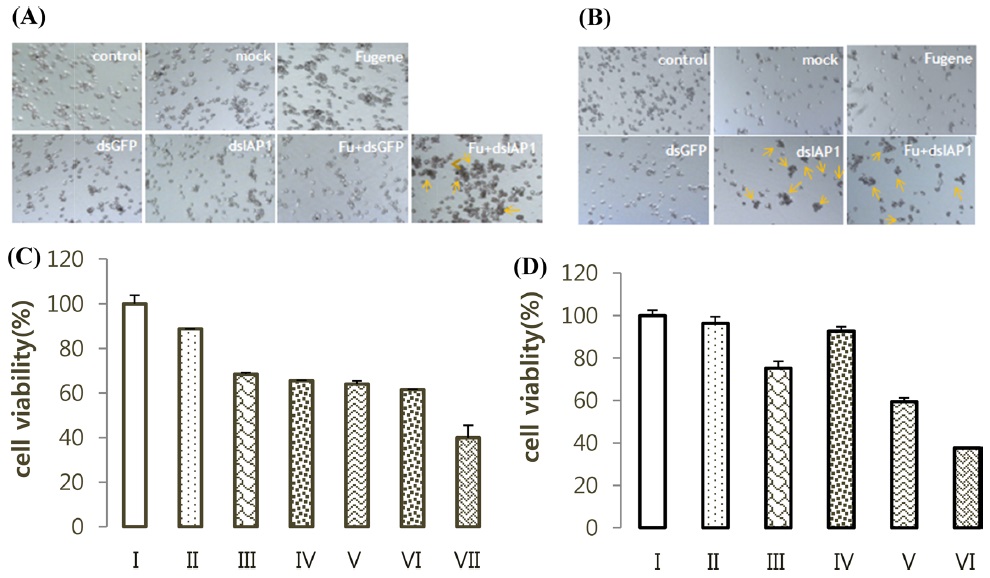
BmN-SID-1, BmN4 cell plated with 500 μL to 45% cell density in 24 well and SID-1 was treated to BmN mock, dsIAP-1, or dsGFP. Cells treated with dsIAP-1 displayed apoptotic phenotype on the medium (Fig. 4A). MTS assay results showed that cell viability in the dsIAP-1 treatment was the lowest (Fig. 4B). In addition, mock, FuGENE, dsGFP, dsIAP-1, and fu + dsGFP were treated with a fu dsIAP-1 + a BmN4 cell. In addition, cells treated with dsIAP-1 did not show apoptotic phenotype on the medium (Fig. 4C). MTS assay results show fu + dsIAP-1 treatment had the lowest cell viability (Fig. 4D).
I-4. Identification of RNAi effect
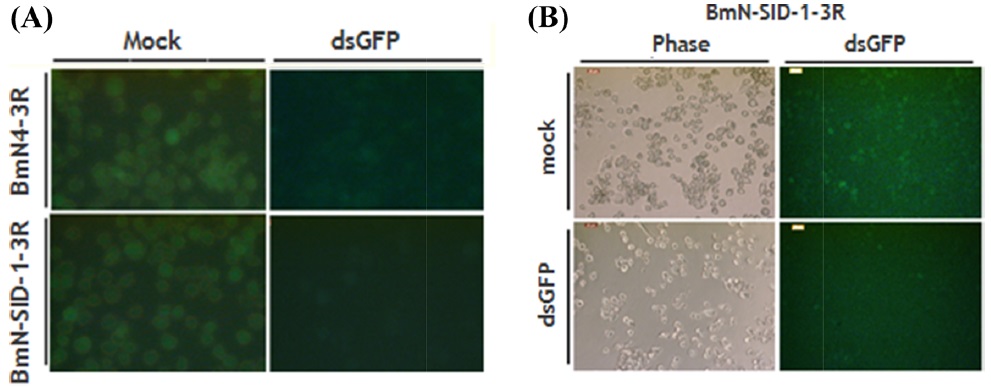
After the insertion of the GFP gene 3R PIzT vector was confirmed, the expression of GFP was treated in BmN4 and BmN SID-1 cells. These cells were aliquoted into 96-well plates with dsGFP. Two days later, observations confirmed that dsGFP reduced expression of GFP (Fig. 5).
>
Chapter II. Changes in genes due to temperature by RNAi technology
II-1. Hsp70
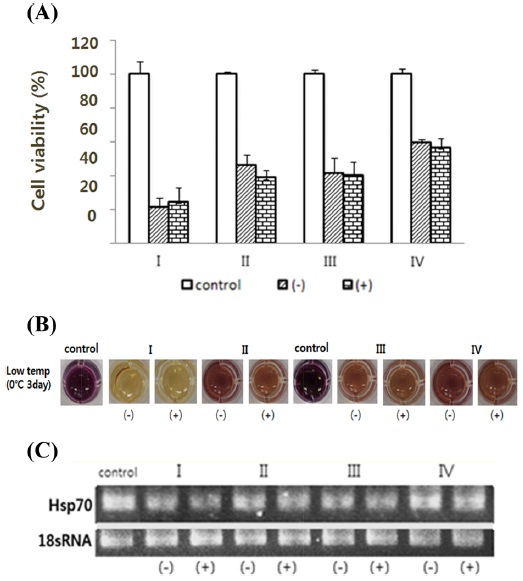
At a low temperature, which suppresses the expression of the genes under the dsHsp70 treatment, cell viability is decreased more by dsHsp70 treatment than in the untreated group (Fig. 6A). The RT-PCR results confirmed that the gene expression level of the treated cells was decreased by dsHsp70 treatment (Fig. 6C).
II-2. 3R
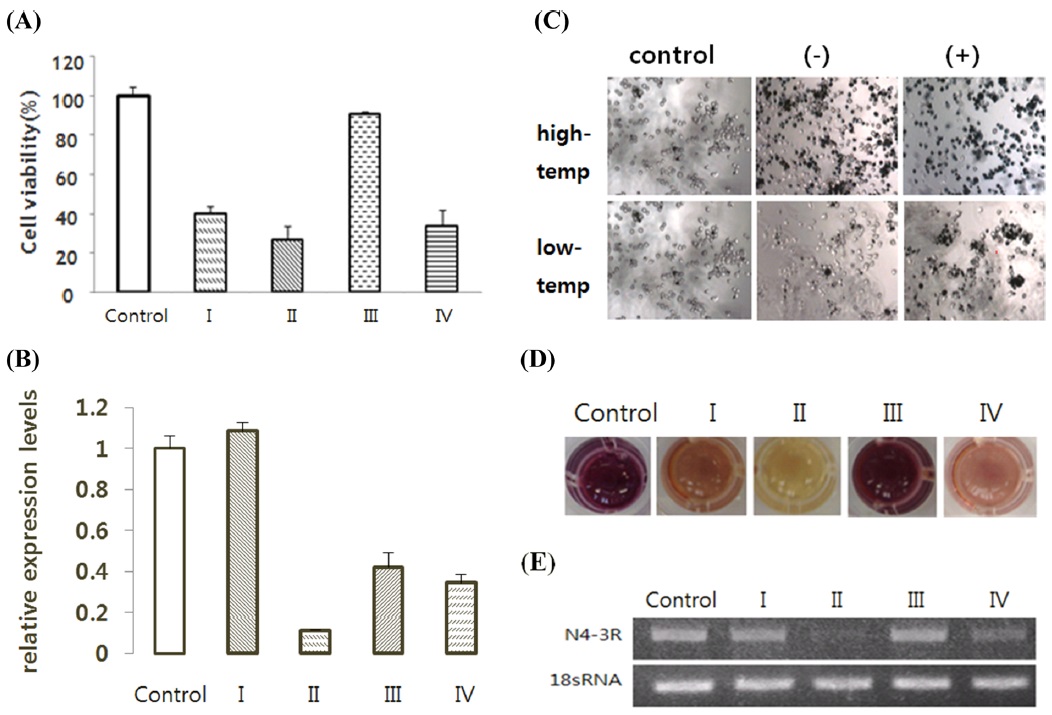
We used the 3R gene injected cells: BmN4-3R, BmN-FK-3R, and BmN-SID1-3R the BmN4, BmN-FK, BmN-SID1 cells. It decreased the expression level of the gene compared to control 3R confirmed by RT-PCR processes the ds3R result, (Fig. 7E). The same results as above were confirmed in the real-time PCR (Fig. 7B). In addition, cell viability value at which suppression of gene expression occurred was lower in ds3R-treated cells than in the non-treated group (Fig. 7A).
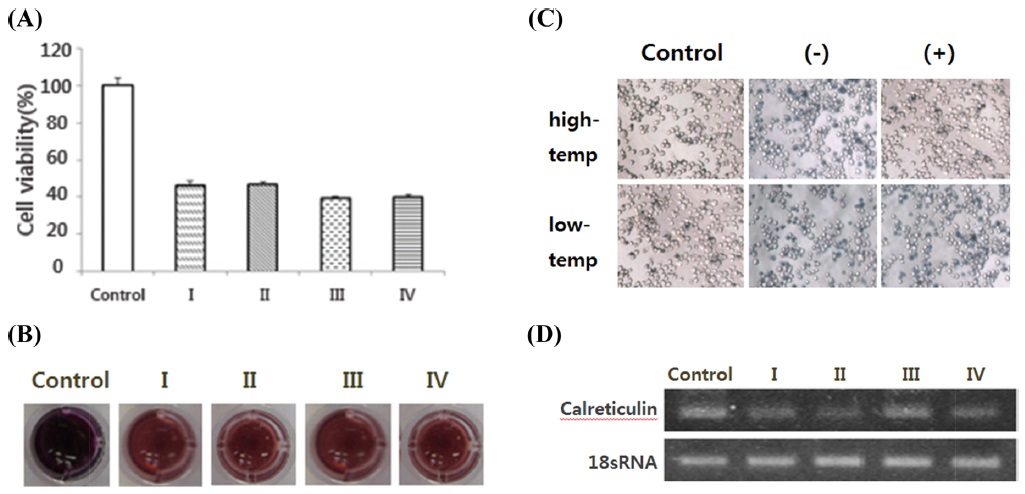
II-3. Calreticulin
In the calreticulin gene RNAi results, cell viability did not differ substantially between the non-treated group and the treated group (Fig. 8A). It was confirmed that the gene expression level of the treated cells decreased dscalreticulin in RT-PCR (Fig. 8D).
Insects, being heterothermic animals, exhibit a close relationship between ecological factors (especially temperature change) and their physiology (Michael
Insect cells are easy to culture and have economic advantages compared to the culture and management of general mammalian cultured cells (Drugmand
We established the most efficient conditions for RNAi, and the experiment was conducted with the GFP gene IAP-1 to confirm that the synthesis of dsRNA was appropriate. IAP-1 (literally short for inhibitor apoptotic protein) gene prevents the progression of cell death that occurs in cells. When injected into the cell to produce a dsRNA of this gene, it is possible to observe floating dead cells over the medium; apoptosis occurs rapidly. To establish the most efficient methodology, experiments were divided by the experiment, RNAi dsRNA amounts, the cell density, and each treatment group. Thus, it can be seen that the RNAi effect is the same, regardless of the amount of the dsRNA. In addition, if dsIAP-1 is added, regardless of the concentration of the cells, the apoptotic phenotype was confirmed in all the cells via the MTS. The most efficient RNAi activity appeared in a cell density of 30%–45% (Fig. 3). No significant difference mock which the negative control, transfection reagent, dsGFP, even with the number of the cells treated. In order to check directly whether the synthesis of dsRNA takes place correctly, we compared the fluorescence of GFP expression. Since the expression of GFP is suppressed in cells treated with the dsGFP, the fluorescence intensity was much smaller; it is therefore possible to confirm that dsRNA has been synthesized correctly (Fig. 5).
Then, the cells were prepared with dsRNA of cell death-related genes and temperature stress; we tried to knock down selected genes. Based on our results, 3R gene and Hsp70 can be predicted to affect the survival of the cells under low and high temperature (Fig. 6, 7). Calreticulin gene can be predicted to not directly affect the survival of the cells under low and high temperature (Fig. 8).
In addition, the use of the BmN-SID-1 cells for RNAi experiments instead of transfection reagent, leads to low costs, low labor requirement, and less experimental time. Therefore, it is expected that these special transduced cell lines can be used in various research fields and are expected to serve as a research tool for the precise functional analysis of various genes.