Oligostilbenes are a relatively small group of secondary metabolites, with only about 300 being known to science.1 They all can be considered as derivatives of few natural stilbenoids.2 As the isolation and characterization techniques for plant compounds developed, investigations of oligostilbenes became more abundant and more new compounds from various families were characterized.
Oligostilbenes have attracted attention due to a variety of reported bioactivities of crude extracts, fractions, as well as the isolated pure compounds. In most cases, only pharmacological screening and preliminary studies have been carried out.3-5 Of the various biological properties, anti-inflammatory activity6,7 is the most widely studied, followed by cytotoxicity.8 Antimicrobial9 and antioxidant10 activity has also been investigated widely.
In drug discovery programme, it is crucial to distinguish isomeric identity of an active compound, as for some therapeutics, single-enantiomer formulations can provide greater selectivities for their biological targets, improved therapeutic indices, and/or better pharmacokinetics than a mixture of enantiomers.11
>
Isolation of diastereomeric oligostilbenes
The compounds were obtained from
The isolation and purification of compounds were carried out using HPLC system equipped with a fraction collector. The collected fractions were repetitively refractionated until pure compounds were obtained. In the processes, various types of column were used. The chromatographic conditions and solvent systems were individually determined for every single fraction prior to the process. The isolated compounds were characterized by means of spectroscopic data, including nuclear magnetic resonance (NMR) and mass spectrometry.
>
Optimization of chromatographic conditions
The chromatographic conditions were obtained on an Agilent 1290 Infinity UPLC system. The chromatographic conditions, including choice of the chromatographic column, temperature, solvent system, gradient profile and flow rate of delivery solvent were described in our previoud report.13 The optimized chromatographic condition were used in the LC-MS system.
LC-MS system was optimized in order to obtain MS/MS data of each pure compounds. This optimization comprises ionization and fragmentation parameters. MS/MS data of compound were recorded and stored in the LC-MS system as a library of compound data to be used as reference data.
For all subsequent LC-MS/MS experiments, the column used was Chromolith™ (150 mm × 4.6 mm I.D.). The ionization mode was set at positive ESI. The fragmentor voltages and collision energies were defined individually for each pair of isomers.
The identified compounds were then analyzed by mass spectrometry to determine their mass value as well as the fragmentation of their structures. Mass spectra were acquired on an Agilent 6460 Triple Quadrupole LC-MS with standard ESI Source. The system is operating in fully automated mode and it is controlled by MassHunter™ software. The spectral data were also analyzed with this software.
The compounds were dissolved in LC-MS grade methanol and automatically injected into the MS system. The Total Ion Current (TIC) spectra were recorded for both MS and MS/MS experiments. An MS scan experiment provides information about the m/z value of the protonated compound. In order to obtain fragmentation information on the compounds, an MS/MS Product Ion experiment was carried out. Likewise, the TIC of product ions can be recorded and it contains information on the compound fragmentation. The fragmentation behavior of these compounds was observed in collision-induced dissociation (CID) product ion spectra of the compounds under electrospray-ionization (ESI) conditions.
The TIC of the LC-MS analysis provides on-line molecular mass information. This helps in estimating the oligomerization degrees of the stilbenes. As the resveratrol (the biogenetic precursor of all oligostilbenes isolated in this work) mass is 228 (m/z = 229), a dimeric stilbene m/ z value would be around 450-480, considering intermonomer bonding and the possibility of excess ogygen atoms. The m/z value of a trimeric stilbene would be around 680-700 and for a tetrameric stilbene, m/z is around 900-950.
The compounds were directly injected into the LC-MS system. A 1 mg/mL sample was prepared in MeCN and was analyzed in different experiments;
1) MS scan analysis of the crude extract and
2) Product ion analyses for precursor ions at each following values: m/z 471, 681 and 907.
The product ions spectra of each compound were analysed and the difference in their fragmentation patterns were used to distinguish the stereoisomers.
All chemical structures were drawn using ChemDraw and molecular modeling (for 3-dimentional presentation of the molecules) was performed using Chem3D Pro v5.0 from CambridgeSoft. Using this software, the solvent effect was accounted implicitly, in which the solute is embedded into a shape-adapted cavity surrounded by a solvent-like structure. Structural conformational was performed by running MM2 calculation to minimize the energy while molecular dynamics were run at 300 K.
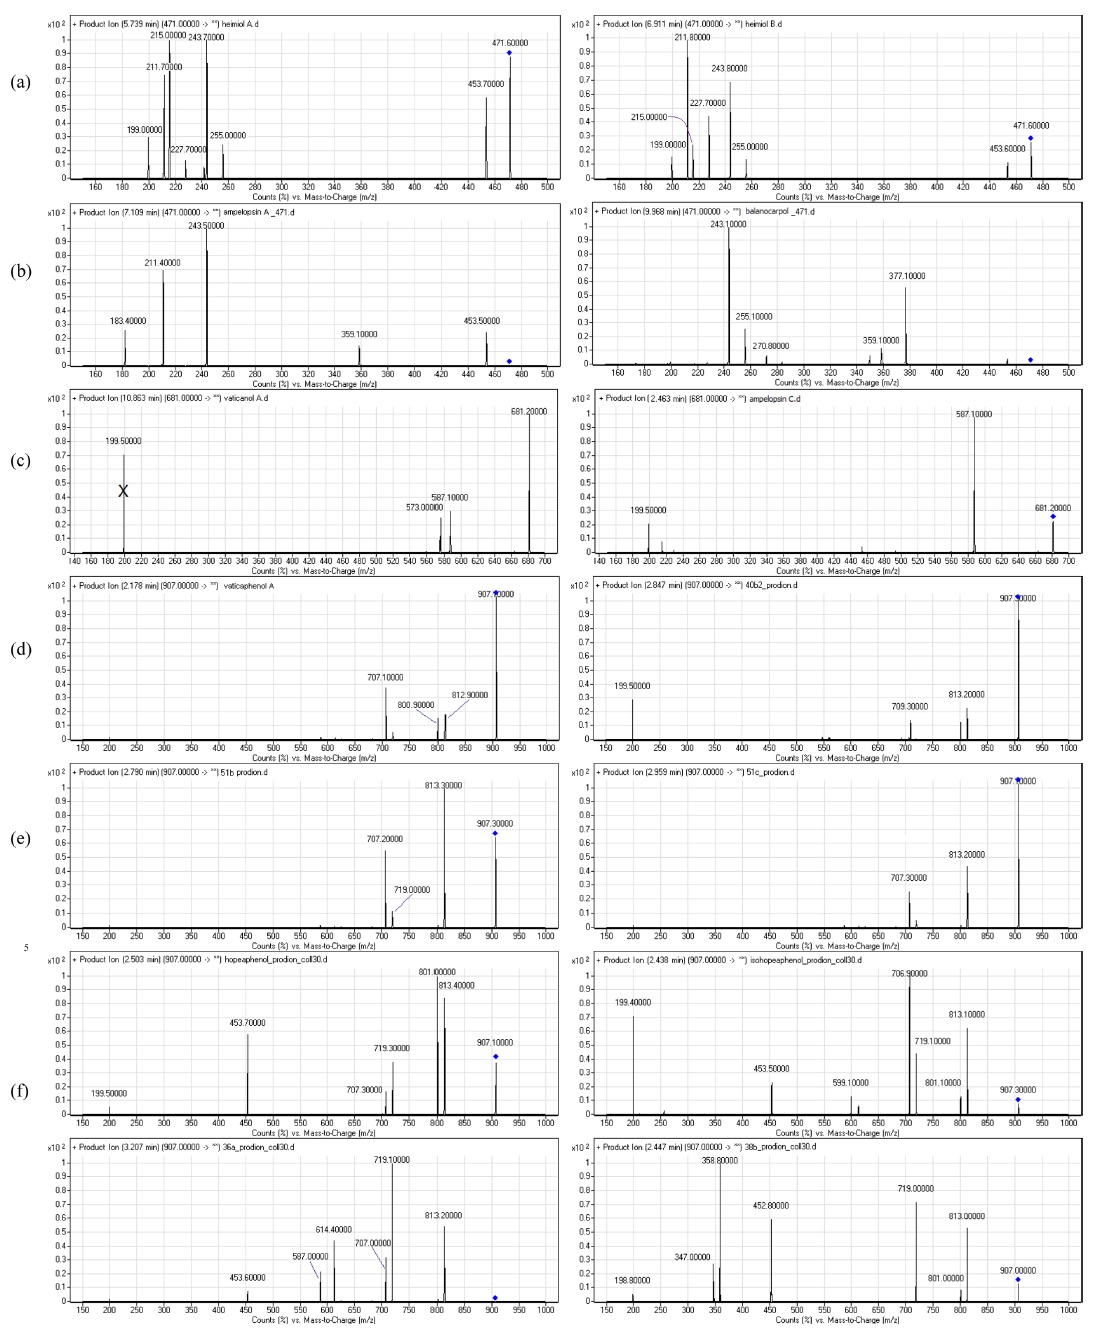
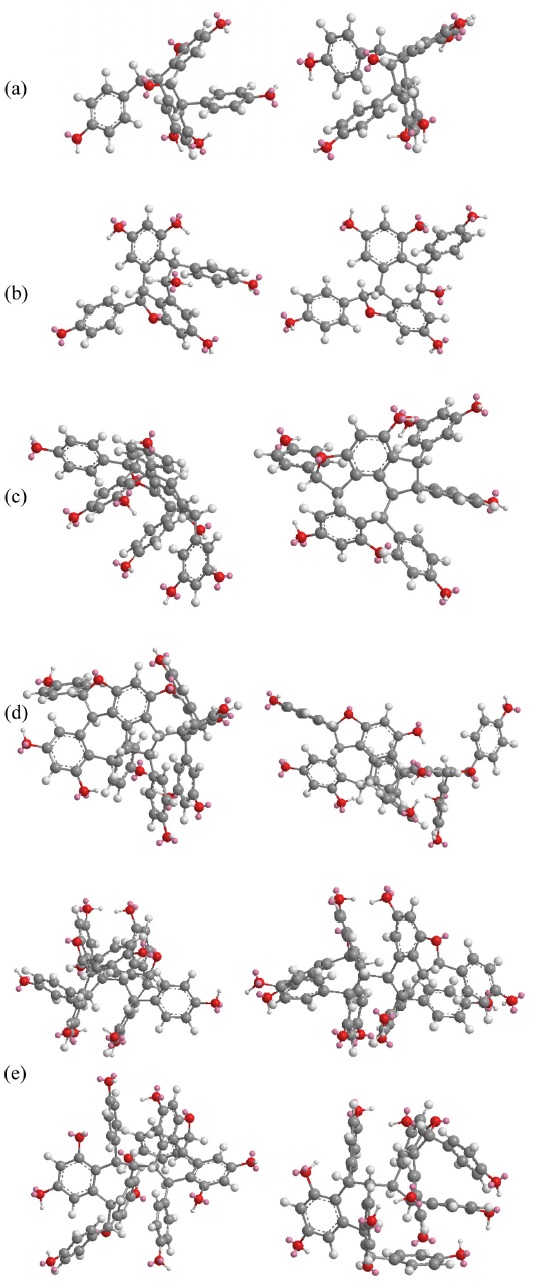
The fragmentations of these compounds were discussed with respect to the intensity of the ion peaks, not the preference mechanism. Some of the compounds showed a tendency to undergo multiple bond breakage to form resveratrol monomers. The product ion spectra of these compounds are shown in Figure 1 and the computerised energy-minimised 3-dimentional structures are shown in Figure 2.
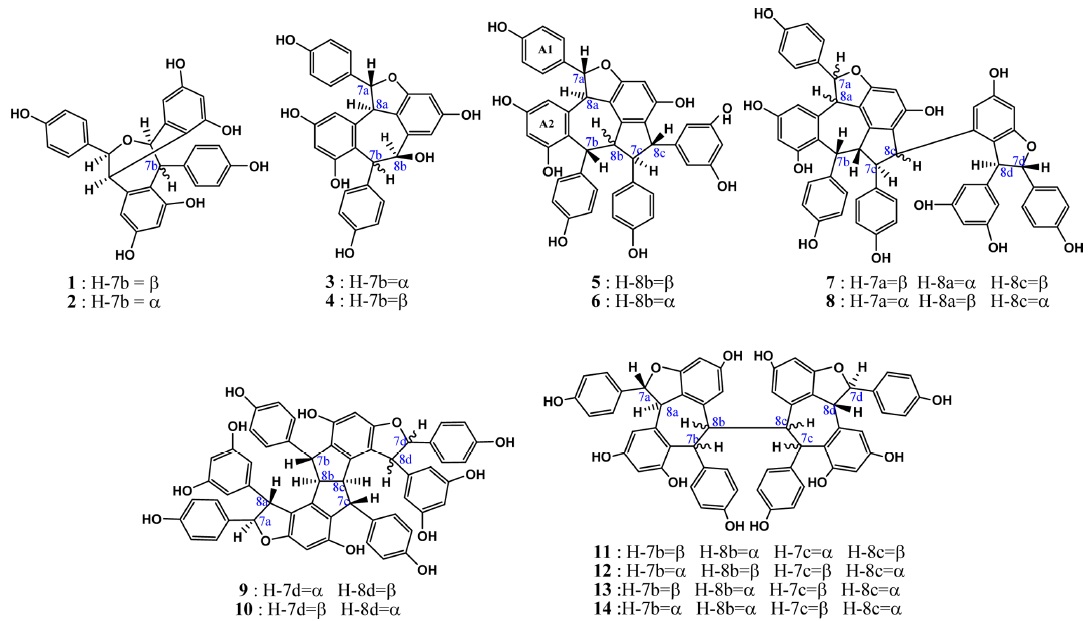
Heimiols A (1) and B (2) are 7a-epimers, a pair of stereoisomers with only one stereogenic center difference. The fragmentor voltage and collision energy were set at 100 V and 10 eV respectively. The preliminary assessment of the spectra indicated that the precursor ion of heimiol A was more abundant than that of heimiol B. This observation suggested that heimiol A is more stable than heimiol B. This may due to the spatial orientation of ring A1, which is in the same orientation with ring B2, causing steric hindrance of the ring. Three-dimensional molecular modeling (Figure 2a) provides the explanation about the molecular orientation. The stability of the compounds may also explain the relative amount of compounds isolated (heimiol A=159.67 mg and heimiol B=31.00 mg). The product ion spectra of these compounds are shown in Figure 1a.
The product ion spectrum of heimiol A displayed a precursor ion peak at 90% abundance and four significant product ion peaks at m/z 453, 255, 243, 215 and 211. By contrast, in heimiol B, the abundance of the precursor ion was 30% and the associated product ion peaks were observed at the same value, but in different relative abundances.
Generally, the fragmentation patterns of heimiols A and B are similar. However, the intensities of the peaks are different, probably affected by the variation of structural orientation in space. Apart from a significant difference in the intensities of the precursor ion peaks, the product ions also show great dissimilarity. For example, the abundance of ion at m/z 243 is almost 100% for heimiol A but just slightly higher than 50% for heimiol B. The spectra also show low intensity of ion peak at m/z 227 (15%) for heimiol A, but higher (30%) for heimiol B. Ion at m/z 215 is at 100% abundance for heimiol A, but less than 20% abundance for heimiol B. The base peak for heimiol B is at m/z 211, whereas for heimiol A, the abundance of the ion is 75%.
>
Balanocarpol and ampelopsin A
Balanocarpol (3) and ampelopsin A (4) are diastereoisomers with only one stereogenic center difference, which is at C-7b. For the MS/MS experiment, the fragmentor voltage was set at 100 V and collision energy at 10 eV. The product ion spectra of these compounds are shown in Figure 1b.
The product ion spectra of both ampelopsin A and balanocarpol displayed significant differences despite only one stereo centre that distinguished these compounds. The ampelopsin A spectrum showed five product ion peaks at m/z 453, 359, 243, 211 and 183, the last three with significant intensity. For balanocarpol, the product ion peaks were observed at m/z 377, 359, 270, 255 and 243.
The spectrum of ampelopsin A showed fragmentations to smaller ions compared to those of balanocarpol, suggesting a lower stability for ampelopsin A. The 3- dimensional molecular model (Figure 2b) displays differences in the orientation of ring A2 and conformation of the seven-membered rings in the molecules.
On the other hand, the conformations of the sevenmembered rings may affect the stability of the compounds. The seven-membered ring in balanocarpol forms a pseudochair conformation, whereas in ampelopsin A, it forms a pseudo-boat conformation. As explained in the case of heimiols A and B, the relative stability of these compounds may explain the much larger amount of balanocarpol isolated as compared to ampelopsin A (184.20 and 10.12 mg respectively).
>
Vaticanol A and ampelopsin C
Vaticanol A (5) and ampelopsin C (6) are trimeric 8bepimers, a pair of diastereoisomer with only one stereogenic center difference out of six. The fragmentor voltage and collision energy were set at 100 V and 20 eV respectively. The product ion spectrum of vaticanol A displayed a precursor ion peak at 100% abundance, whereas the precursor ion peak of ampelopsin C was at 25% abundance. This was an obvious indication of the superior stability of vaticanol A as compared to ampelopsin C. The 3-D models (Figure 2c) show that the only significant difference is the orientation of ring A2. The product ion spectra of these compounds are shown in Figure 1c.
The product ion spectrum of vaticanol A displayed three significant product ion peaks at m/z 587 and 573. The product ion peak at m/z 199 is believed to be the result from a contaminant, and would not be discussed in the fragmentation mechanism. In ampelopsin C, the only significant product ion peak was observed at m/z 587.
>
Vaticaphenol A and heimiol D
Vaticaphenol A (7) and heimiol D (8) are diastereoisomers with eight stereogenic centers and three of them are different. In the MS/MS experiment, the fragmentor voltage was set at 100 V and collision energy at 15 eV. Despite differences in their configurations, their MS/MS spectra were rather similar (Figure 1d). The only difference was the product ion peaks at m/z 707 for vaticaphenol A and 709 for heimiol D.
Ampelopsin H (9) and heimiol E (10) are diastereoisomers with eight stereogenic centers. Two centers, C-7c and C-8d are of opposite configurations. These apparently minor structural differences translate in very significant changes in their NMR spectra as discussed in section 4.3. and 4.3. This can be better understood with help of computerized models shown in Figure 2d. In this figure, the models are presented from a similar perspective. It can be clearly seen that not only rings D1 and D2 adopt a different spatial position, but that distant ring such as ring A2 is also strongly affected. It could therefore be predicted that these compounds should behave with significant differences in a mass spectrometry.
However, these observations do not lead to any conclusion about the stability of the compounds. For MS/ MS experiments, the fragmentor voltage and collision energy were set at 100 V and 15 eV respectively. The product ion spectra of these compounds are shown in Figure 1e.
Actually, both spectra showed similarities beyond expectation. The difference was only the intensity of the peaks. For heimiol E, the precursor ion peak at m/z 907 is the base peak is, while spectrum of ampelopsin H shows abundance of 65% for the precursor ion. The product ion peaks were observed at m/z 813, 719 and 707 for both compounds. For ampelopsin H, the base peak is at m/z 813, while the abundance of the same ion for heimiol E is just slightly higher than 40%. The intensity of product ion peak at m/z 719 is more that 50% for ampelopsin H, while only 25% for heimiol E. These showed the variation in fragmentation preference. The abundance of ion at m/z 719 for both product ions of ampelopsin H and heimiol E are relatively similar at 45-50%.
>
Hopeaphenol, isohopeaphenol, hopeaphenol A and isohopeaphenol A
Hopeaphenol (11), isohopeaphenol (12), hopeaphenol A (13) and isohopeaphenol A (14) share a similar plane structure, which made them a group of diastereoisomers. The compounds include eight stereogenic centers, four of them associated with the benzofuran ring remaining unchanged while the configuration of C-7b, C-8b, C-7c and C-8c varies. One could infer that the positions of rings B1 and C1 would only be affected. However, from the observation on 3-D molecular models (Figure 2e), it can be seen that this hypothesis is partially correct for hopeaphenol and isohopeaphenol as adjacent rings A2 and D2 are also affected by the change of configuration. Hopeaphenol A and isohopeaphenol A are characterized by C-8b and C-8c having opposite configurations. Their most stable conformation is obtained when one half of these molecules rotates 180° resulting in H-8b and H-8c is to be anti. These make the structural conformations of these compounds completely different.
In the MS/MS experiments, the fragmentor voltage was set at 100 V and the collision energy at 30 eV. In spite of the close structural analogies, the MS/MS spectra show some significant differences, especially in term of relative abundance of some expected common fragments. The product ion spectra of these compounds are shown in Figure 1f.
The analysis of the isolated oligostilbenes with LC-MS/ MS system showed the competency of the system to distinguish oligostilbene diastereoisomers. This observation is crucial as the high-resolution mass spectrometry (HR-MS) cannot differentiate them. The system was recognized as being able to work remarkably well in producing data that can be assigned unambiguously to compounds of high complexity with very small structural differences.