In recent years, the problems of electromagnetic interference (EMI) and electromagnetic susceptibility (EMS) have become more serious due to the wide application of electromagnetic (EM) wave in the GHz range for mobile phones, local area networks, radar systems, and so on. The problems are a malfunction of precise electronic equipment and leak of secret information occurred by a leakage of EM wave. For example, radar systems create false images in the radar because of false echoes. The false echoes are caused by reflection of radar beam from ship’s structures such as a mast. When such reflection occurs, the false echoes will return from a legitimate radar contact to antenna by indirect paths. Consequently, the false echoes will make false images appear on the display. Because false echoes cause navigating hazards, EM wave absorbers should be used to cover ship’s structures such as a mast [1-5]. At present, EM wave absorbers fabricated in the form of sheets by mixing polymer with absorbent powder have become the focus of current studies, because of their practical and simple preparation method. To our knowledge, ferrites might be a candidate as an EM wave absorbing material because of their high specific resistance, remarkable flexibility in tailoring magnetic properties, and ease of preparation. In past decades, spinel ferrites were utilized as the most common absorbing materials in various forms. Among the EM wave absorbing materials, ferrite was most studied in experiments and applied in both military and civil fields because of its large saturation magnetization, anti-oxidation, and corrosion resistance [6-9]. In previous studies, among the spinel ferrites, LiZn-ferrite and NiZn-ferrite have been used in EM wave absorber materials in VHF and UHF bands [10-15]. In this study, as an absorbent material, ferrite composite was composed of lithium, nickel, and zinc. The EM wave absorption properties of the prepared samples were studied at 4–8 GHz and were determined at different frequencies and sample thicknesses.
II. PREPARATION OF FERRITE COMPOSITE SAMPLE
The ferrite composite was synthesized by ceramic route. The raw materials were lithium carbonate (Li2CO3; Samchun Chemical, Seoul, Korea), nickel(II) oxide (NiO; Samchun), zinc oxide (ZnO; Samchun), and iron(III) oxide (Fe2O3; Samchun). The starting powders of Li2CO3, NiO, ZnO, and Fe2O3 were mixed together. Their cationic molar ratios were adjusted to the stoichiometric compositions: Li0.375Ni0.375Zn0.25-ferrite. The mixture was calcinated and sintered in a furnace [10–12, 16].
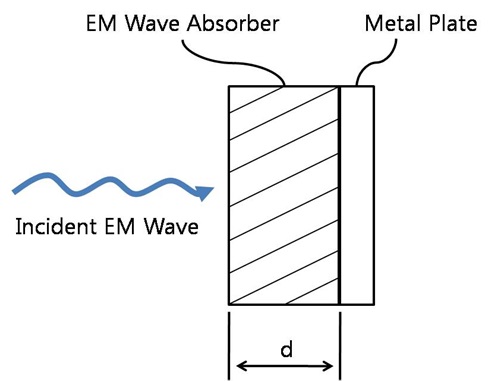
We prepared chlorinated polyethylene (CPE) as a polymeric binder. The two-roll mill was used to mix the ferrite composite with CPE. The weight percent ratio of ferrite composite to polymeric binder was 75:25. The thicknesses of the samples were 1, 2, 4, 6, and 8 mm. For the investigation of the EM wave absorption properties, the prepared composite absorbers were cut into a cylindrical toroid shape with an outer diameter of 20 mm and an inner diameter of 9 mm. Fig. 1 shows the structure of the proposed EM wave absorber [7-9].
A field emission scanning electron microscopy (FE-SEM; JSM-6500F, JEOL Ltd., Tokyo, Japan) was equipped with an energy dispersive X-ray spectroscopy (EDX). FE-SEM was used to analyze the surface morphology, while an EDX analysis was performed to analyze elemental constituents on the surface of sample [17, 18]. X-ray photoelectron spectroscopy (XPS; K-Alpha, Thermo Scientific, Waltham, MA, USA) was used to analyze the elemental constituents on the surface of the sample through the detection of electron binding energy. After the tworoll mill was used to mix the ferrite composite with CPE, the weight percent ratio of ferrite composite to CPE at the sample was compared with the experimental design using a thermogravimetric analysis (TGA; STA409C, Netzsch, Selb, Germany). TGA was performed at a heating rate of 10℃/min in nitrogen [19]. The magnetic properties were evaluated on a vibrating sample magnetometer (VSM; Lake Shore Cryotronics Inc., Westerville, OH, USA) and the magnetic field reached up to 10 kOe.VSM was used to determine the hysteresis curve of the ferrite composite at room temperature [17, 20, 21]. To prepare the measurement of the return loss, the toroid samples were inserted into the coaxial sample holder. The variations in the return loss versus frequency in the range of 10 MHz to 12 GHz were investigated using a network analyzer(Agilent E8363B; Agilent Technologies, Santa Clara, CA, USA) [22-24].
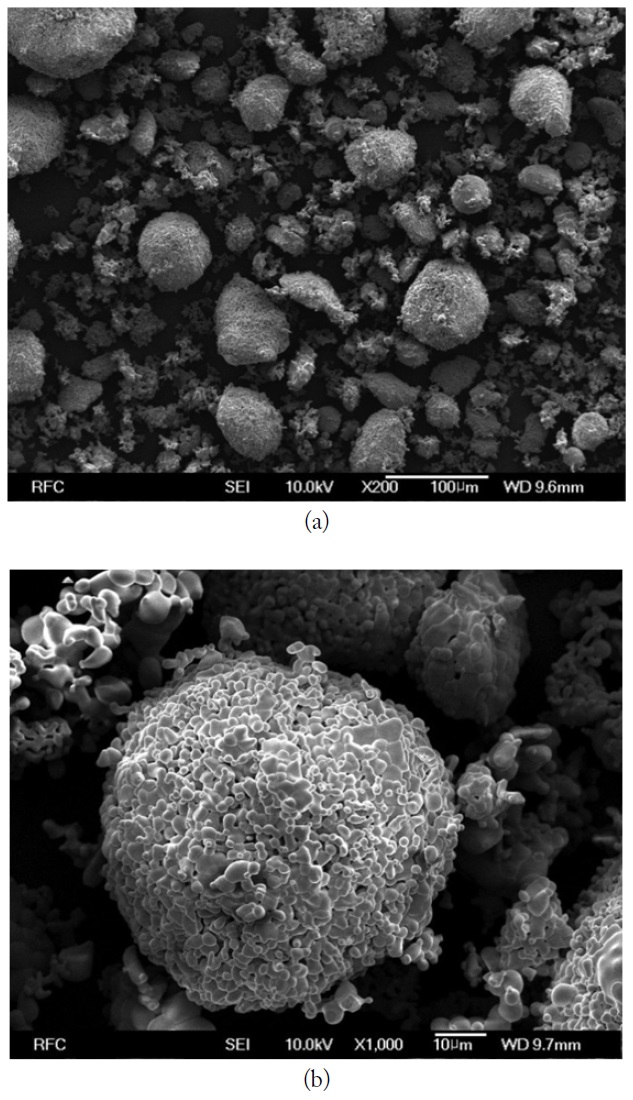
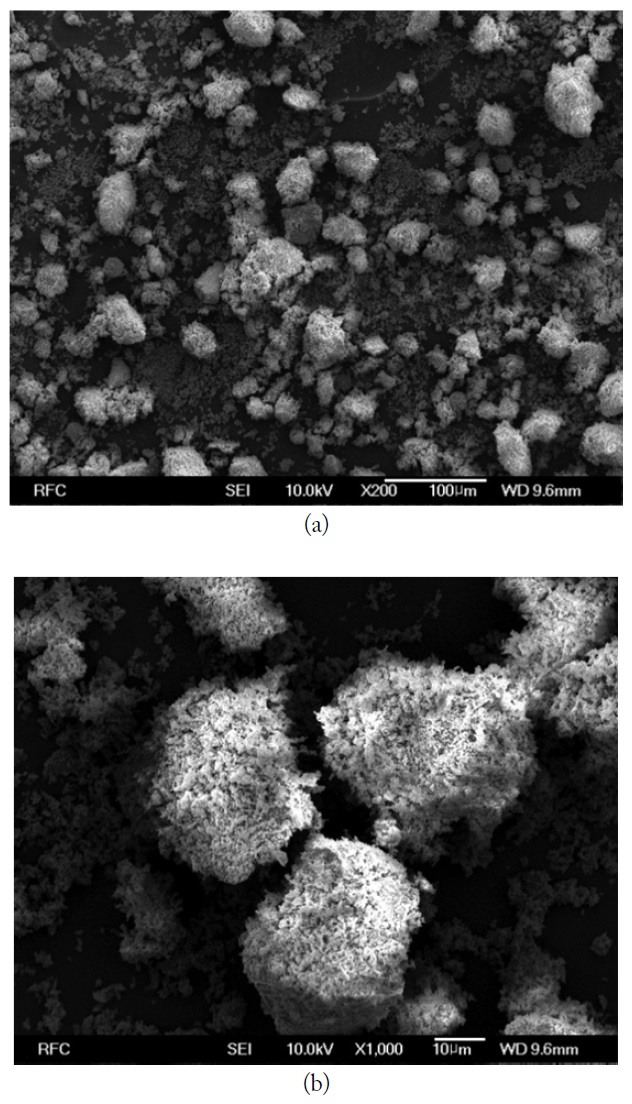
Fig. 2(a) and (b) show the SEM images of Fe2O3 particles without heat treatment. Fig. 3(a) and (b) show the SEM images of LiNiZn-ferrite particles with heat treatment. Figs. 2(b) and 3(b) are the magnified views of SEM images. In Fig. 2(b), the appearances of particles are irregular fragment shapes and the surfaces of the particles are rough. In Fig. 3(b), the appearances of particles are spherical in shape and the surfaces of particles are smooth when Fig. 3(b) is compared with Fig. 2(b). It is determined that the lithium oxide, nickel oxide, zinc oxide, and iron oxide particles were mixed and agglomerated to make LiNiZn-ferrite particles [24].
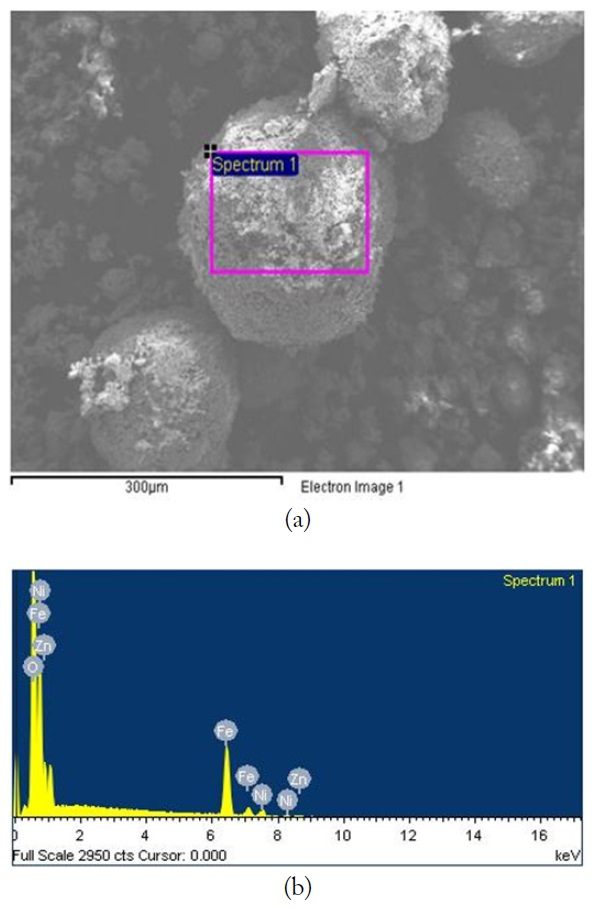
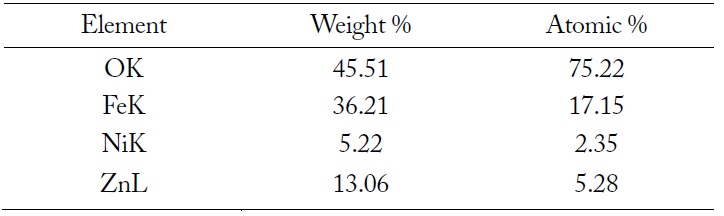
The SEM image and EDX spectrum of LiNiZn-ferrite particles are presented in Fig. 4(a) and (b). On the surface of the particle, the elemental concentrations determined by EDX are displayed in Table 1. The weight percents of nickel and zinc are 5.22% and 13.06%, respectively. It is determined that the weight percents of elements are derived from oxide compounds and heat treatment. It is clear that LiNiZn-ferrite particles consist of iron, nickel, and zinc elements.
[Table 1.] Elemental concentrations determined by EDX on the surface of LiNiZn-ferrite particle

Elemental concentrations determined by EDX on the surface of LiNiZn-ferrite particle
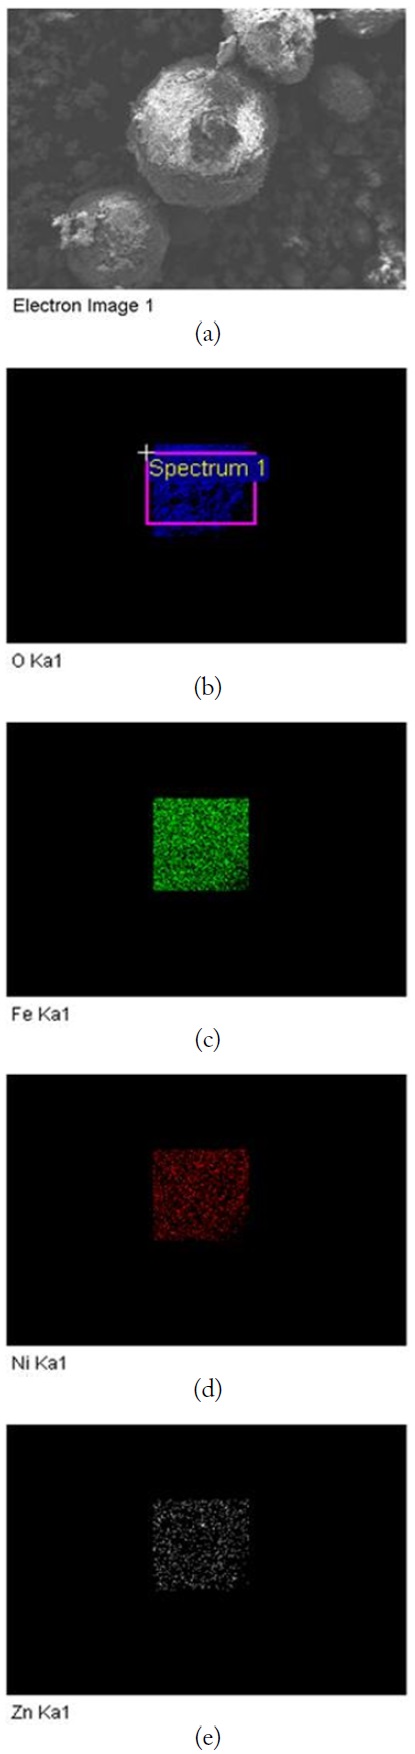
However, lithium could not be detected by EDX, as the electrons of lithium are located at a low energy level. The dispersions of elements are presented in Fig. 5(a)–(e) [17, 18].
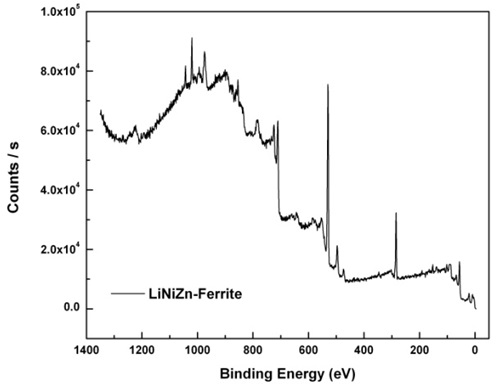
XPS is a surface-sensitive quantitative spectroscopic technique that measures the elemental composition at the parts per thousand ranges, the empirical formula, the chemical state, and the electronic state of the elements that exist within a material.
A typical XPS spectrum is a plot of the number of electrons detected (sometimes per unit time; Y-axis, ordinate) versus the binding energy of the electrons detected (X-axis, abscissa). Each element produces a characteristic set of XPS peaks at characteristic binding energy values that directly identify each element that exists in or on the surface of the material being analyzed. These characteristic spectral peaks correspond to the electron configuration of the electrons within the atoms, e.g., 1s, 2s, 2p, 3s, etc.
XPS counts electrons ejected from a sample surface when irradiated by X-rays. A spectrum representing the number of electrons recorded at a sequence of energies includes both a contribution from a background signal and resonance peaks characteristic of the bound states of the electrons in the surface atoms.
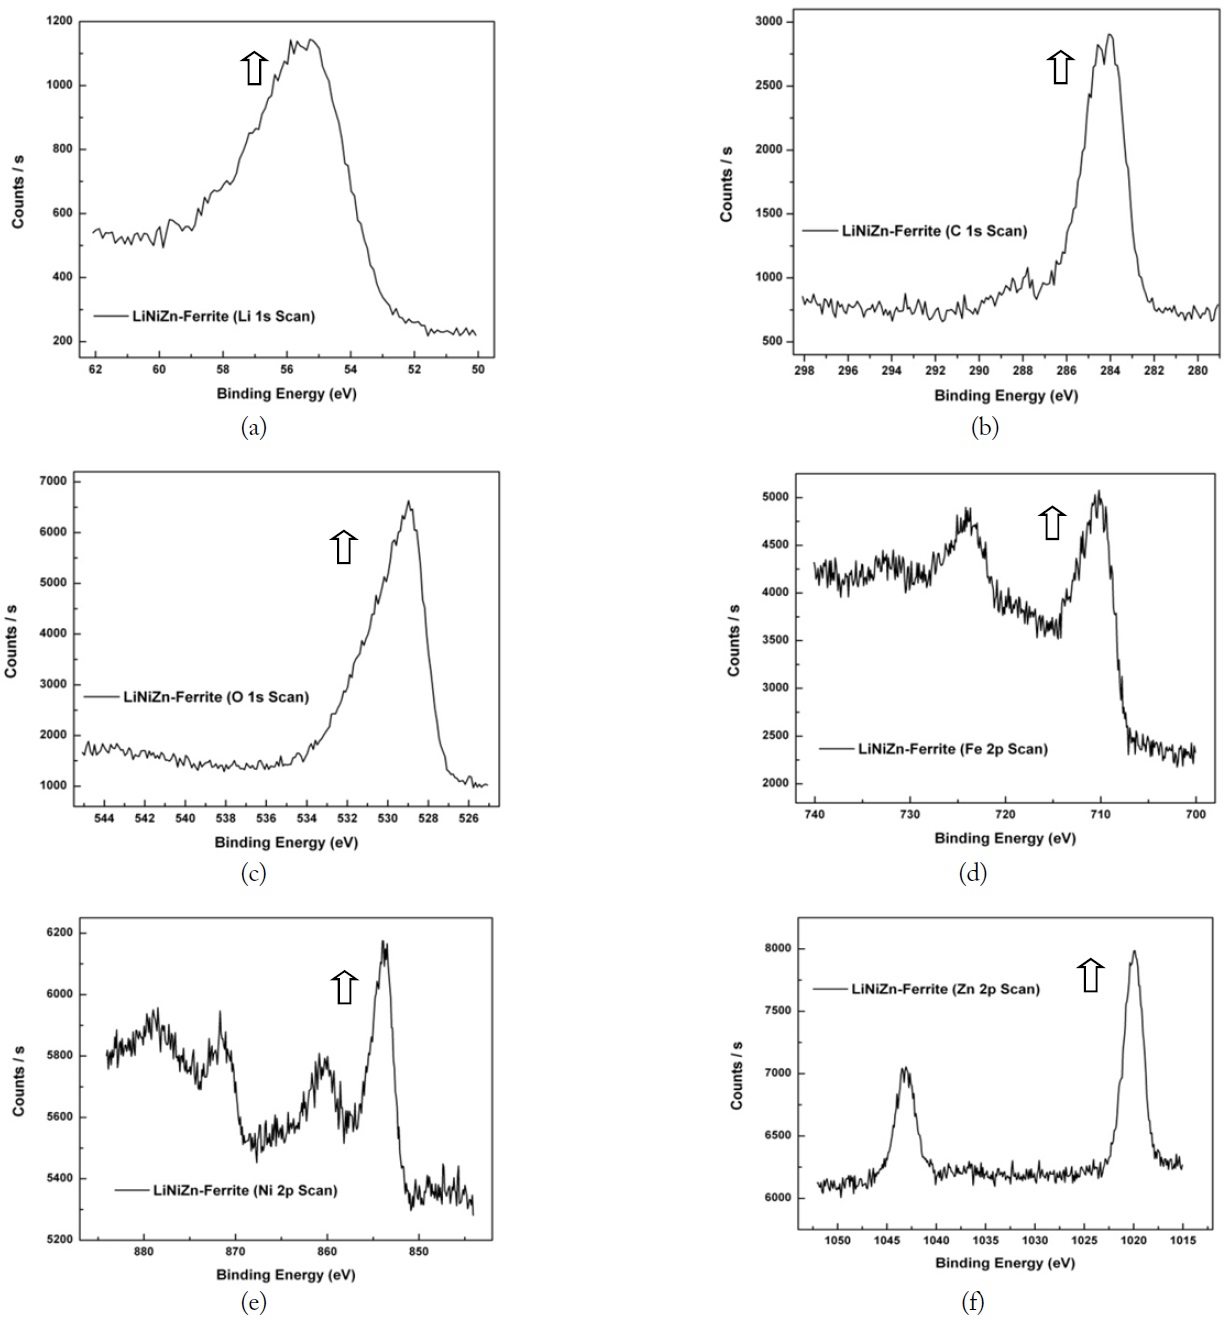
The resonance peaks above the background are the significant features in an XPS spectrum. For the most part, XPS spectra are quantified in terms of peak intensities and peak positions. The peak intensities measure how much of a material is at the surface, while the peak positions indicate the elemental and chemical compositions. Other values, such as the full width at half maximum (FWHM) are useful indicators of chemical state changes and physical influences. That is, the broadening of a peak may indicate: a change in the number of chemical bonds contributing to a peak shape, a change in the sample condition (X-ray damage), and differential charging of the surface (localized differences in the charge state of the surface). The XPS spectrum of the elements on the surface of LiNiZn-ferrite is shown in Fig. 6. On the surface of the sample, the peak positions and the FWHM of the peaks determined by XPS are displayed in Table 2. In Fig. 7(a), the Li 1s peak position of lithium is approximately at 55.90 eV and the FWHM of the Li 1s peak is 3.49 eV. The Li 1s peak consists of Li2CO3 and lithium carbide. In Fig. 7(b), the C 1s peak position of carbon is approximately at 284.55 eV and the FWHM of the C 1s peak is 2.04 eV. The C 1s peak consists of O–C = O, carbonate, C–O–C, C–C, and carbide. In Fig. 7(c), the O 1s peak position of oxygen is approximately at 529.97 eV and the FWHM of the O 1s peak is 3.99 eV. The O 1s peak consists of C–O–C, O–C = O, metal CO3, and metal oxide. In Fig. 7(d), the Fe 2p peak position of iron is approximately at 710.77 eV and the FWHM of the Fe 2p peak is 5.00 eV. The Fe 2p peak consists of Fe2O3.
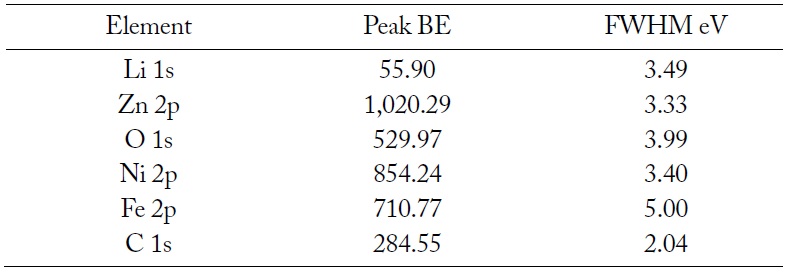
Peak positions and FWHM of peaks determined by XPS on the surface of LiNiZn-ferrite particle
In Fig. 7(e), the Ni 2p peak position of nickel is approximately at 854.24 eV and the FWHM of the Ni 2p peak is 3.40 eV. The Ni 2p peak consists of NiO. In Fig. 7(f), the Zn 2p peak position of zinc is approximately at 1,020.29 eV and the FWHM of the Zn 2p peak is 3.33 eV. The Zn 2p peak consists of ZnO. It is determined that the XPS spectrums of elements are derived from oxide compounds and heat treatment. It is clear that LiNiZn-ferrite particles consist of lithium, iron, nickel, and zinc elements. When an EDX analysis was performed to analyze the elemental constituents on the surface of the sample, lithium could not be detected. However, it was possible to confirm lithium on the surface of the sample by detecting electron binding energy at XPS [25, 26].
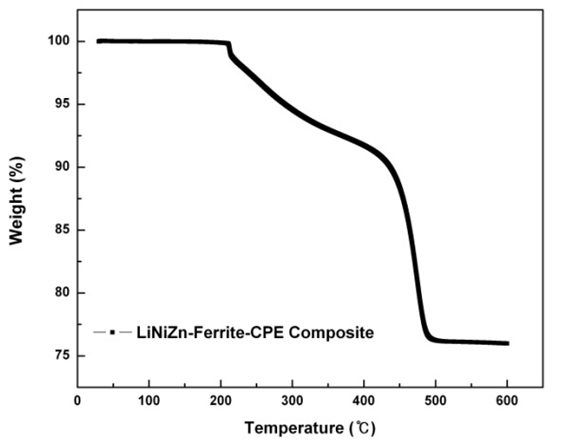
As a piece of the toroid sample was heated, the variations in the weight percent of the sample were measured using TGA equipment. The TGA curve of the LiNiZn-ferrite-CPE composite is shown in Fig. 8. The weight loss percent versus temperature is up to 9% in the range of 200℃ to 420℃. The weight percent at the residue of the sample is up to 91%.
The corresponding part of the TGA curve shows a steep increase in the weight loss percent of up to 15% in the range of 420℃ to 500℃. The weight percent at the residue of the sample is up to 76%. The CPE is evaporated by heating up to 500℃. After 500℃, there is not significant weight loss. In Fig. 8, the weight percent ratio of LiNiZn-ferrite in the LiNiZnferrite-CPE composite can be expected to be approximately 76% [19].
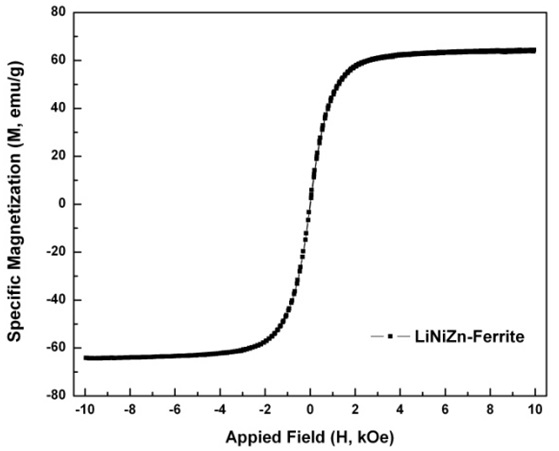
The application of a sufficiently large magnetic field causes the spins within a sample to align with the field. The maximum value of the magnetization achieved in this state is called the saturation magnetization (Ms). The Ms is 63.7 emu/g. As the magnitude of the magnetic field decreased, the spins cease to be aligned with the field and the total magnetization decreases. In ferromagnets, a residual magnetic moment remains at zero field. The value of the magnetization at zero field is called the remanent magnetization (Mr). The Mr is approximately 0.422 emu/g. The ratio of remanent magnetization to saturation magnetization (Mr/Ms) is called the remanence ratio and it varies from 0 to 1. Mr/Ms is approximately 0.007. The coercive field (Hc) is the magnitude of the field that must be applied in the negative direction to bring the magnetization of the sample back to zero. The coercive field is approximately -0.006 kOe. The magnetic properties of LiNiZn-ferrite were measured by VSM. The magnetic field reached up to 10 kOe. The hysteresis curve of LiNiZn-ferrite is shown in Fig. 9. The shape of the hysteresis curve is special interest for a soft magnetic material as an EM wave absorber, which requires a relatively large saturation magnetization and a relatively small coercivity [17, 20, 21].
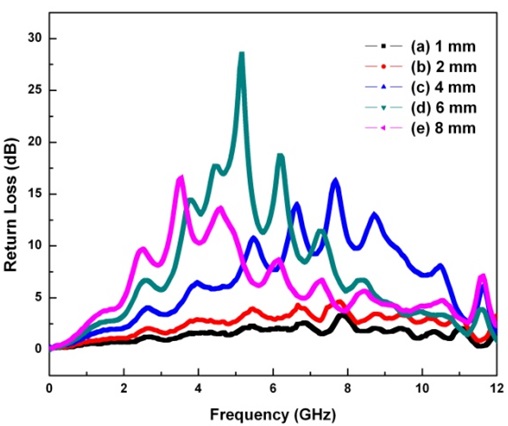
The purpose of EM wave absorbers is a low reflection over a wide range of frequency. For certain applications, the EM wave absorbers should absorb incident plane waves over a wide frequency range and should be as thin as possible. The variations in the return loss versus frequency in the range of 10 MHz to 12 GHz were investigated by network analyzer. Fig. 10 and Table 3 show the obtained results in terms of the different limitative conditions [6, 7]. The positive return loss indicates the reflected power is small relative to the incident power. When the given condition of the return loss is over 3 dB and the thickness of the EM wave absorber is 2 mm, the absorption bandwidth is 5.11–11.10 GHz. When the thickness of the EM wave absorber is 4 mm and the given condition of the return loss is over 3 dB, the absorption bandwidth is 2.33–11.12 GHz. In addition, when the given condition of the return loss is over 10 dB, the absorption bandwidth is 5.36–9.24 GHz. At the center frequency (7.68 GHz) of the EM wave absorber having a 4-mm thickness, the return loss is 16.35 dB. When the thickness of the EM wave absorber is 6 mm and the given condition of the return loss is over 3 dB, the absorption bandwidth is 1.89–10.76 GHz. In addition, when the given condition of the return loss is over 10 dB, the absorption bandwidth is 3.51–7.46 GHz. At the center frequency (5.17 GHz) of the EM wave absorber having a 6-mm thickness, the return loss is 28.58 dB. When the thickness of the EM wave absorber is 8 mm and the given condition of the return loss is over 3 dB, the absorption bandwidth is 1.16–10.98 GHz. In addition, when the given condition of the return loss is over 10 dB, the absorption bandwidth is 3.19–5.08 GHz. At the center frequency (3.55 GHz) of the EM wave absorber having an 8-mm thickness, the return loss is 16.65 dB. From Table 3, it can be found that the center frequency of the EM wave absorber shifts to a low frequency when the thickness of the EM wave absorber increases. A greater than 10 dB return loss is shown in the 4–8 mm thickness of the EM wave absorber, while it is not shown in the 1–2 mm thickness of the EM wave absorber. When the thickness of the EM wave absorber increases from 4 to 8 mm, the absorption bandwidth of a greater than 10 dB return loss shifts to a low frequency. The 10 dB return loss can be expressed as a 90% absorption ratio. As EM wave absorbers prevent false images on the screen of the radar, it is effective to apply EM wave absorbers having a greater than 10 dB return loss [27].
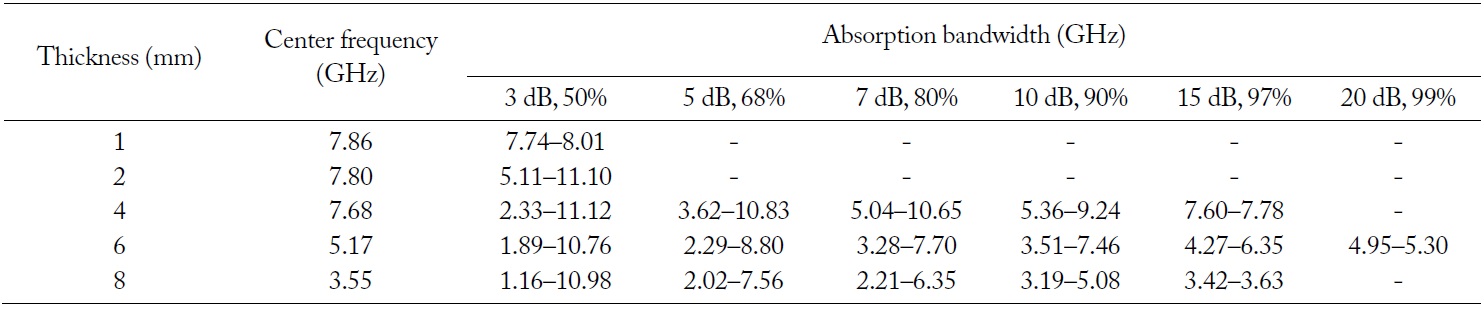
Obtained results in terms of the different limitative conditions for EM wave absorbing properties
In this study, we carried out experiments to demonstrate the dependence of thickness on the return loss of LiNiZn-ferrite-CPE composite. As an absorbent material, ferrite composite was composed of lithium, nickel, and zinc. LiNiZn-ferrite was prepared by the calcination and sintering method. We prepared CPE as a polymeric binder to make toroid samples. In SEM images of LiNiZn-ferrite particles, the appearances of particles are spherical in shape and the surfaces of particles are smooth. It is determined that the lithium oxide, nickel oxide, zinc oxide, and iron oxide particles were mixed and agglomerated to make LiNiZn-ferrite particles. EDX and XPS analyses were performed to analyze elemental constituents on the surface of the sample. It is determined that the EDX and XPS spectra of the elements are derived from oxide compounds and heat treatment. It is clear that LiNiZn-ferrite particles consist of lithium, iron, nickel, and zinc elements. As a piece of the toroid sample was heated, the variations in the weight percent of the sample were measured by TGA equipment. The weight percent ratio of LiNiZn-ferrite in the LiNiZn-ferrite-CPE composite can be expected to be approximately 76%. The hysteresis curve of the sample was measured by VSM. The saturation magnetization is 63.7 emu/g. The shape of the hysteresis curve is special interest for a soft magnetic material as an EM wave absorber, which requires a relatively large saturation magnetization and a relatively small coercivity. The variations in return loss versus frequency in the range of 10 MHz to 12 GHz were investigated by network analyzer. A greater than 10 dB return loss is shown in the 4–8 mm thickness of the EM wave absorber, while it is not shown in the 1–2 mm thickness of the EM wave absorber. When the thickness of the EM wave absorber increases from 4 to 8 mm, the absorption bandwidth of a greater than 10 dB return loss shifts to a low frequency. When the thickness of the EM wave absorber is 6 mm and the given condition of the return loss is greater than 10 dB, the absorption bandwidth is 3.51–7.46 GHz. At the center frequency (5.17 GHz) of the EM wave absorber having a 6-mm thickness, the return loss is 28.58 dB. The 10 dB return loss can be expressed as a 90% absorption ratio. As EM wave absorbers prevent false images on the radar screen, it is effective to apply EM wave absorbers having a greater than 10 dB return loss.