Breast cancer is a significant health problem worldwide. It is the most common non-skin malignancy in women and the second leading cause of female cancer mortality [1]. Early detection of this cancer greatly increases the chances of successful treatment. Currently, X-ray mammography is mostly used for screening; this shows the breast density image through exposing the human body to ionizing radiation. However, interpreting a mammogram can be difficult because women’s normal breasts can appear differently. In particular, for women with denser breasts, the breast density can obscure cancer. As the breast density increases, the accuracy of the mammogram decreases. Other modalities such as ultrasound, computed tomography, and magnetic resonance imaging are either less effective or too costly. For this reason, we need additional modalities to improve breast cancer detection in women.
Microwave imaging has the potential to provide effective tumor detection owing to a significant contrast in the dielectric properties of normal and malignant breast tissues at microwave frequencies [2, 3]. Microwave imaging was first used during the 1980s [4]. However, the application of microwaves in biomedical imaging and diagnostics remains a field with many uncharted territories [5]. The microwave medical imaging techniques presently being pursued are generally radar- or tomography-based approaches. The first type of approach identifies tumors by synthetically focusing reflections from the breast [6-9]. Meanwhile, the second recovers the breast dielectric properties based on an electromagnetic inverse reconstruction from the amplitude and phase data acquired by antennas positioned around the breast [10-15]. We have been developing the second type of approach to show a quantitative dielectric image of the inside of the breast. As a result, we developed our first prototype microwave tomography (MT) system operating at 0.5 to 3 GHz [13]. In addition, we successfully completed an animal trial (dog breast cancer screening) using the prototype system [14]. However, we found that some MT images are limited when it comes to clearly detecting small tumors.
To increase the imaging resolution, we have considered an increase in illuminating microwave frequency; our selected frequency range is 3 to 6 GHz. This leads to the challenge of implementing the high dynamic range of the radio frequency (RF) transceiver and fine spatial measurements to avoid missing small tumor signals.
In this paper, we present an experimental measurement system as a minimal test bed developed for precision MT operating at 3 to 6 GHz, and demonstrate the measurement results using the prepared test bed system. Finally, some concluding remarks and a description of future works are addressed.
In our new conceptual MT system, called a precision MT system, the patient lies down flat on a bed and the breast is placed in the microwave illumination tank, which is similar with our previous MT system [13]. The new system operates at 3 to 6 GHz to increase the imaging resolution. The sensing mechanism and RF channels are also advanced. For the sensing mechanism, one or several layered antenna arrays surrounding the breast mechanically scan along the rotational and/or vertical direction. During each movement step, one antenna transmits a microwave signal, and some or all of the other antennas receive the scattered signal. This data measurement step repeats until reaching the last antenna element.
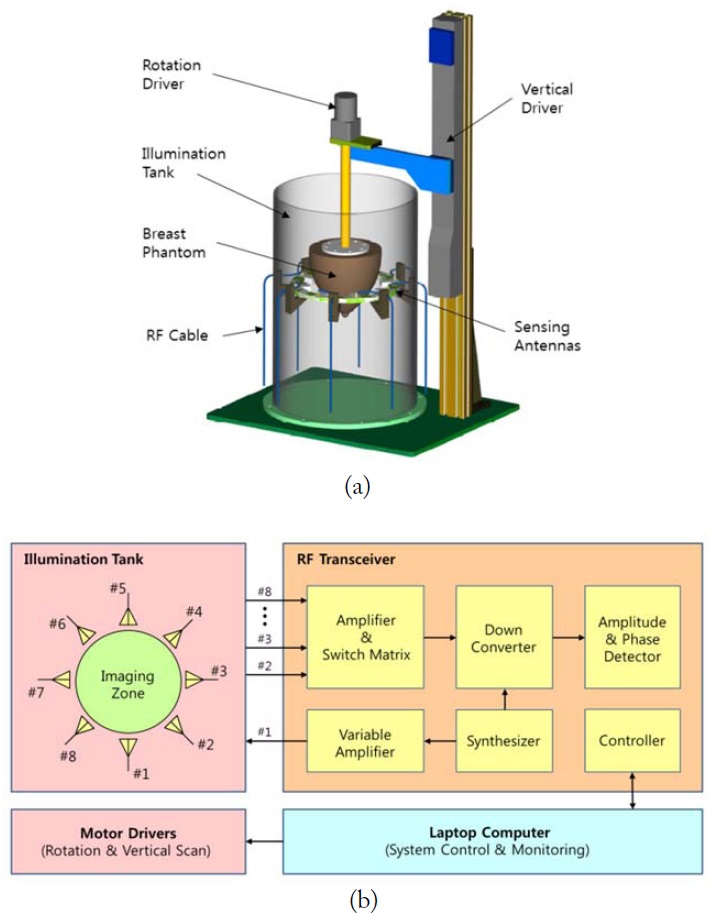
Before achieving the final version of the new MT system, we developed a minimal test bed system to verify the original main concept. The measurement system of the test bed is illustrated in Fig. 1(a). The ring structure with eight antenna elements is horizontally placed in a bath to surround the breast phantom. The diameter formed by the antenna element apertures is 150 mm, which is the imaging space. The bath is filled with microwave-matching liquid of the breast. The liquid used is 1,3-butylene glycol (13BG), which is a non-toxic material (often used in cosmetic and food preparations) with a low-loss dielectric property.
The breast consists of several significant tissues, namely skin, fat, and fiber glands. Here, we used 13BG as the matching liquid, as this has similar dielectric properties to breast fat. Actually, a slightly higher permittivity value of 13BG is more favorable when the breast skin (
[Table 1.] Relative permittivity and conductivity
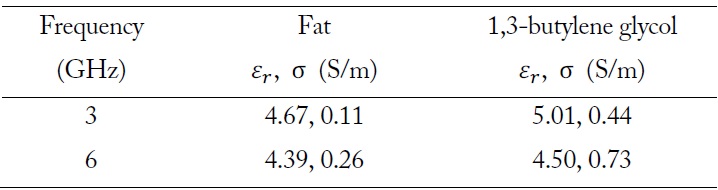
Relative permittivity and conductivity
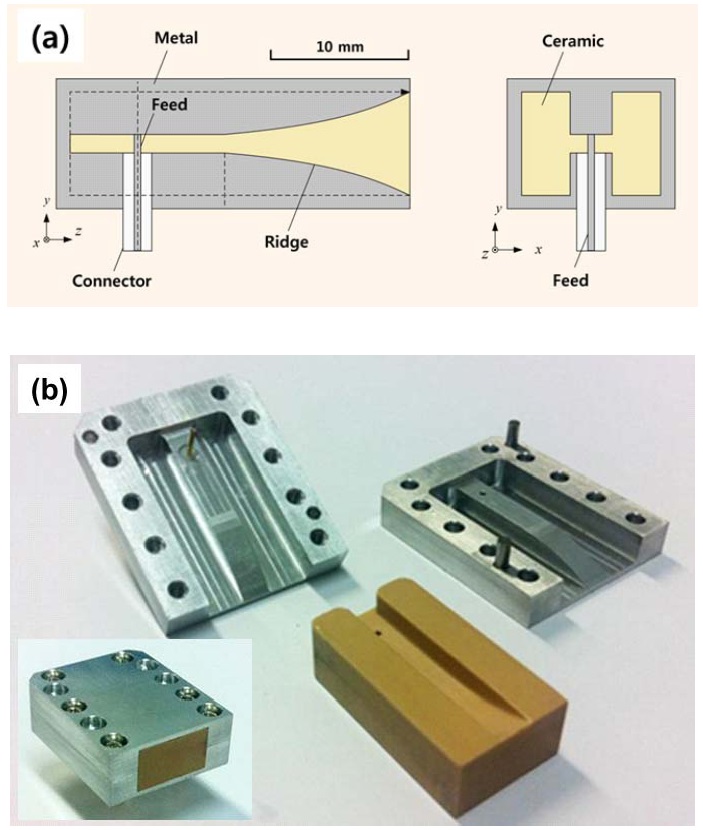
Fig. 2 shows the antenna element used in the measurement system. This is the designed to be a ceramic-filled double ridge waveguide type [16]. The pair of ridges protruding into the center of the waveguide provides a wide frequency bandwidth, suppressing the higher mode, and the ceramic compound filler in the waveguide provides proper matching with the immersion liquid.
For easy implementation of the experimental test bed, instead of moving the sensing antenna array for data measurement, the breast phantom mechanically rotates and moves up and down. In addition, the eight antennas are separated to transmit and receive the microwave signal.
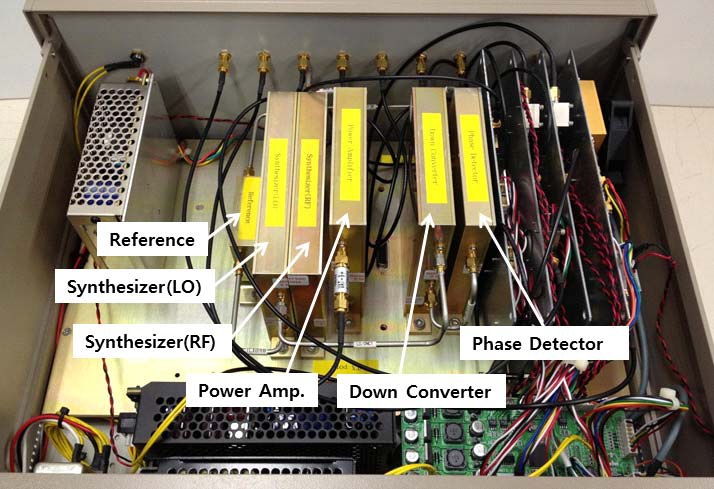
The RF cables extending from each antenna element are connected with the RF transceiver. The block diagram of the test bed system is presented in Fig. 1(b), including the inner connection of the RF transceiver. The gain of the variable amplifier for transmitting can be adjusted to avoid receiving power saturation, especially of the receiving (Rx) antennas close to the transmitting (Tx) antenna. In addition, the switching matrix sequentially selects each Rx channel. The fabricated RF transceiver is shown in Fig. 3. The laptop computer operated by the user controls and monitors the RF transceiver and motor drivers for data measurement.
Using the test bed system described in Section II, we performed a test to verify the antenna performance, measurement uncertainty, and the sensing spatial resolution according to the operating frequency.
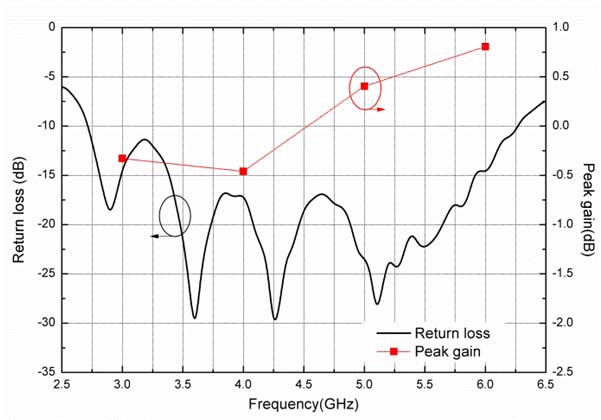
Fig. 4 shows the measured antenna performance in the context of the matching liquid. The return loss was maintained at below –10 dB from 3 to 6 GHz, and the peak gain was found to be almost 0 dBi in this frequency range.
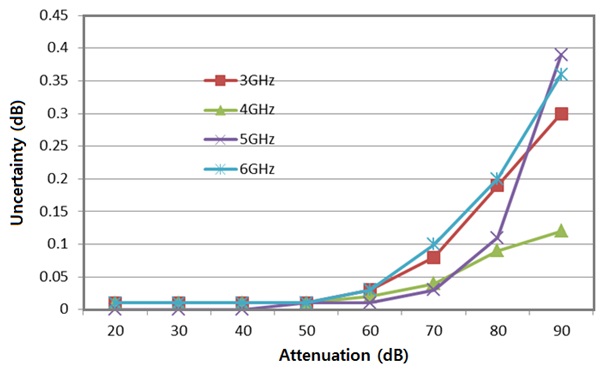
Fig. 5 shows the measurement uncertainty according to the operating frequency. For the test, one Tx port was directly connected to one Rx port using a RF cable and a step attenuator. The Tx power was set to –10 dBm, and the uncertainty was measured at every 10 dB attenuation from 0 to 90 dB. The maximum attenuation level of 13BG was about 80 dB at 6 GHz at the furthest distance between antennas (i.e., 150 mm). According to the test results, we confirmed that the maximum measurement uncertainty was 0.2 dB and the minimum Rx power was –90 dBm.
The Tx power level of RF transceiver can be adjusted between –10 and 20 dBm according to the position of the Rx antenna. The used power level is safe for human body, as it is much smaller than the 1.6 W/kg standard of the Federal Communications Commission (FCC).
Up to now, we have presented the test results at the subsystem level. Next, the fully integrated system will be tested.
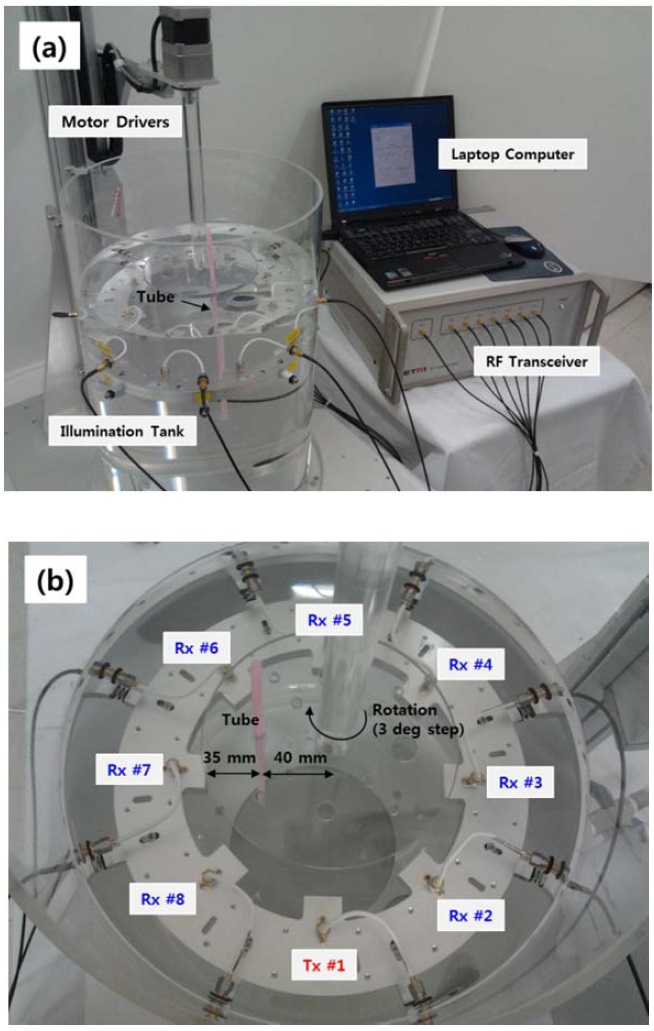
Fig. 6 shows the prepared experimental environment including the fully integrated measurement system and a detailed view of the illumination tank. The ring structure with eight antenna elements is deeply immersed in a bath filled with mi-crowave-matching liquid. The antenna marked with Tx #1 transmits a single continuous wave signal, and the other antennas receive the scattered signal. The measurement frequencies for this test are 3, 4, 5, and 6 GHz.
The measurement object included in the bath is a water-filled thin plastic tube of 5 mm in diameter, which is placed 35 mm away from the aperture of Rx #7 (see Fig. 6(b)). The position is set as a 0 degree angle and the object rotates clockwise to acquire measurement data at intervals of 3 degrees.
For the verification test, the test object could actually be made from any kind of material, such as distilled water, saline solution, metal, and so on, as long as it provides a dielectric contrast from the background medium. Here, we simply used a water-filled plastic tube (
Under this environment, we first measured the amplitude and phase at each Rx antenna under a homogeneous bath and then measured them again at every 3-degree step in the presence of the thin plastic tube. Finally, we acquired the calibrated measu-rement data from the subtraction between the two measurement datasets.
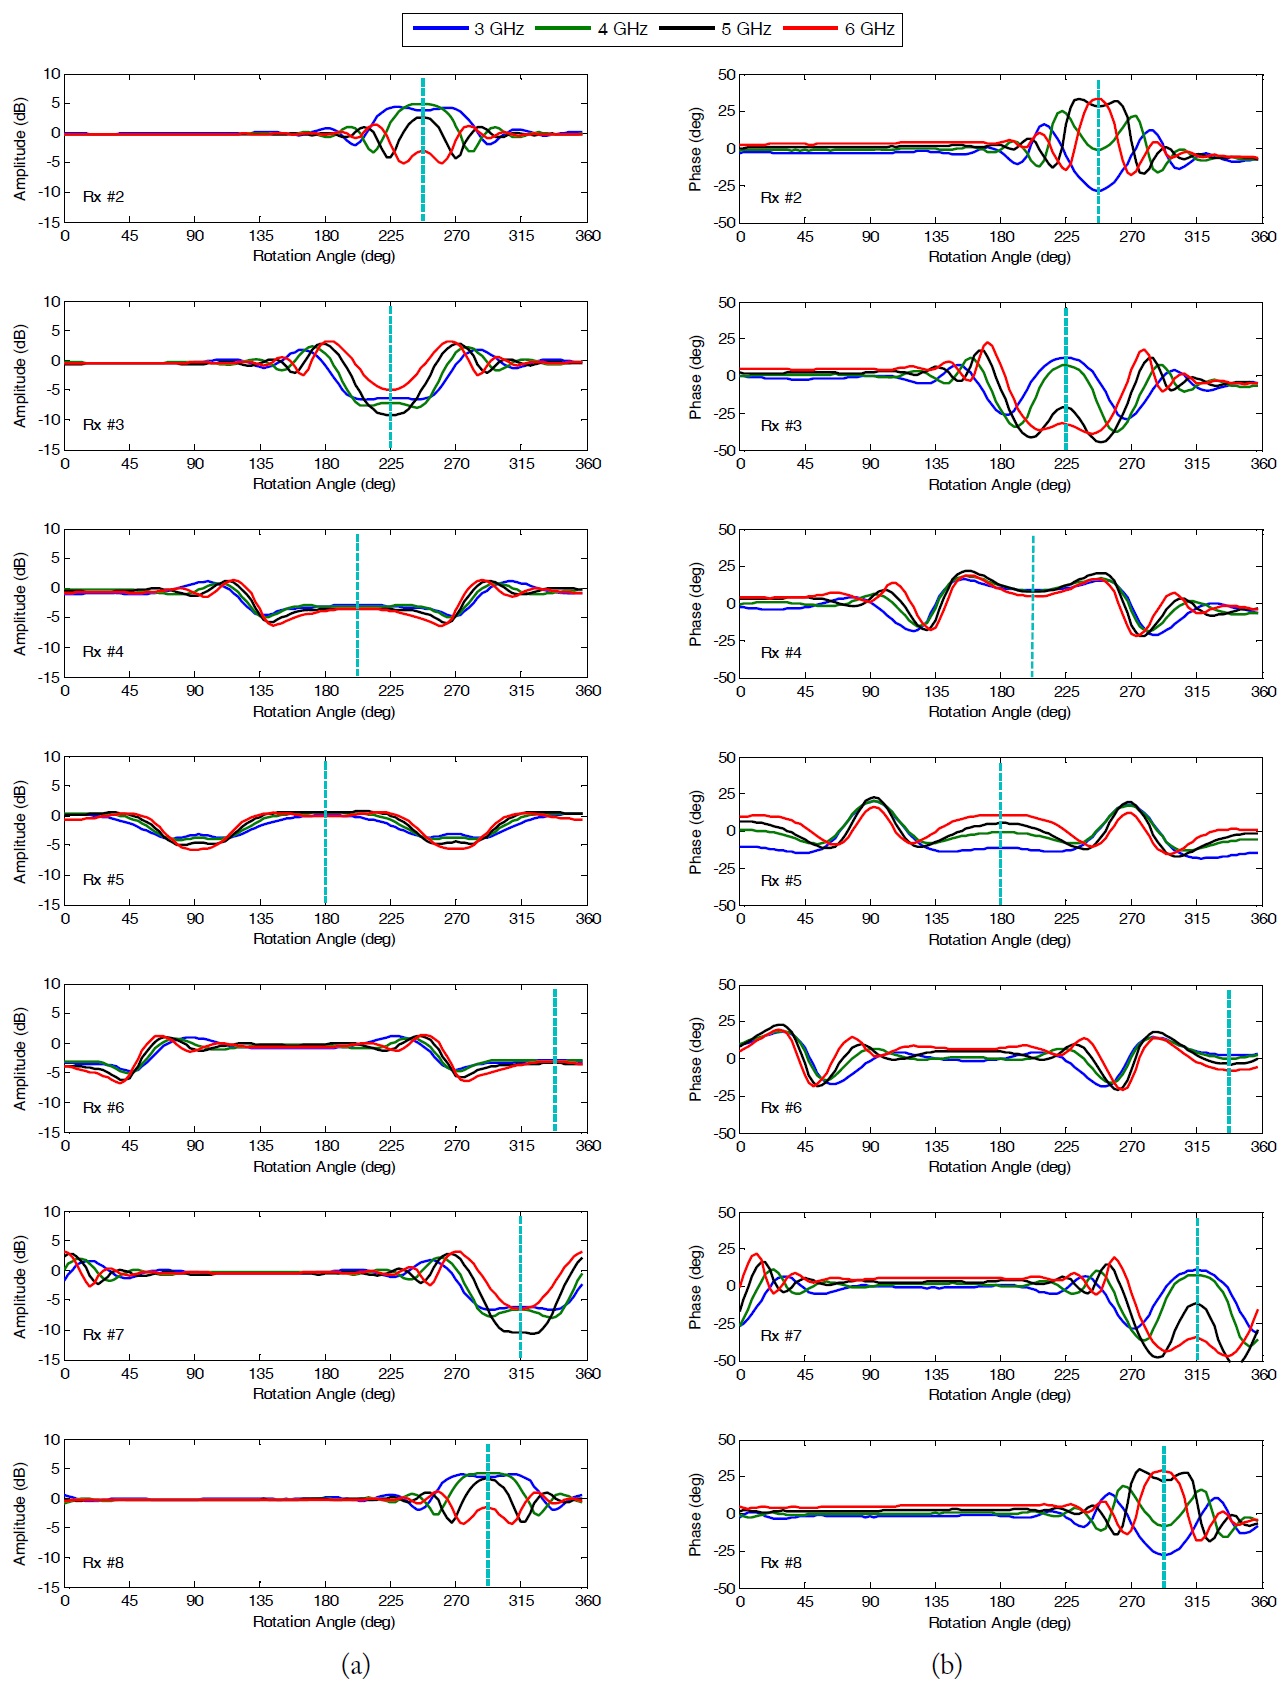
The calibrated amplitude and phase dataset of each receiver are plotted as shown in Fig. 7. For this experimental test, we can investigate the results as follows:
1) The measured dataset of each Rx antenna should have a symmetrical pattern. The symmetrical point will be realized when the tube is positioned between Tx antenna and the measuring Rx antenna. For example, the measured data set of Rx #3 shows a symmetrical pattern for the point at 225 degrees, which is in between Tx #1 and the measuring Rx #3 antennas (i.e., in front of the Rx #2 antenna).
2) The measured datasets of both Rx antennas located symmetrically from the Tx antenna (Tx #1) should be the same. The symmetrical point will simply be shifted. The pairs of Rx #2 and #8, Rx #3 and #7, and Rx #4 and #6 have the same data patterns, but these are simply shifted (see the dashed lines in Fig. 7).
3) The higher frequency will provide a higher spatial resolution during the measurement, because the ability of an imaging system to resolve detail is ultimately limited by diffraction [17]. In the test, Rx #2 (or Rx #8) easily shows that the angular distance to the first null from a central spot of 6 GHz is narrower than that at other frequencies. Thus, the reconstructed image at the higher frequency is expected to have a better resolution, but the quality will depend on the reconstruction algorithm and the noise level of the measurement data.
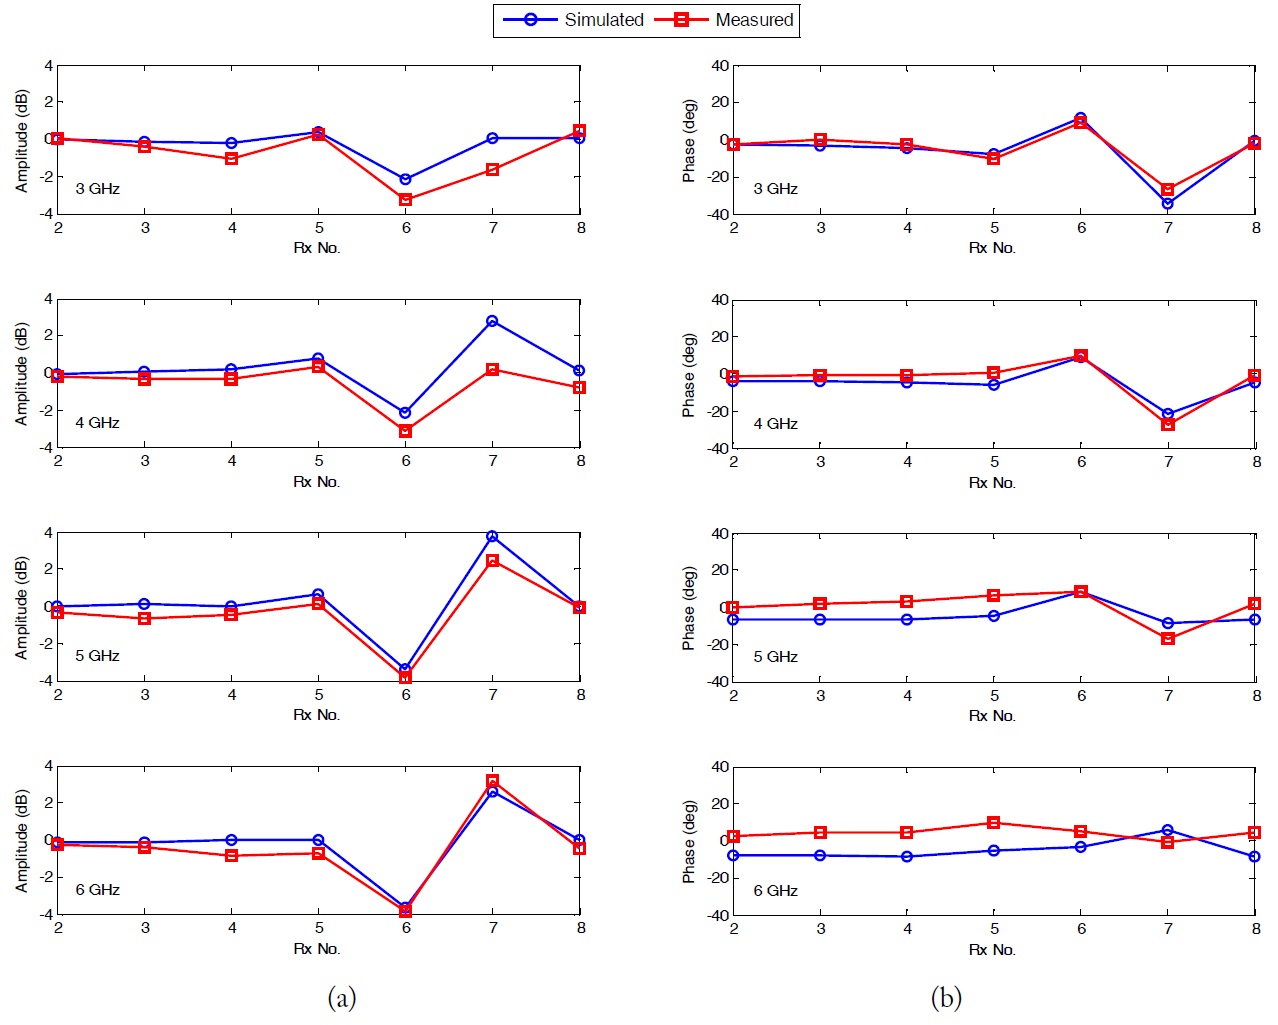
We conducted a computer simulation to cross-check the real measurement data. In the simulation, we used the CST Microwave Studio of 3D electromagnetic software. The simulation model is the same as that shown in Fig. 6: the water-filled tube of 5 mm in diameter was placed 35 mm away from the aperture of Rx #7 in the background medium of 13BG. Under the stationary condition (the rotation angle of 0 degrees), the Tx antenna (Tx #1) transmitted a signal and the Rx antennas (Rx #2 to #8) received the propagated signal. The simulation dataset of the calibrated amplitude and phase was compared with the real measurement, as shown in Fig. 8.
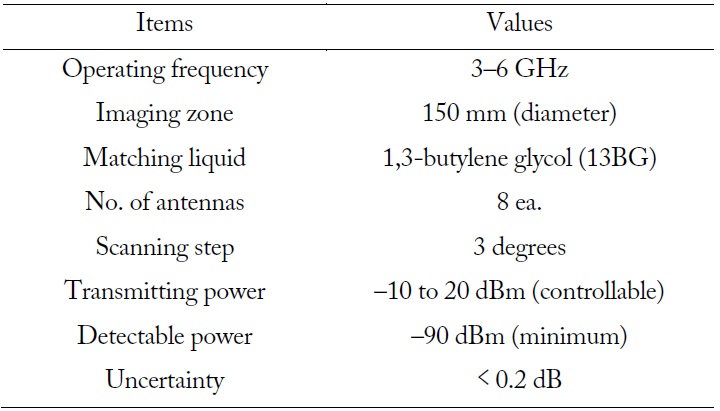
The comparison showed good agreement between the mea- surement and simulation. However, we observed a slightly different pattern in the 6 GHz phase. This appears to have been caused by the different setting of the dielectric properties of the background medium in the simulation. As described above, we performed several tests to verify the developed test bed system, and the summarized specification is shown in Table 2.
[Table 2.] Specifications of the developed measurement system

Specifications of the developed measurement system
In this paper, we presented our experimental test bed of a precision MT system for early-stage breast cancer detection. To verify the conceptual system in advance, we first developed an eight-channel test bed system operating at 3 to 6 GHz with mechanical scanning of 3-degree steps. Using the test bed, we performed the data measurement in the case of a water-filled thin plastic tube of 5 mm in diameter in order to compare the sensing spatial resolutions. The dataset measured at higher frequency showed a higher spatial resolution, suggesting that the microwave tomographic image became more precise. The measurement dataset was confirmed through comparison of computer simulation.
This work was supported by the ICT R&D program of MSIP/IITP (11-911-01-108, Development of Precision MT System).