We often see that some negative shocks in a financial market have similar effects on other markets with lags of certain length. If markets were perfectly segregated, this kind of effect is not observed. In reality, however, international financial markets have become increasingly interdependent because of recent trends of capital liberalization and market integration, among other reasons. Kose, Otrok, and Whiteman (2010), for example, report the existence of a common world factor, which is an important source of business cycles in most countries. They also note that the influence of common factors tends to increase during this period of financial globalization.
The recent global financial crisis originated in the world’s largest economy: the U.S. (Cheung
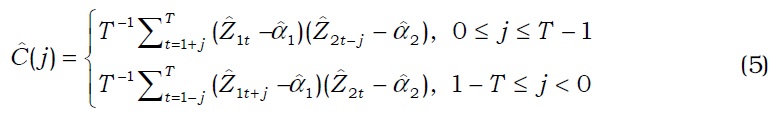
In this paper, we study risk spillover based on downside values at risk (VaR). VaR was originally proposed by J.P. Morgan (1994) and has become a standard measure for controlling and monitoring downside market risk. This measure indicates the degree to which the underlying financial asset can lose its profit within a certain period. In terms of statistics, VaR corresponds to the left-tail quantile of a distribution. Our approach to the investigation of risk spillover is to test Granger causality in VaR from one market to other markets. Grangercausality in VaR was introduced by Granger (1980) and further studied by Hong, Liu, and Wang (2009), among a few other researchers.
Our empirical work is based on daily observations from 1 July 2004 to 1 July 2010. We set July 2007 as the starting point of the crisis following Cheung
Our result shows that the extreme risk spillover from the U.S. stock market to most Asian stock markets became significant after the global financial crisis. Specifically, downside movement in the U.S. stock market Granger-caused downside movement in Korean stock market at the 1% VaR level after the crisis and the stock markets of China, Hong Kong, Japan and Taiwan, at 5% level. Moreover, downside movement in a U.S. stock index significantly created a Granger-caused depreciation of all Asian currencies under study after the crisis. In addition, downside movement of a U.S. stock index created significant Granger-caused upside movements in international gold prices, which implies that extreme movements in riskier assets increased the demand for safer assets. In our analysis, it is not clear what the world common factor is that is related to the recent financial crisis, as noted in Kose, Otrok, and Whiteman (2010). Shocks in the U.S. market may contain world common factors. Alternatively, shocks in the U.S. market could possibly be transmitted to other markets through world common factors.
The discussion of the paper is as follows. Section II explains how to detect the risk spillover effect in financial markets. Section III provides our empirical results and Section IV concludes the paper.
II. Extreme Risk Spillover and Econometric Inference
>
A. A Measure of Extreme Market Movements: Value at Risk
We consider the following model for a stochastic process {

where

Then, VaR at level

where z(
>
B. Method of Testing for Granger Causality in Value at Risk
We let Ω
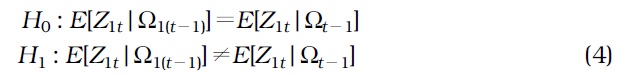
The Granger causality between two processes in its most general form is defined as follows:
Definition (Granger causality) The process Granger-causes if
This general version of Granger causality can be applied naturally to the above VaR between two processes, as studied by Hong
Definition (Granger causality in VaR level
Hong
Heuristically, the existence of Granger causality from

where .
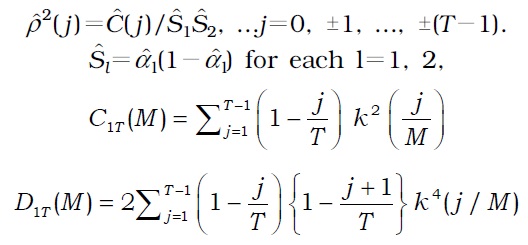
To test for Granger causality in VaR, as defined in Equation (4), Hong

where (

Clearly, the above statistics depend on the choice of the kernel
>
C. Models for Conditional Heteroscedasticity
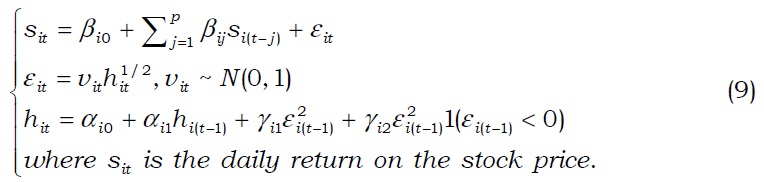
The test statistic defined in Equation (6) depends on VaRs. Because VaR is an unobserved value, we need to estimate it. In practice, J.P. Morgan’s (1997) Risk Metrics uses the following model that is widely use (Hong


As in Equation (8), the daily return of financial assets is set to be a GARCH (1, 1) model, which is known to capture most of volatility clustering phenomena of financial assets (

If

where
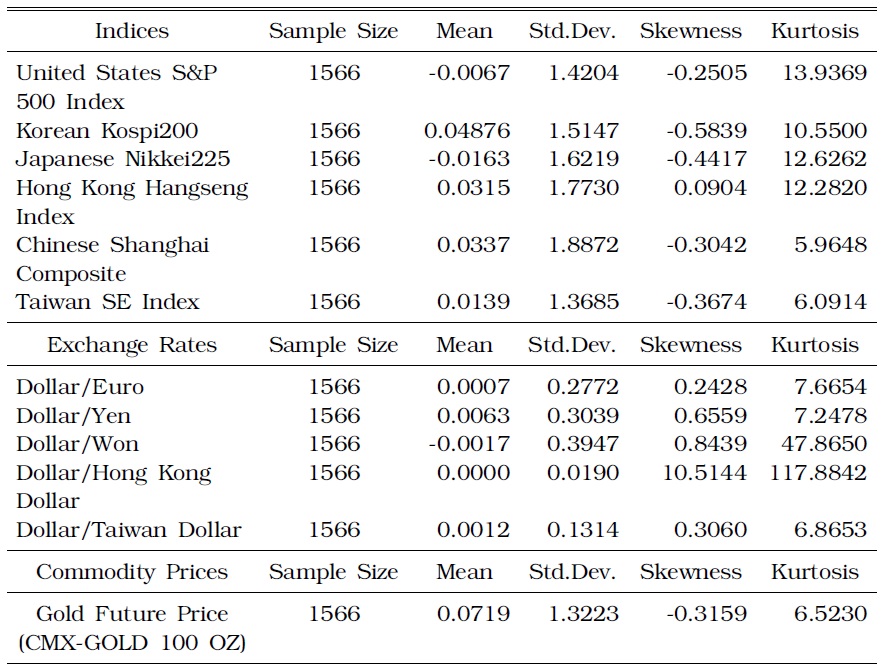
Data are obtained from daily observations from 1 July 2004 to 1 July 2010. We define July 2007 as the starting point of the crisis, in accordance with Cheung

SUMMARY DESCRIPTIVE STATISTICS FOR DAILY STOCK PRICE, EXCHANGE RATE, AND GOLD COMMODITY PRICE CHANGES
>
B. Estimation Results for Conditional Heteroscedasticity
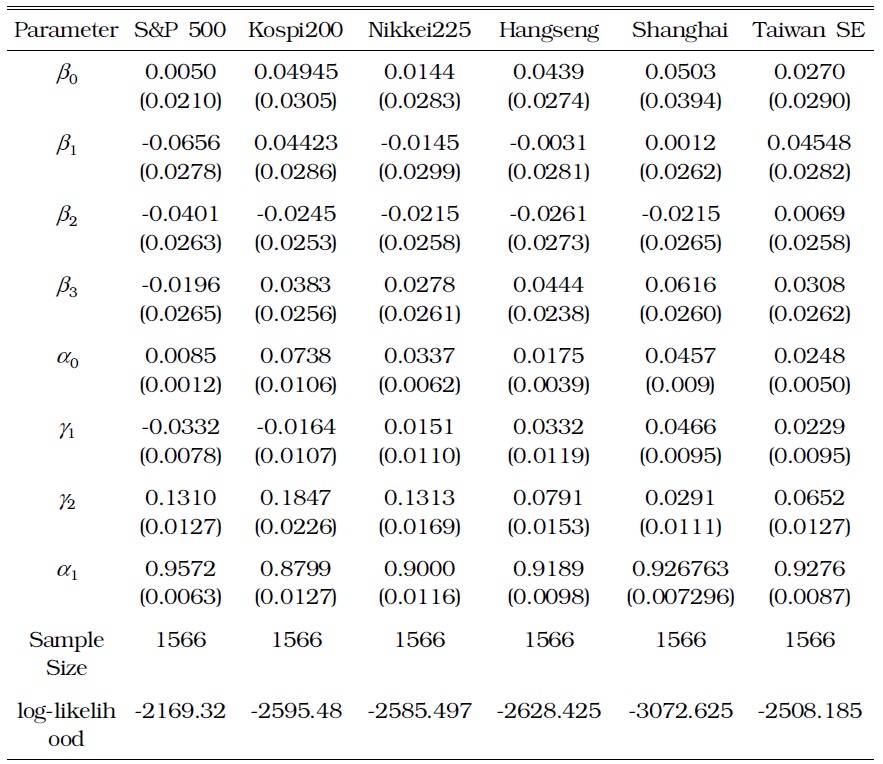
Estimation results of parameters in (9) are reported in Table 2 and Table 3. In all six stock indices of S&P 500, KOSPI 200, Nikkei 225, Hang Seng, Shanghai, and Taiwan SE, there is a highly significant leverage effect (
[TABLE 2] MAXIMUM LIKELIHOOD ESTIMATION OF UNIVARIATE GARCH MODELS FOR DAILY STOCK PRICE CHANGES

MAXIMUM LIKELIHOOD ESTIMATION OF UNIVARIATE GARCH MODELS FOR DAILY STOCK PRICE CHANGES
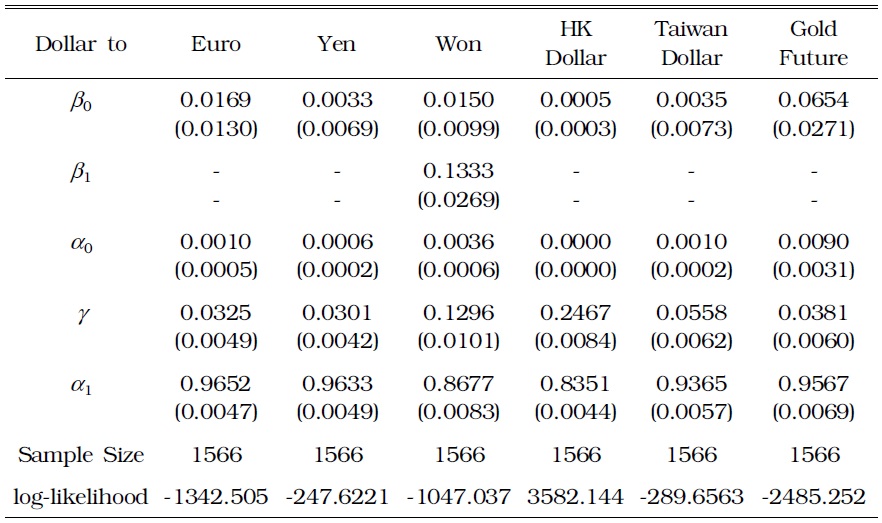
MAXIMUM LIKELIHOOD ESTIMATION OF UNIVARIATE GARCH MODELS FOR DAILY EXCHANGE RATE AND GOLD FUTURE PRICE CHANGES
>
C. Extreme Risk Spillover: Global Stock Markets
1. S&P 500 and Korean KOSPI 200
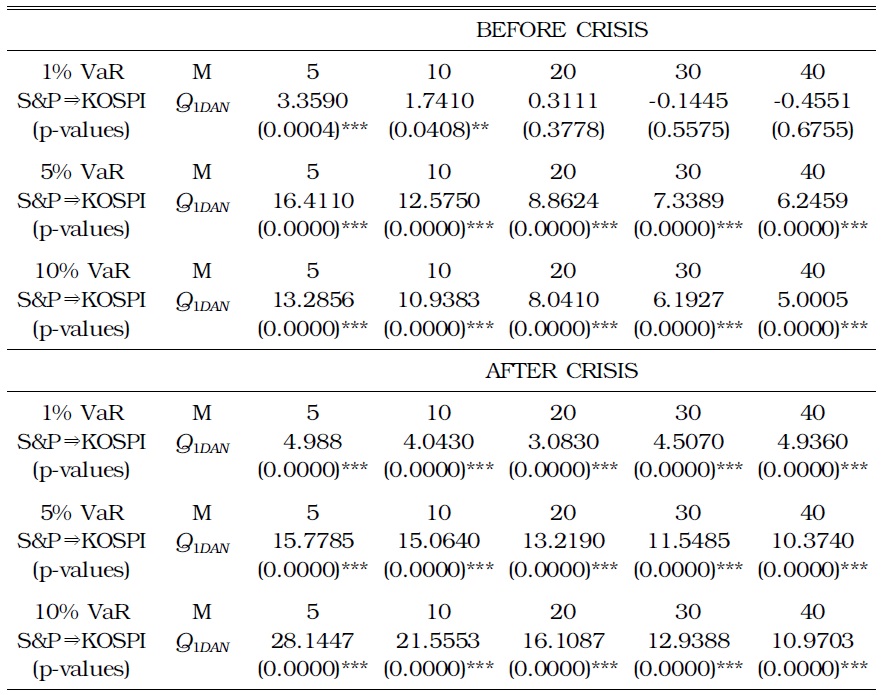
The test results in Table 4 show a significant extreme risk spillover effect from the U.S. to Korean stock markets in both periods of before and after July 2007. However, in both periods, causality in the opposite direction (Korea ⇒ U.S.) was not confirmed at any level of the VaR under consideration (Table 5). Effects of risk spillover from the U.S. to Korean markets intensified during the global financial crisis. Downside movement in S&P500 during the crisis Grangercaused a downside movement in KOSPI200 at
[TABLE 4] TESTING FOR RISK SPILLOVER FROM THE U.S. TO THE KOREAN STOCK MARKET
TESTING FOR RISK SPILLOVER FROM THE U.S. TO THE KOREAN STOCK MARKET
[TABLE 5] TESTING FOR RISK SPILLOVER FROM THE KOREAN TO THE U.S. STOCK MARKET
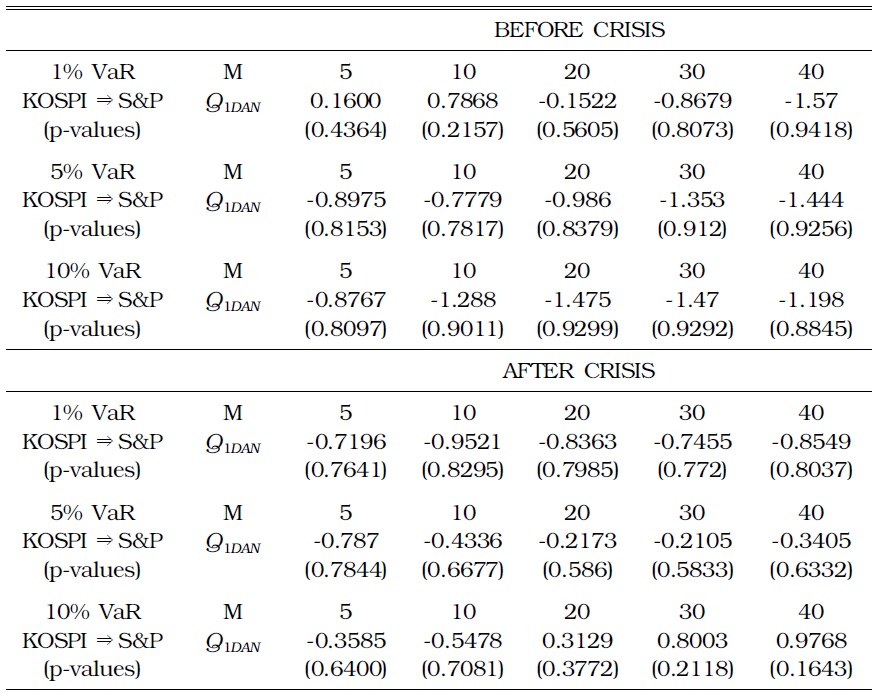
TESTING FOR RISK SPILLOVER FROM THE KOREAN TO THE U.S. STOCK MARKET
2. S&P 500 and Taiwan SE Indices
Table 6 and 7 present the results of the Taiwanese markets. We find evidence of Granger causality in VaRs from S&P 500 to the Taiwan SE index in both periods. There is a stronger evidence of risk spillover from the U.S. to Taiwanese stock market during the crisis at the 5% VaR level. In addition, we can see evidence of Granger causality at the 10% VaR level from Taiwan to the U.S. stock markets.
[TABLE 6] TESTING FOR RISK SPILLOVER FROM THE U.S. TO THE TAIWANESE STOCK MARKET
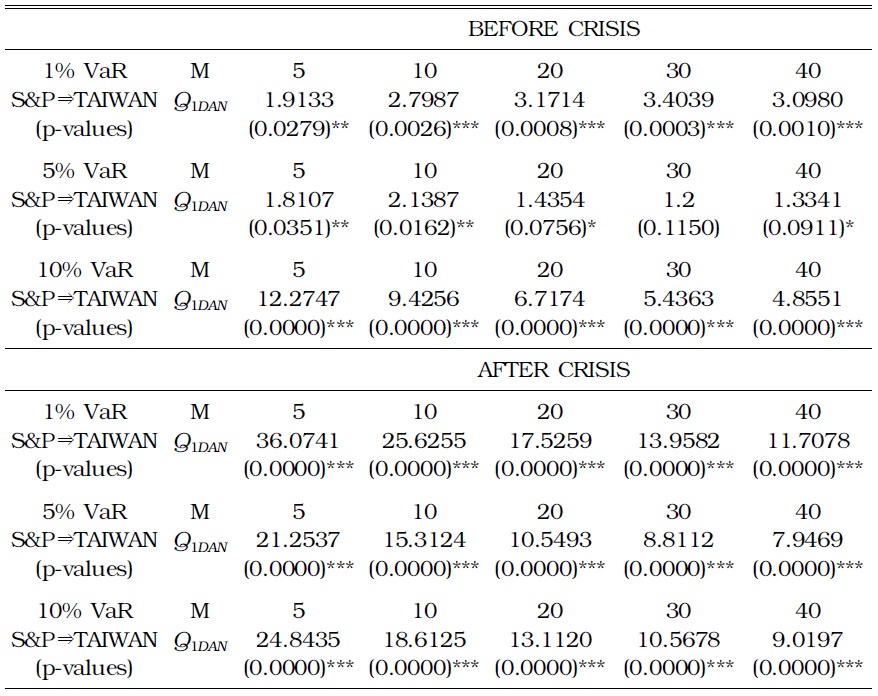
TESTING FOR RISK SPILLOVER FROM THE U.S. TO THE TAIWANESE STOCK MARKET
[TABLE 7] TESTING FOR RISK SPILLOVER FROM THE TAIWANESE TO THE U.S. STOCK MARKET
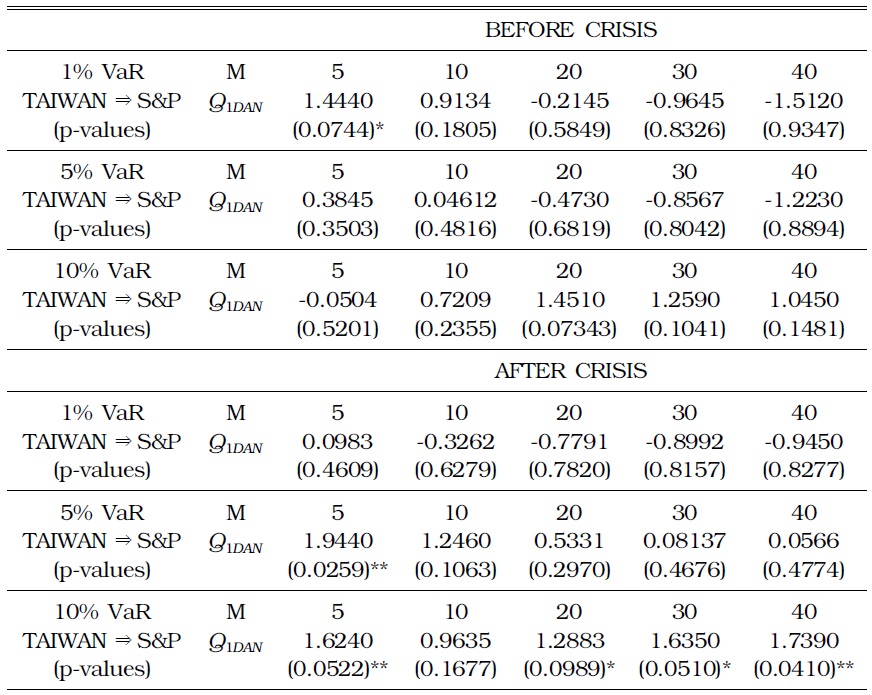
TESTING FOR RISK SPILLOVER FROM THE TAIWANESE TO THE U.S. STOCK MARKET
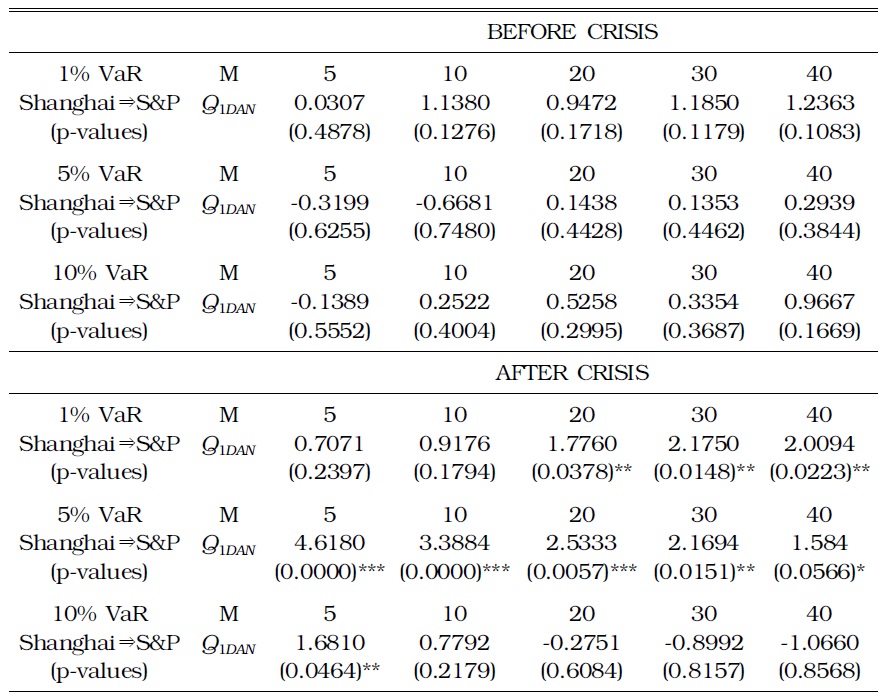
3. S&P 500 and Shanghai Commodity Indices
Table 8 and 9 show the results of between S&P 500 and Shanghai Commodity indices. Granger causality from the former to the latter intensified during the crisis at the 10% VaR level. Moreover, there is evidence of risk spillover from the Shanghai Commodity to the S&P 500 during the crisis, at the 5% VaR level.
[TABLE 8] TESTING FOR RISK SPILLOVER FROM THE U.S. TO THE CHINESE STOCK MARKET
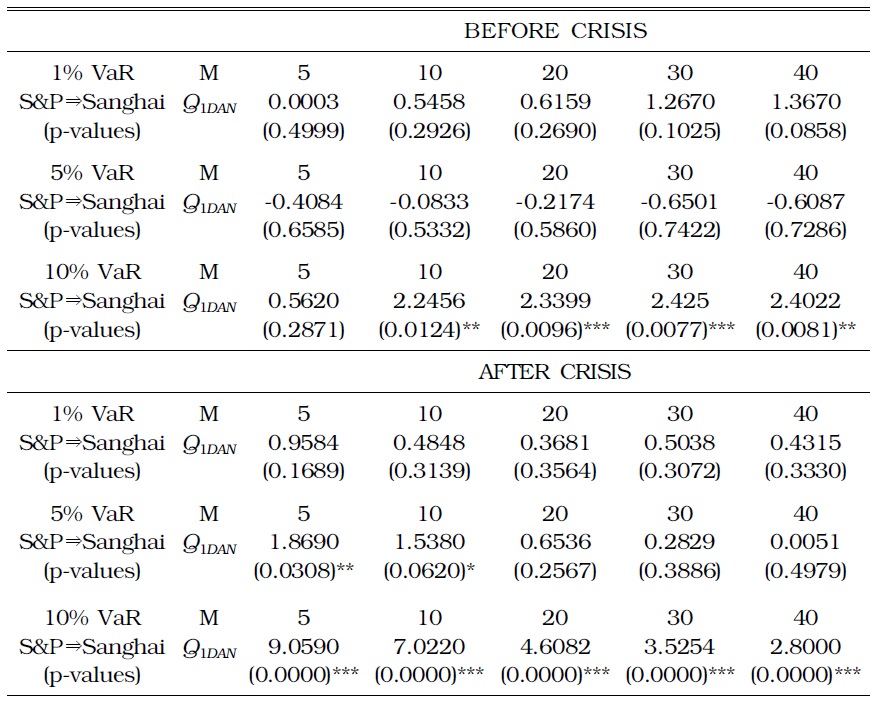
TESTING FOR RISK SPILLOVER FROM THE U.S. TO THE CHINESE STOCK MARKET
[TABLE 9] TESTING FOR RISK SPILLOVER FROM THE CHINESE TO THE U.S. STOCK MARKET

TESTING FOR RISK SPILLOVER FROM THE CHINESE TO THE U.S. STOCK MARKET
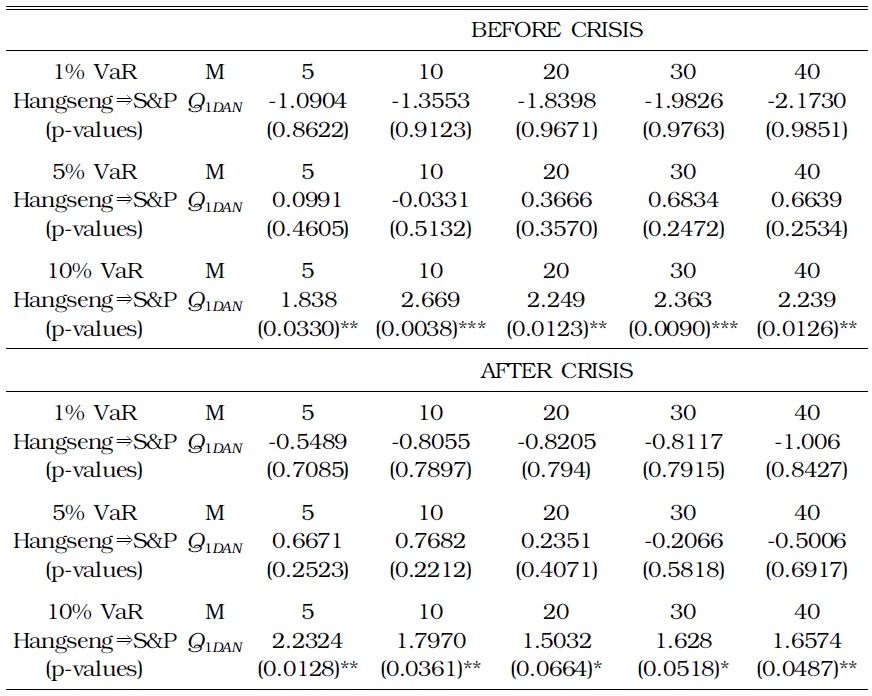
4. S&P 500 and Hang Seng Indices
S&P 500 significantly Granger-caused the Hang Seng Index at all VaR levels in both periods (Tables 10 and 11). In addition, the Hang Seng Index had some spillover effects on S&P 500 at the 10% level of VaR, before and during the crisis.
[TABLE 10] TESTING FOR RISK SPILLOVER FROM THE U.S. TO THE HONG KONG STOCK MARKET
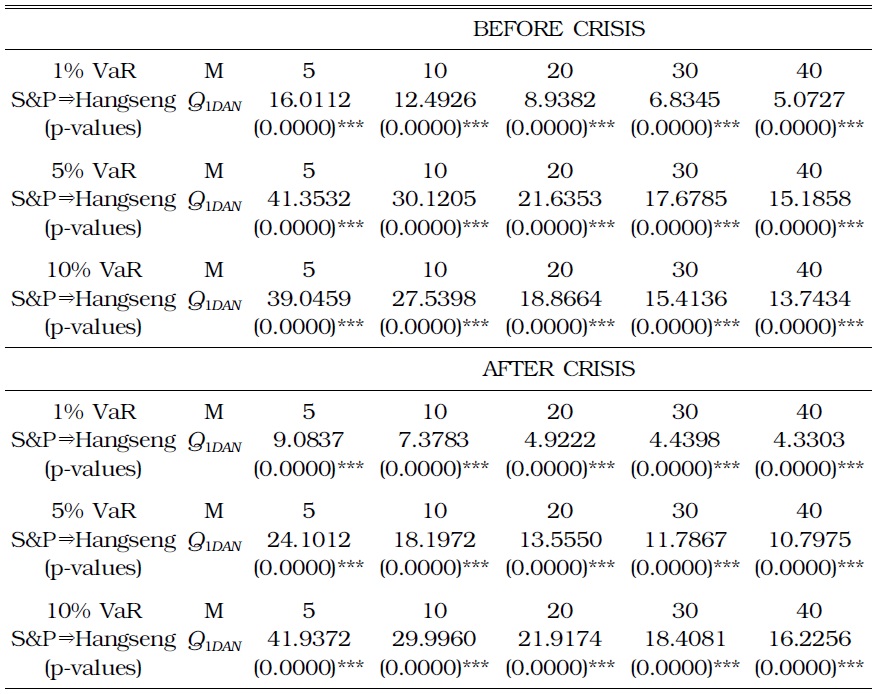
TESTING FOR RISK SPILLOVER FROM THE U.S. TO THE HONG KONG STOCK MARKET
[TABLE 11] TESTING FOR RISK SPILLOVER FROM THE HONG KONG TO THE U.S. STOCK MARKET

TESTING FOR RISK SPILLOVER FROM THE HONG KONG TO THE U.S. STOCK MARKET
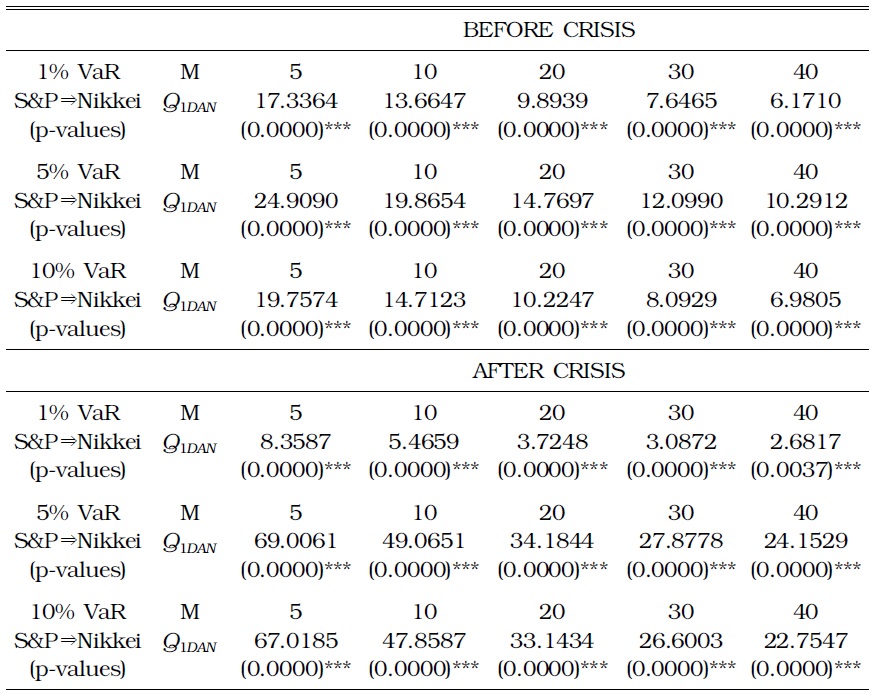
5. S&P 500 and Japanese Nikkei Indices
Table 12 and 13 show the results between S&P 500 and Japanese Nikkei indices. The former significantly Granger-caused the latter at all VaR levels, in both periods. Results in the other direction of causation are not evident.
[TABLE 12] TESTING FOR RISK SPILLOVER FROM THE U.S. TO THE JAPANESE STOCK MARKET

TESTING FOR RISK SPILLOVER FROM THE U.S. TO THE JAPANESE STOCK MARKET
[TABLE 13] TESTING FOR RISK SPILLOVER FROM THE JAPANESE TO THE U.S. STOCK MARKET
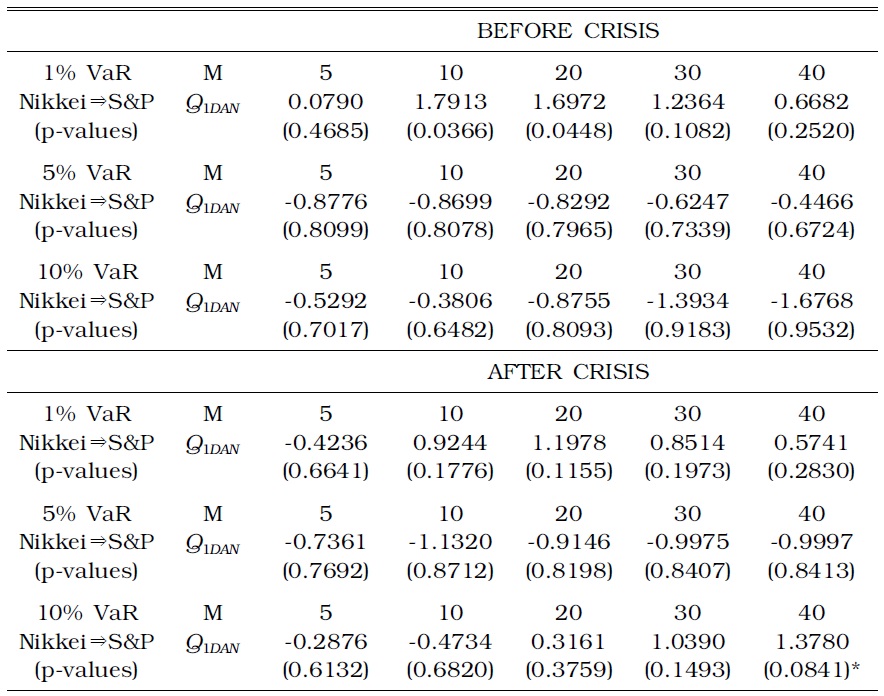
TESTING FOR RISK SPILLOVER FROM THE JAPANESE TO THE U.S. STOCK MARKET
Risks from the U.S. stock market spilled over to Asian stock markets, and the effects became more significant during the global financial crisis, especially in the Taiwanese, Korean, and Chinese stock markets. Furthermore, the indices of some Asian stock markets such as the Shanghai, Hang Seng, and Taiwan SE indices had spillover effects in S&P 500.
>
D. Extreme Risk Spillover: From Stock Markets to Currency Markets
Lee (2003) argues that stock and currency markets in most Asian countries have developed increasingly close relationships after the financial crisis in 1997. Lee (2003) reports that in most Asian countries, Granger causality from the stock market to the currency market is stronger than in the opposite direction. Lee’s (2003) analysis is based on Granger causality in the mean returns for stock and exchange markets. In addition, Lee and Lee (2009) investigated the way in which risk spills over between the Korean stock market and foreign exchange market, employing the method developed by Hong
In this section, we hypothesize that the global stock and exchange markets have become increasingly interdependent during the current financial crisis. Specifically, we test the hypothesis that extreme movements in the U.S. stock markets, as a benchmark case of risks, affect extreme movements in the currency markets of several countries.
1. Dollar/Euro rate
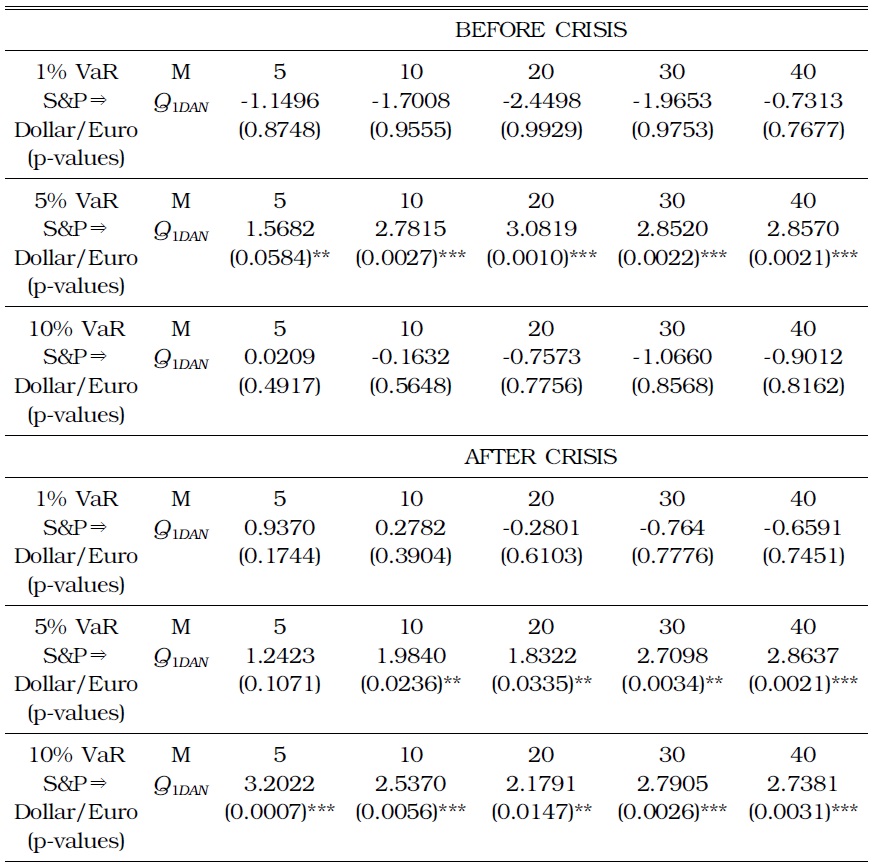
According to Table 14, downside movements in the U.S. stock market Granger-caused a large depreciation of the Euro currency at the 5% VaR level before the crisis. However, during the crisis, S&P 500 significantly Granger-caused downside movement in the Dollar/Euro rate at both the 5% and 10% VaR levels.
[TABLE 14] TESTING FOR RISK SPILLOVER FROM THE U.S. STOCK MARKET TO THE DOLLAR/EURO RATE

TESTING FOR RISK SPILLOVER FROM THE U.S. STOCK MARKET TO THE DOLLAR/EURO RATE
2. Dollar/Won rate
According to Table 15, downside movements in the U.S. stock market Granger-caused a large depreciation of the Korean Won at the 5% VaR level before the crisis. However, during the crisis, the S&P 500 Granger-caused downside movement in the Dollar/Won rate at all VaR levels. By contrast, as Table 16 shows, downside movement in the Korean stock market did not Granger-cause a large depreciation of the Korean Won at most VaR levels before the crisis. However, during the crisis period, KOSPI 200 significantly Granger-caused downside movements in the Dollar/Won exchange rate at all VaR levels.
[TABLE 15] TESTING FOR RISK SPILLOVER FROM THE U.S. STOCK MARKET TO THE DOLLAR/WON RATE
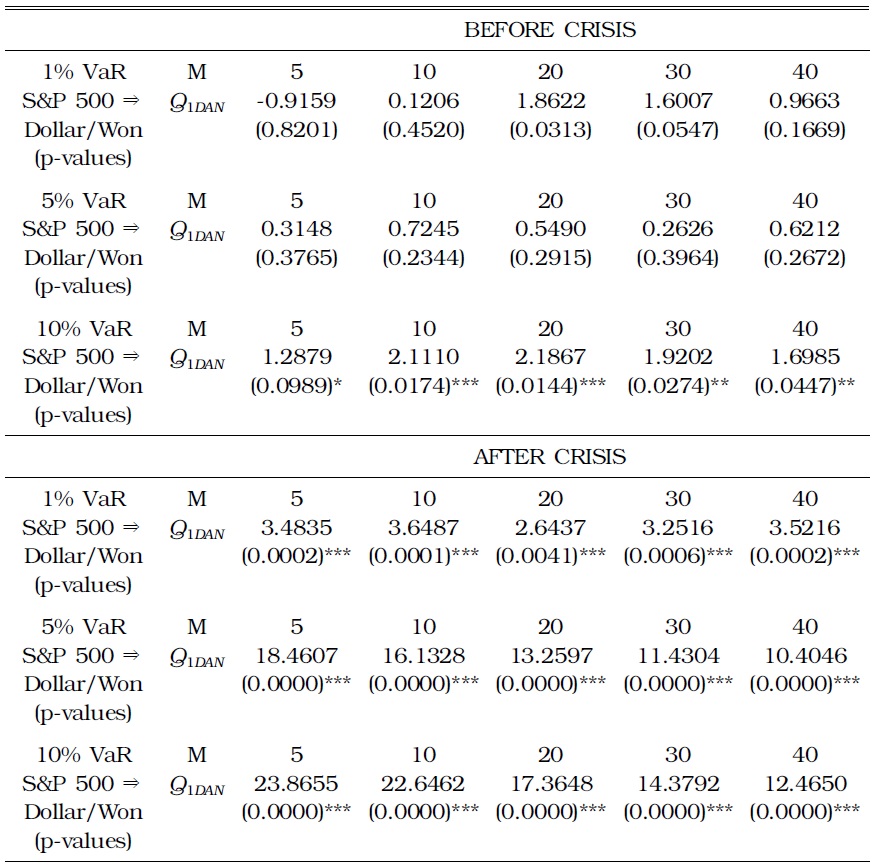
TESTING FOR RISK SPILLOVER FROM THE U.S. STOCK MARKET TO THE DOLLAR/WON RATE
[TABLE 16] TESTING FOR RISK SPILLOVER FROM THE KOREAN STOCK MARKET TO THE DOLLAR/WON RATE
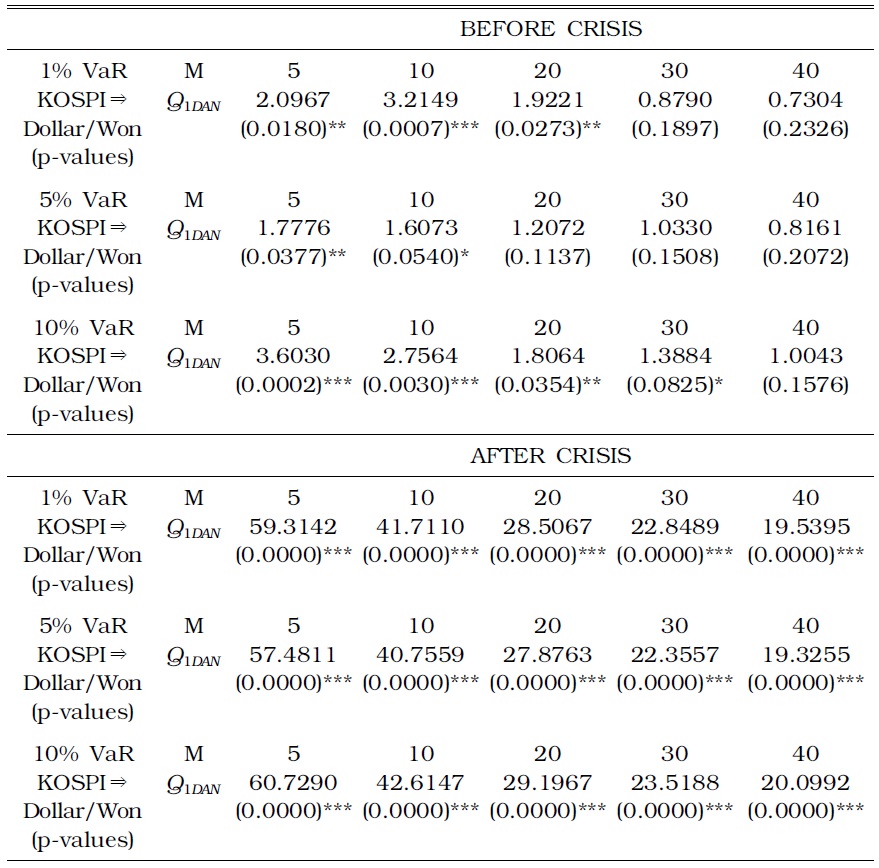
TESTING FOR RISK SPILLOVER FROM THE KOREAN STOCK MARKET TO THE DOLLAR/WON RATE
3. Dollar/Yen rate
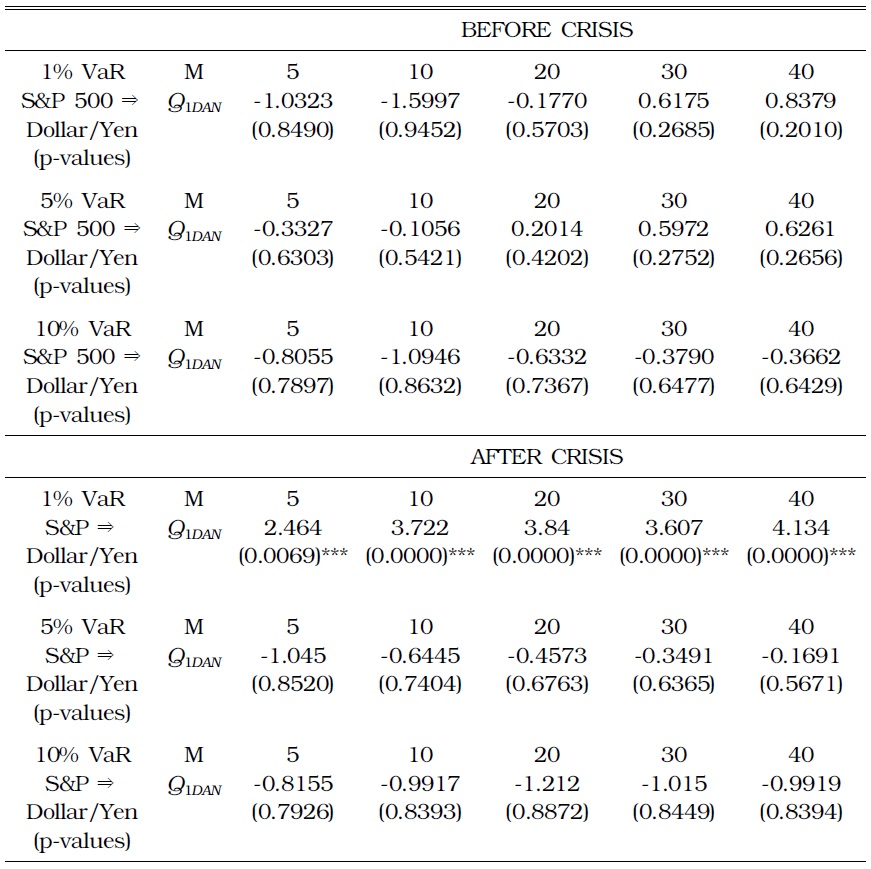
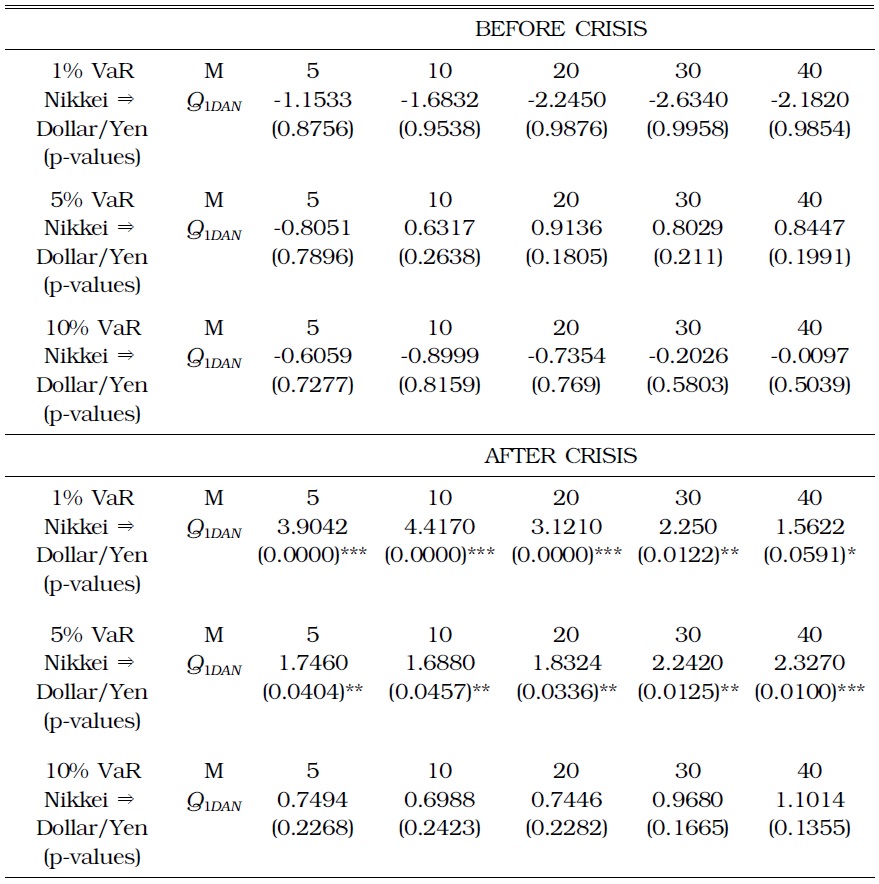
Table 17 shows the results for the Granger causality from the S&P 500 index to the Dollar/Yen exchange rate. Before the crisis, downside movements in the S&P 500 index did not Granger-cause a large depreciation of the Yen at all levels of VaR. However, during the crisis, S&P 500 significantly Granger-caused downside movements in the Dollar/Yen rate at the 1% VaR level. Table 18 shows the results between the Nikkei index and the Dollar/Yen exchange rate. Before the crisis, downside movements in the Nikkei index did not Grangercause a large depreciation of the Yen at all levels of VaR. However, during the crisis, the former significantly Granger-caused a large depreciation of the latter at the 1% and 5% VaR level.
[TABLE 17] TESTING FOR RISK SPILLOVER FROM THE U.S. STOCK MARKET TO THE DOLLAR/YEN RATE

TESTING FOR RISK SPILLOVER FROM THE U.S. STOCK MARKET TO THE DOLLAR/YEN RATE
[TABLE 18] TESTING FOR RISK SPILLOVER FROM THE JAPANESE STOCK MARKET TO THE DOLLAR/YEN RATE

TESTING FOR RISK SPILLOVER FROM THE JAPANESE STOCK MARKET TO THE DOLLAR/YEN RATE
4. Other currency markets: Hong Kong and Taiwan
As with other currency markets, extreme risk spillover from the U.S. market to the Taiwan and Hong Kong currency markets intensified during the crisis (Tables 19 and 20). In particular, before the crisis, downside movements in S&P 500 did not Granger-cause a large depreciation of the Taiwanese currency at all VaR levels. However, during the crisis, S&P 500 significantly Granger-caused downside movements in the Dollar/Taiwan Dollar rate at both the 5% and 10% VaR levels.
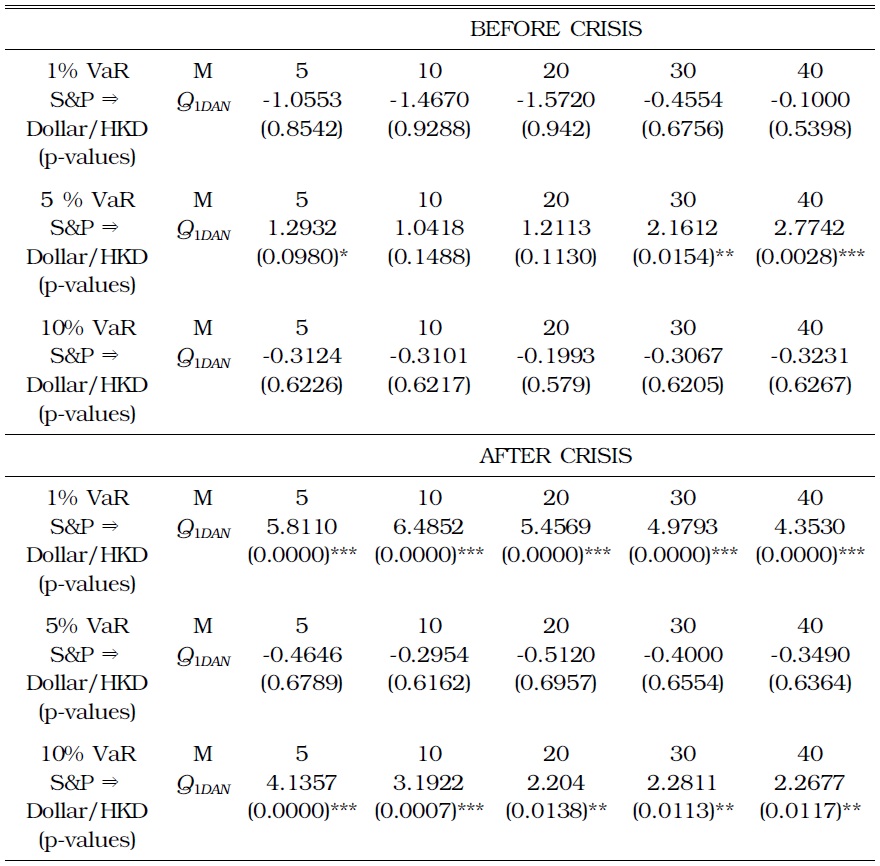
TESTING FOR RISK SPILLOVER FROM THE U.S. STOCK MARKET TO THE DOLLAR/HONG KONG DOLLAR (HKD) RATE
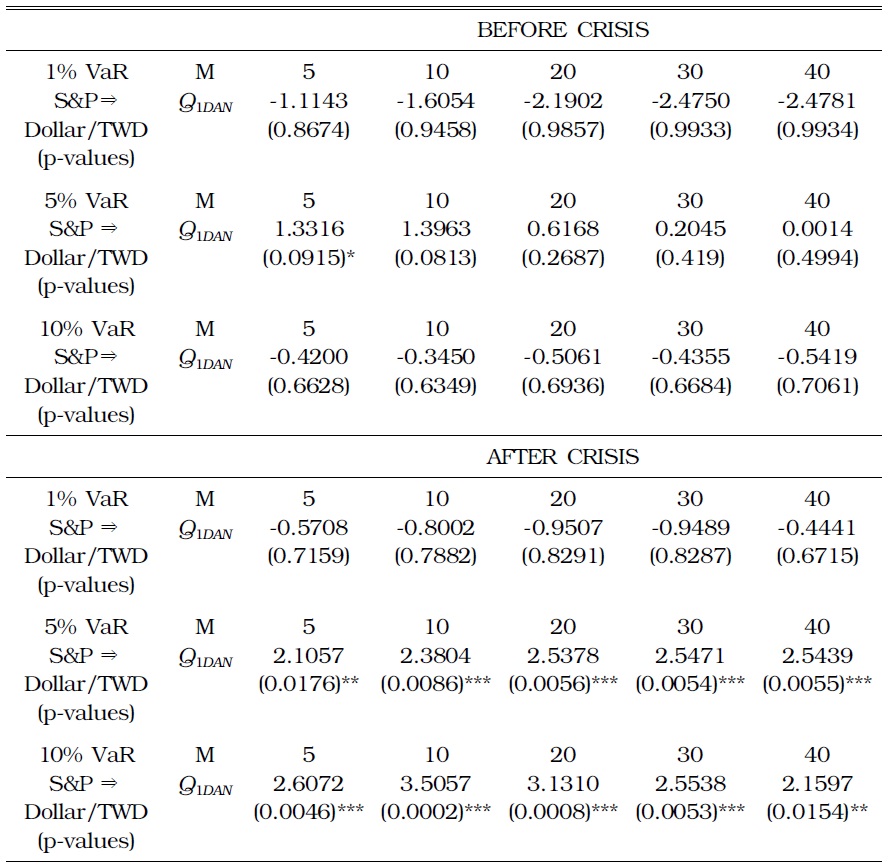
TESTING FOR RISK SPILLOVER FROM THE U.S. STOCK MARKET TO THE DOLLAR/TAIWAN DOLLAR (TWD) RATE
Overall, downside risks in the US stock market had little influence on the depreciation risk in currencies of Asian economies before the crisis. However, downside risks in the US stock market significantly Granger-caused the depreciation risk in Asian currency markets during the crisis. Furthermore, for both Japan and Korea, downside risks in domestic stock markets significantly Granger-caused the depreciation risk of the respective currencies during the crisis. During the period of financial crisis, large downside movements in values of riskier assets (stocks) can affect the demand for safer assets, such as the U.S. dollar and the U.S. T-bill.
>
E. Extreme Risk Spillover: From Stock Market to Commodity Market
During financial crises, investors prefer safer assets, as results from the previous subsection imply. We also examined the effects of extreme movements in the US stock market on the future of international gold prices. We consider both the “downside” and “upside” extreme movements of daily gold futures prices.2
1. S&P 500 and gold futures prices (Downside)
A downside movement in the stock market may cause downside movement in gold price through the wealth effect. The wealth effect seems to exist before the crisis. However, the result is different after crisis. Table 21 shows the results of testing for Granger causality in VaRs between the U.S. stock market and the gold futures market (downside movement). Before the crisis, downside movements in the U.S. stock market Granger-caused the downside movements of international gold futures prices, especially at 5% and 10% VaRs. By contrast, however, this evidence does not exist during the crisis at all VaR levels.
[TABLE 21] TESTING FOR RISK SPILLOVER FROM THE U.S. STOCK MARKET TO GOLD PRICE (DOWNSIDE RISK)
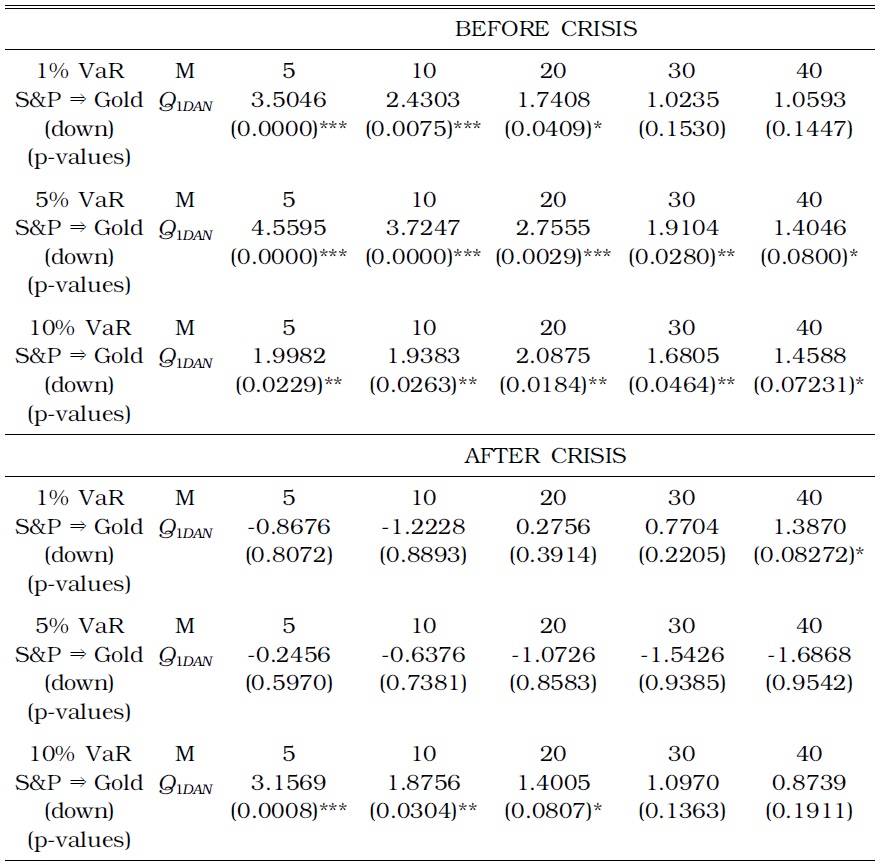
TESTING FOR RISK SPILLOVER FROM THE U.S. STOCK MARKET TO GOLD PRICE (DOWNSIDE RISK)
2. S&P 500 and gold futures prices (Upside)
Table 22 shows the results for testing for the causality of a downside movement in the U.S. stock market to extreme upside movements in gold futures prices. It does not show any clear evidence that an extreme downside movement in the S&P 500 Granger-caused extreme upside movements of gold futures prices before the crisis period on all VaR levels. During the crisis, however, strong evidence of Granger causality in VaRs from the U.S. stock market to the gold futures market exists. This result implies that extreme movements in the value of riskier assets (stocks) during the current crisis caused a significantly higher demand for safer assets such as gold.
[TABLE 22] TESTING FOR RISK SPILLOVER FROM THE U.S. STOCK MARKET TO GOLD PRICE (UPSIDE)
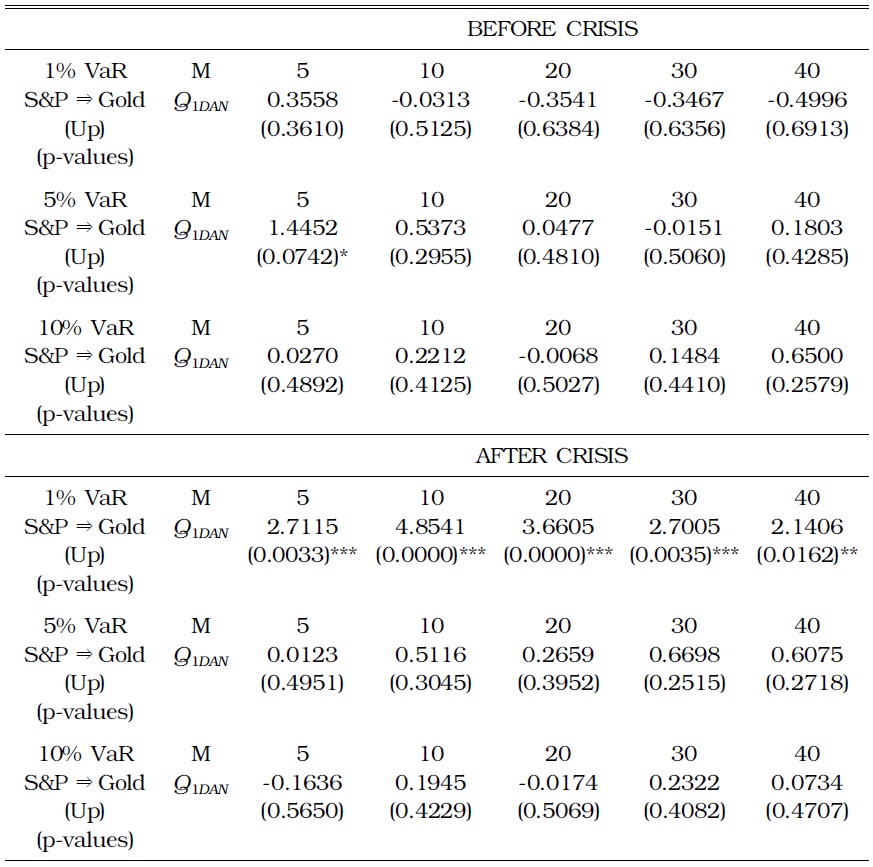
TESTING FOR RISK SPILLOVER FROM THE U.S. STOCK MARKET TO GOLD PRICE (UPSIDE)
1AAA CDOs were first downgraded in July 2007 (Cheung et al. 2010). 2The extreme downside risk of gold future price is defined as extreme negative values below the α% negative quantile value, as defined in Equations (2) and (3). The upside risk is defined by extreme positive values above the α% positive quantile value.
We examined the extreme risk spillover effect in international financial markets during the recent global financial crisis. We have, in various cases, obtained statistically significant results that an extreme downside movement in a market causes extreme movements in other markets during the crisis period, which is not evident before the crisis. Such spillover effects are found in various links: from the U.S. stock market to Asian stock markets, from the stock market to the currency market of each economy under study, and from the stock market to the gold futures market.
Markets become more closely related for transmitting risks during some abnormal situations. Investors try to avoid or reduce risks in their investment decisions by reducing the amount of risky assets or by replacing risky assets with safer assets in their portfolios.