It can be said that the term ‘local decentralization’ has regularly appeared since the period in office of the Roh Muh-Hyun administration (2003–2008). Although the Lee Myung-Bak (2008–2013) and the current President Park Geun-Hye administrations (2013–2018) have shown different degrees of interest in local decentralization, the subject is still receiving policy interest. During the Roh Muh-Hyun administration, the Presidential Committee on Government Innovation and Decentralization was established, and road maps for local decentralization were designed and implemented (Keum, 2013).
Meanwhile, the current Park Geun-Hye administration has also selected local decentralization as one of 140 government projects. As will be seen from the following, local decentralization has huge importance as one of the major axes of the current government’s plans. The Presidential Committee on Local Autonomy Development was founded in May 2013 to establish and control the local government projects of the Park Geun-Hye administration. This committee performs the task of gathering policies on local decentralization and the reform of the local administrative system for deliberation and voting upon, and inspecting and evaluating promotion processes.
In addition to policy interest shown by the Government, there have been many studies conducted on local decentralization, usually by international organizations such as the OECD and the IMF. Even in academic circles in Korea local decentralization is attracting interest as a subject of research. However, a phenomenon that can be seen both in government policies and academic research projects is that although the importance of local decentralization is emphasized, more practical research is lacking on local decentralization levels in Korea vis-à-vis those in other countries, the results that might be expected from implementing local decentralization, and the appropriate level of local decentralization that should be implemented by policy. Although it is dutifully argued that local decentralization is required, there is no consensus about the appropriate level of local decentralization. This is because there is no clear understanding about the current level of decentralization. Another prevailing interest is whether local decentralization can cause dependent variables on national factors such as national competitiveness, or personal aspects such as the well-being of individual citizens, to directly improve. These topics are of great importance, positive research on them in Korea is believed to be lacking. That is, not only are local decentralization levels poorly measured, but also, the relationship between related variables that affect local decentralization is improperly defined. In addition, there is even less discussion about the ideal level of decentralization.
Studies by the OECD (2013: 9) point out that if decentralization is not correlated with the strengthening of economic growth, the efficiency of the public sector or the happiness of civilians, it is meaningless to discuss it. That is, decentralization should not be seen as a final goal, but rather as a means of ultimately fulfilling objectives such as a strong national economy or the happiness of the people. In a situation where there is no objective measurement of decentralization levels and no target set for future decentralization levels, the need for local decentralization can be discussed only in an abstract way. In a context which sees local decentralization not as an objective value but as a methodical tool for accomplishing different objects at the national level, practical research, such as on the question of whether local decentralization can lead to national competitiveness or the improvement of national happiness, should also be specifically carried out. In particular, if local decentralization as a policy direction cannot attain goals such as national competitiveness or the happiness of the people, bringing it about can end up as a task that exists only for administrative agencies and an issue irrelevant to the lives and the happiness of people. Beginning with a recognition of the problem, this research aims to evaluate decentralization in Korea from a relative viewpoint, and analyzes how important national policy variables such as income inequality, regulation levels, corruption levels, social capital, and the transparency of national policies, affect local decentralization levels.
Decision makers and experts in developing countries and advanced countries at the present time are showing an increasing interest in decentralization as a strategy for satisfying the policy demand of salient governments. They assume that the improvements in governance, enhancements in transparency and responsibility, increased efficiency in the production of public goods and service and the improvement of delivery systems can be brought about through decentralization. In particular, European political economists adopting this perspective conducted analyses by applying numerous methodologies to the question of how decentralization, and influential variables such as social capital, regulation levels, policy ideology and national competitiveness, can mutually affect each other (Baskaran, 2011: 485–6). Decentralization is defined differently by different scholars, but in general it means the authority distribution relationship between central and local government, and signifies the degree of authority transfer from the central government to local authorities (Hong et al., 2006: 239; Keum, 2013; Choi, 2013: 369). Therefore, in general decentralization and local decentralization are used synonymously. By using the term ‘decentralization’, the role and importance of local government is emphasized, and through this process the domain of local government can be expanded (Ahmad, 2008: 3). That is, local decentralization means the process of the authority of central government being transferred to local authorities, local decentralization being the result of such transfers. In this study, the two definitions will be used in a reciprocal way according to the context. In terms of organized definitions, decentralization and local decentralization also divide into political decentralization, fiscal decentralization, and regulatory decentralization, while some scholars add another category, administrative decentralization (Schneider, 2003: 33–4). However, defining decentralization is very difficult and opinions on this confusing matter are divided (Schneider, 2003). Also, it is very difficult to grant more or less value between organized definitions of decentralization. As a result of these difficulties, it is necessary to examine previous research to establish the key definitions of decentralization and the indicators that can measure it.
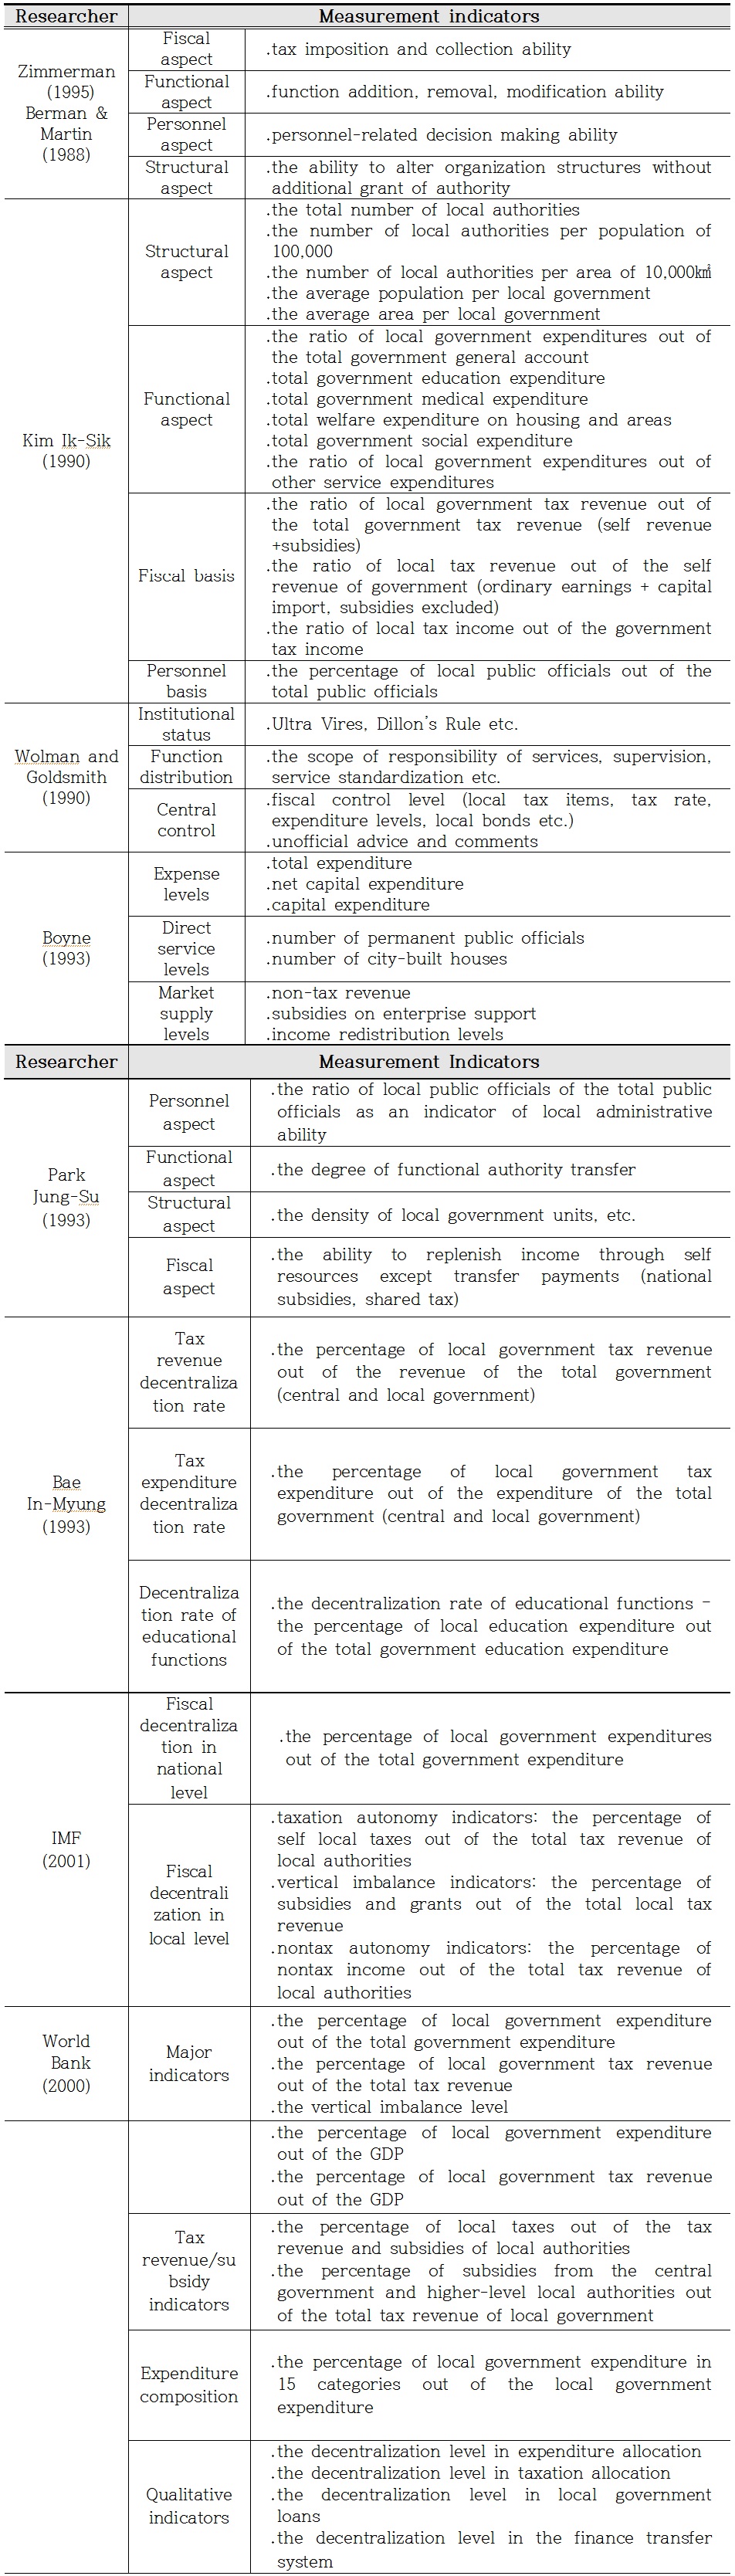
Studies of decentralization are conducted both domestically and internationally, and these can each be divided into two major categories. The first is a research category that emphasizes the various aspects of decentralization and integrates them. The studies of Zimmerman (1995), Berman and Martin (1988), Kim Ik-Sik (1990), Park Jung-Soo (1993), Hong Jun-Hyun et al. (2006) belong in this category. These researchers classify decentralization according to its fiscal, functional, personnel-related and structural aspects, and present specific indicators for each classification – for example, tax imposition and collection abilities for fiscal aspects, degree of functional authority transfer for functional aspects, decision-making ability in personnel affairs for personnel aspects, and density of local government or the ability autonomously to alter the organizational structure for structural aspects. The second category is a research category which utilizes subspecialized fiscal indicators by focusing on the financial aspects. Studies by the IMF (2001), the World Bank (2000) and Bae In-Myung (1993) are included in this category. These studies stress that the key to decentralization is fiscal decentralization, and they have a tendency to utilize indicators such as the decentralization rate of revenue and expenditure, or the ratio of local government expenditure to total government expenditure, the ratio of self local taxes to total local government revenue, and the ratio of subsidies and grants to total local revenue. Local-decentralization-related indicators as presented in preceding research can be organized as shown in Table 1.
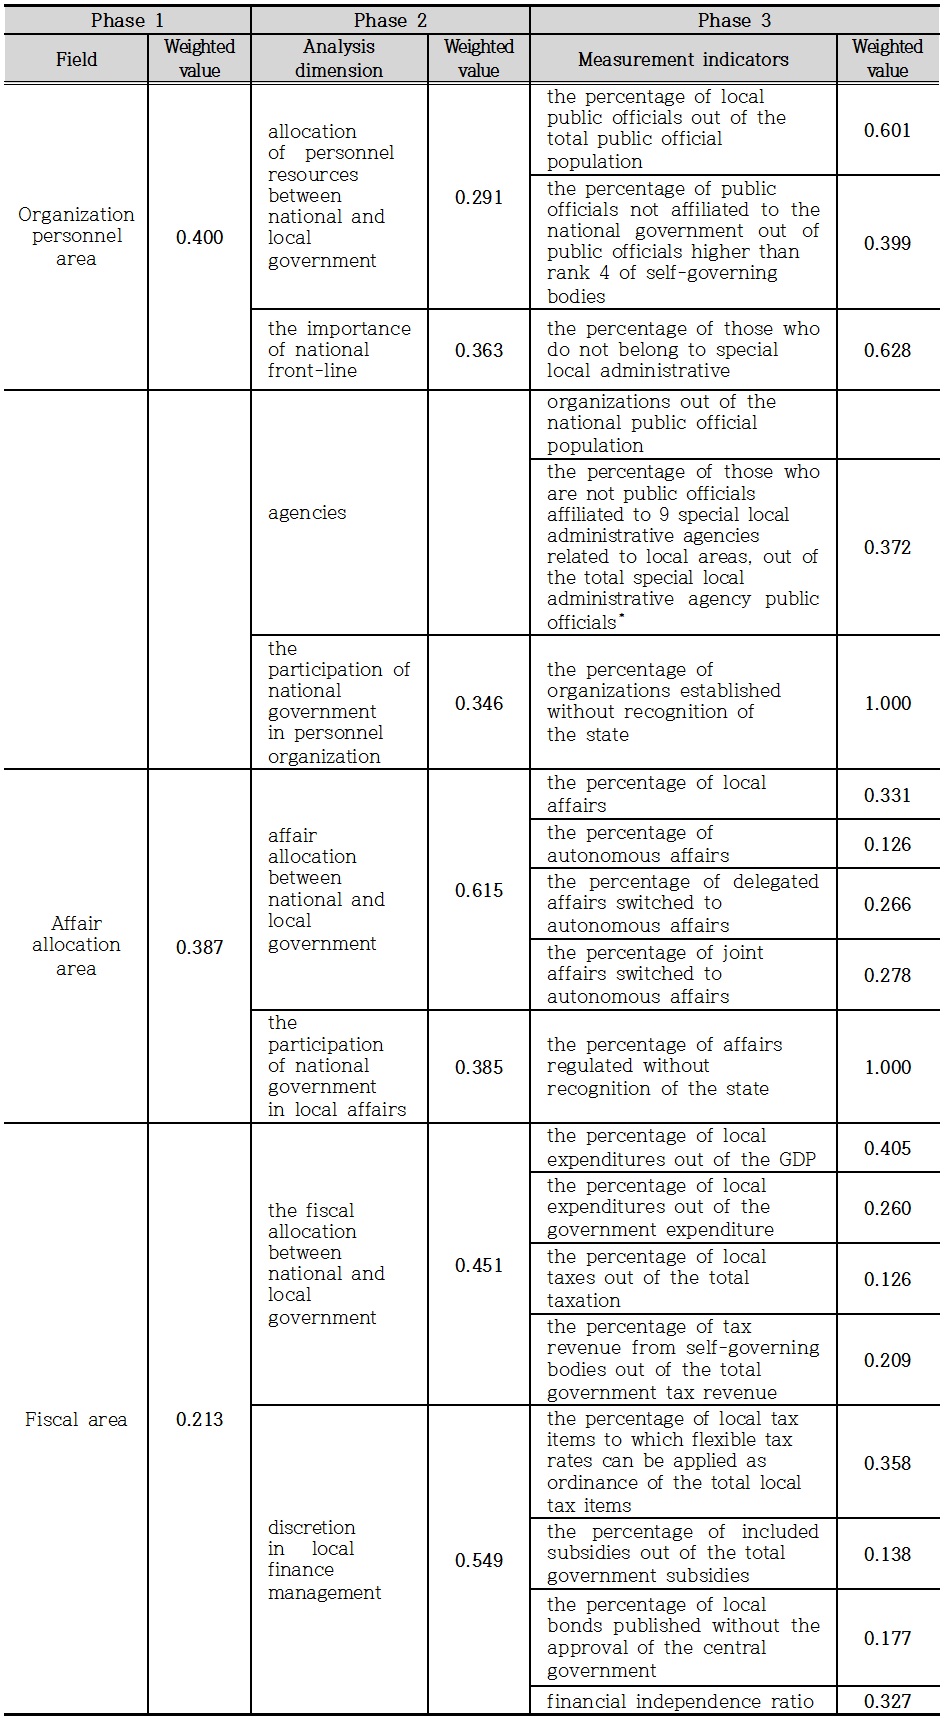
By compiling these indicators and considering various conditions in Korea, Hong Jun-Hyun et al (2004, 2006) have presented decentralization indicators and measurement methods as set out in Table 2. Their method is to divide areas for local decentralization measurement, set specific measurement indicators for each field, compute weighted values for areas and indicators according to the AHP method, and measure the level of decentralization using the actual and the weighted values.
] Weighted values per analysis areas and measurement indicators
Weighted values per analysis areas and measurement indicators
However, it is almost impossible to use all these indicators to make comparisons between Korea and other countries, because there is no possibility of obtaining comparative data for other countries. Because of such problems, although these indicators can be used to analyze the rate of change in Korea’s decentralization by measuring them per year, new indicators have to be applied to make comparisons with other countries.
From these indicators data on fiscal decentralization levels is relatively easy to acquire and measure. In addition, it can be assumed not only that fiscal decentralization has a high mutual correlation with political and administrative decentralization, but also that local decentralization cannot have practical significance if a local authority is not guaranteed discretion on fiscal resources (Schneider, 2003). For such fiscal decentralization, indicators such as proportion of GDP of revenue from local authorities, or proportion of total revenue of internal revenues from local authorities, have frequently been used (Kim et al., 2013). However, recently, studies centering on the OECD that compare fiscal decentralization levels by utilizing the discretion that local authorities have concerning tax rights have gained great significance (Kim et al., 2013). Kim et al’s study places the discretion levels of local authorities regarding tax rates in ten categories. This is thought to have an important value in complementing non-quantitative indicators that have qualitative characteristics. Therefore, in this study the qualitative indicators of autonomy in taxation presented by the OECD in 2013 will be utilized in a complementary way, and will be applied to measuring fiscal decentralization levels. That is, fiscal decentralization will be regarded as made up of (1) taxation decentralization and (2) expenditure decentralization, and tax autonomy level values will be reflected by measuring these levels in these two aspects. The fiscal decentralization database provided by the OECD will be used to set taxation decentralization as the ratio of total revenue of local tax income, and expenditure decentralization as the ratio of total national expenditure of local tax expenditure. These two variables will be used to measure decentralization levels. However, in this process, tax autonomy, which can be defined as discretion in taxation rights, will be utilized in a complementary manner, as discussed below.
In order to examine decentralization-relevant topics, it is necessary to examine most of the variables that are affected when decentralization occurs, and what kind of relationship exists between them. In other words, this is a discussion of the variables that influence decentralization. This may be called an influence model of decentralization, and it is the formation of such models that makes it possible to identify whether specific variables are influenced by each other and the degree of that influence, and also to identify how the influenced variables will change according to regular changes in value.
In this connection, Schneider (2003) states that decentralization will have positive or negative effects on economic growth, political stability and income inequality. In particular, many scholars argue that decentralization will cause competition between local authorities which will lead to improvements in the management of local resources, thus bringing growth to the local economy (Davoodi & Zou, 1998; Zhang & Zou, 1998). Meanwhile, others argue that decentralization is more than just strengthening resident participation and improving residential responsibility, and will lead also to strengthening national competitiveness. Discussion of the duty to bring about decentralization must incorporate the fact that when it is not limited to a dependent variable but also performs the role of an independent variable, its positive functions as a dependent variable can be improved.
There are not many studies that have discussed clearly the relationship between national competitiveness and decentralization. However, there are related studies, which can be divided into two categories (Choi, 2008). The first holds that local decentralization enhances government transparency, strengthens social capital, reduces regulation, and promotes economic development and growth (Xie et al., 1999; Oates, 1993). These arguments do not mention the term ‘national competitiveness’, and relate economic growth to governmental transparency and regulation, but given that these are included in the lower section of national competitiveness it may be said that there is a relation. These arguments maintain that through decentralization, local authorities will utilize their increased authority to alleviate regulation and in this way devise various methods for the revitalization of the economy, such as enterprise attraction, and consequently, strengthened local competitiveness will lead to strengthened national competitiveness.
In comparison, the second category of studies state that local decentralization will in fact weaken national competitiveness. According to this argument, decentralization will hamper economies of scale during the resource allocation process, and cause external effects and ‘nimby’ syndromes, and thus may diminish overall efficiency. It can be seen as being in line with the opinion that decentralization will have a negative effect on national competitiveness by triggering local imbalance and income imbalance. This argument states that decentralization will, especially in fiscal areas, cause unclear distributions in expenditure and tax revenue functions between central and local government, and may lead to an inefficient distribution of resources (Fukasaku and de Mello, 1998). Shleife (2000) also points out that fiscal decentralization in developing or underdeveloped countries can mislead to a political monopoly by groups of vested rights in the region. Thus, there are conflicting opinions on decentralization concerning whether it impedes or promotes economic growth and efficiency.
Nevertheless, major advanced countries have recently been moving towards decentralization and are utilizing it as a means of improve national efficiency and competitiveness. In addition, decentralization is also held to have a positive effect on ultimate life-goals such as increased happiness. Bjornskov et al. (2008) argue that many studies of the effects of decentralization implicitly assume that it increases welfare or happiness levels, only it is not yet known to what extent it may influence happiness. They assume that when decentralization occurs, politicians compete, various regulations and bureaucratic waste are reduced, reductions in regulation are promoted, and policy decisions become clearer as a result of much clearer information. Overall, local authorities respond more to the demands of residents and provide public services more efficiently than central government. Given these premises, Bjornskov et al. (2008) present a number of hypotheses, the most representative being that decentralization leads to greater happiness (Biornskov et al., 2008: 147). One notable point here is the premise that during the process of decentralization improving happiness, individuals perform ethical actions relating to the consequences that they all the time face, the degree of which can change depending on the amount of community spirit they show. This can be understood in terms of ‘social capital’, and it may be assumed that decentralization causes an increase in social capital, which then leads to an increase in happiness. Although institutional authorities are important as regards local autonomy, social capital, which may be seen as the communal competency of local residents, is also of importance. No matter how much authority is transferred institutionally, if local residents have low levels of social capital, that is, if they have no will to resolve problems and act ethically by themselves, this cannot lead to improvements in national competitiveness or happiness. In addition, social responsibility on the part of entrepreneurs is also important. The national competitiveness report by the IMD implies that corruption levels within a society are influenced by this, and that levels of entrepreneurial corruption also influence national competitiveness and happiness.
One study that has great significance regarding the relationship between variables relating to decentralization is that conducted by Fan et al. (2009), which describes the relation between decentralization and corruption. The authors state that if decentralization is brought about, many sectors of government expenditure will be managed by local government, and this is related to a decline in levels of corruption.
In summary, then, out of the variables relating to local decentralization, some are influenced by it while others influence it. In addition, some are discovered to have positive relationships while others have negative relationships. While national competitiveness and happiness may be assumed to be the ultimate dependent variables and decentralization is an independent variable, many other variables can influence these variables, and opinions about this are divided. In this study a hypothetical study model will be set which aims to reflect important policy variables such as decentralization, national competitiveness and national happiness as much as possible. This analysis using the hypothetical model is expected to provide results significant for policy.
The contextual range of this research embraces, first, a measurement of the decentralization levels of 34 OECD member nations; second, an investigation of the relation between decentralization levels and major policy variables; and third, an investigation of the relation between variables related to decentralization. Via these processes, the research aims to set out suitable directions for future decentralization policies in Korea. In the case of some OECD indicator data, data on other countries was not included, so 26 countries for which data were included were set as analysis targets. The time range was set at six years, from 2008 to 2013. Data on some individual indicators were omitted for certain periods, and in this case adjacent data were used.
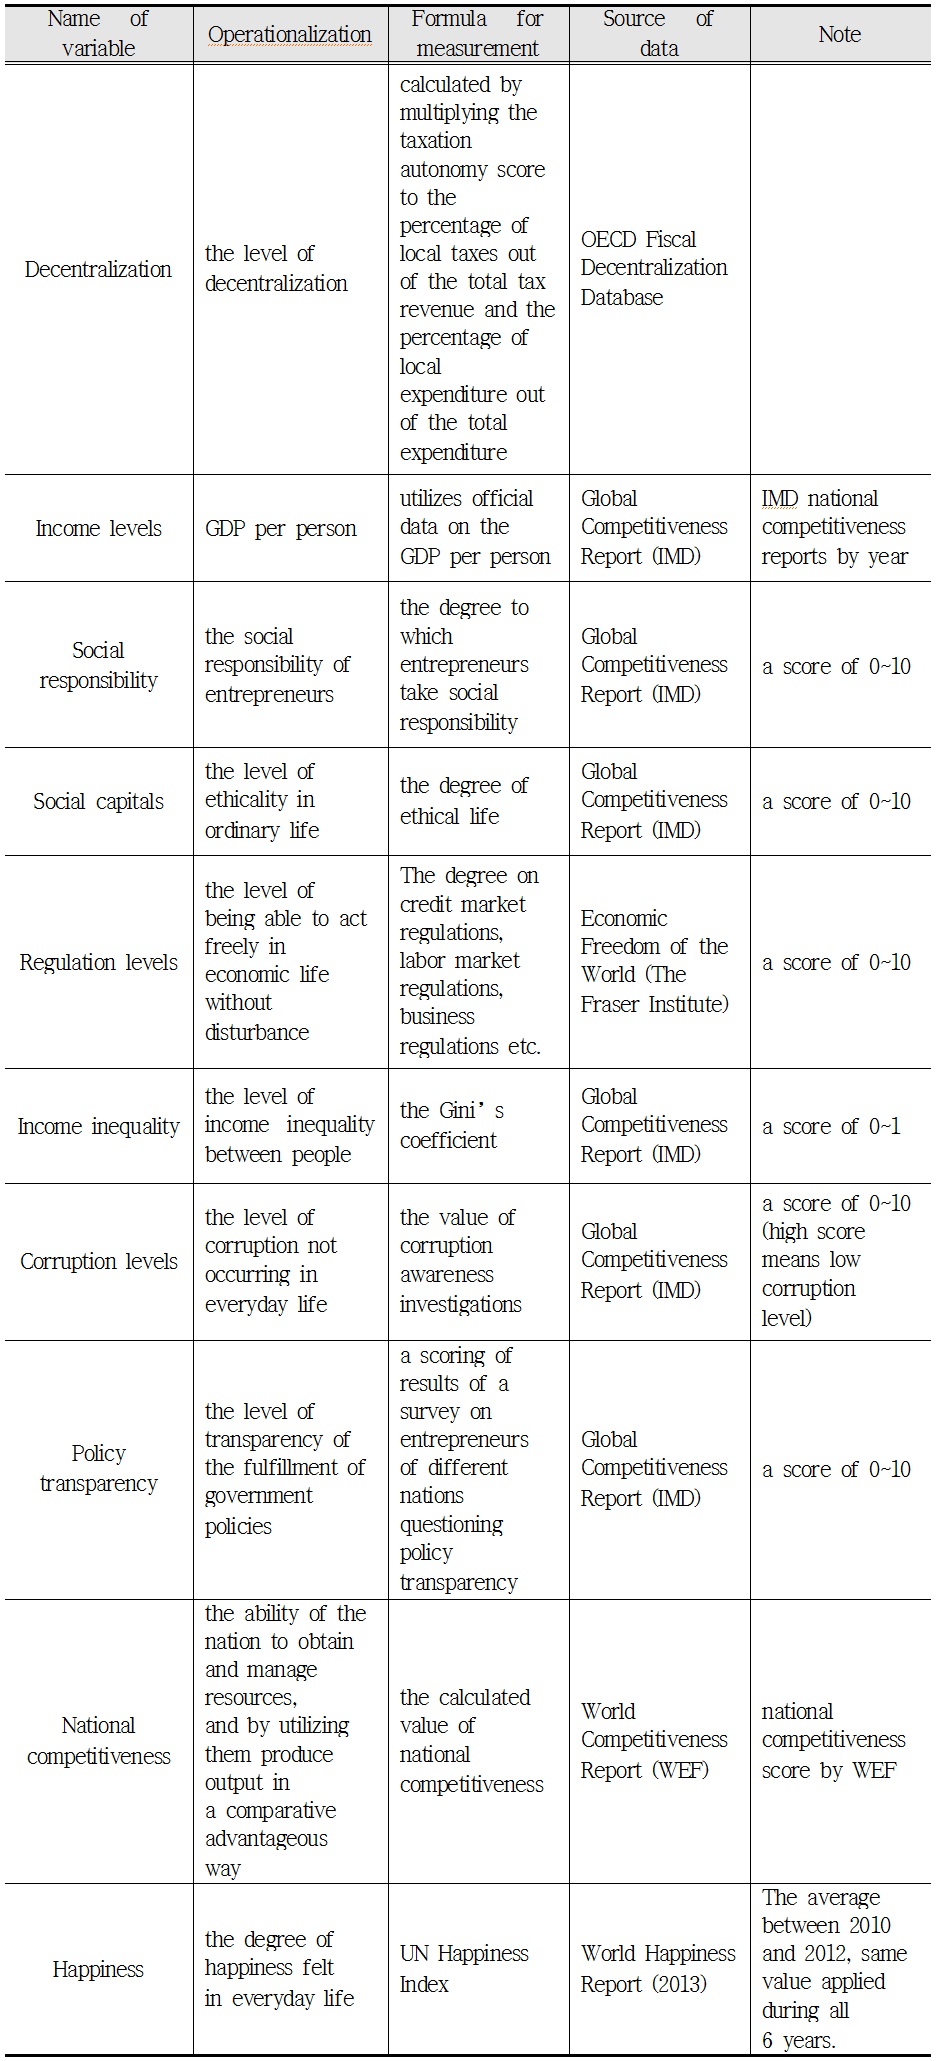
Because the main targets of this research were decentralization, national competitiveness and national happiness, major national policy variables that were assumed to influence decentralization were used as parameters. GDP per person, restriction levels, social capital, social responsibility, policy transparency, corruption levels, income inequality, national competitiveness and happiness were selected as major variables that influence decentralization. Many sources of data were used to measure these variables, and any missing data were replaced with the most recent versions. Degree of happiness was measured by utilizing the World Happiness Report 2013 published by the UN, and national competitiveness was measured using the annual national competitiveness score published by the World Economic Forum.
Although decentralization in theory usually includes administrative, political and fiscal decentralization, in this research it was limited to fiscal decentralization. First, it is difficult to obtain data on administrative and political decentralization for different countries, and second, since fiscal decentralization has a high correlation with administrative and political decentralization, it was thought that it would be sufficient to utilize only fiscal decentralization. The indicators used to measure fiscal decentralization levels were of the proportion of total revenue of local taxes, and the proportion of total expenditure of local expenditure. However, in order to complement these quantitative indicators, the taxation autonomy indicators from the OECD were used, and by utilizing the data of each country presented in the OECD database the taxation autonomy index was calculated. However, while the OECD taxation autonomy indicators are applied to the taxation section, in this research it will be assumed that these indicators function in a similar way towards expenditure as well, and so they will be applied in that section equally. That is, since there can be restrictions on the expenditure of local authorities even if local expenditure level is high, restriction levels on expenditure were assumed to be similar to that on taxation.
Instead of the generally used fiscal decentralization indicators, the OECD has recently presented the level of discretionary power that local authorities can practically exercise in fiscal areas. In this connection, it classifies the discretion levels of local authorities regarding taxation according to nine grades, as follows:
The discretion of local authorities is strongest in the first category and increasingly less strong in the following categories. Therefore, in this research, by using values relating to local government authority in each individual country, counterweighted values will be set. Counterweighted values here are obtained by first assuming the nine categories as an interval scale, multiplying ① by 9 (discretionary power on tax rates and reduction), multiplying 8, 7, 6 by the lower categories in serial order, and finally multiplying ⑨ by 1. The sum of all individual countries will be considered as representing taxation autonomy. That is, the larger this value, the more discretion local authorities have on taxation. The value of the taxation autonomy indicators calculated here will be multiplied by the proportion of local taxes and will be used as the taxation decentralization level, and in the same context it will be applied to local expenditure costs as well in order to derive the expenditure decentralization level. The contents of the major variables to be used in this research are shown in Table 3.
As mentioned earlier, to measure decentralization levels a method of calculating the two indicators taxation decentralization and expenditure decentralization is selected. First, the two indicator values were obtained from the OECD database, then each indicator value was obtained using the weighted value of the taxation autonomy indicators. Then, the average of these two values was set as the value for fiscal decentralization level.
2) Measurement of the degree of influence between policy variables related to decentralization
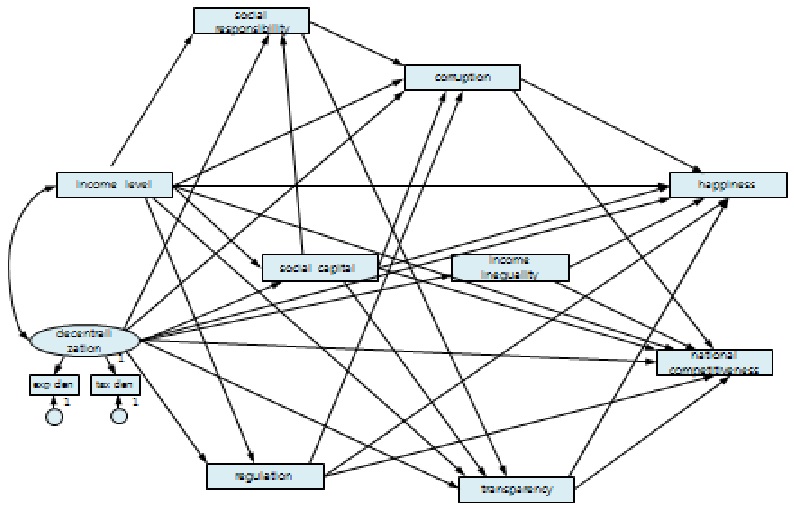
A hypothetical research model for measuring this is presented below.
The steps for analyzing a hypothetical model are as follows. First, technical statistics regarding GDP per person, decentralization (taxation decentralization, expenditure decentralization), social responsibility, social capital, regulation levels, corruption levels, Gini coefficient, policy transparency, happiness and national competitiveness, and Pearson coefficients were obtained using SPSS 18.0. Second, a Structure Equation Modeling Analysis was conducted using AMOS 20.0. As a coefficient presumption method in the structure equation model, the Maximum Likelihood Method was used. The model’s evaluation methods include one using X2verification and another using the goodness-of-fit index. However, X2verification is sensitive to sample size and the null hypothesis is very strict, so the model was not evaluated solely on the X2verification. In this research, the simplicity of the model was considered and the goodness-of-fit of the model was evaluated through GFI, NFI, IFI, CFI, which had the standards of goodness-of-fit evaluation indexes established, and the appropriate standard is seen as .9 (Moon, 2009). Third, in case a hypothetical model should not be appropriate to the data, modifications to the model were made by confirming the modification index and adding routes with a correction index higher than 4. In this way, the best-fit model could be found while preserving the basic simplicity of the model. Also, an examination was carried out of the statistical significance of the routes between variables and its explanatory power (direct effect, indirect effect, total effect). Fourth, by using the bootstrap method, the kind of indirect effects that social responsibility, social capital, regulation levels, corruption levels, Gini coefficient, and policy transparency can have on the routes that start from GDP per person and decentralization level and lead to happiness and national competitiveness can be measured by focusing on the significance of indirect effects. The bootstrap method creates an experiential distribution of parameters when the parameter distribution is unknown, and is a useful means of obtaining values such as the approximate standard error, confidence interval, and significance probability, by estimating the sample distribution of all parameter estimation values included in the structure model (Kim, 2007).
3) Policy simulation
A policy simulation based on the system dynamics method was conducted on the results produced from the hypothetical model. This policy simulation is based on the system dynamics methodology, and estimates how dependent variables change by altering decentralization levels. The simulation method is aimed at understanding and explaining complicated situations from a dynamic feedback perspective. In addition, it is the methodology and framework used for establishing a computer model that is based on understanding and testing how situations formed of complicated causal relationships can dynamically change (Jung et al., 2005: 220). The parameter of individual variables is estimated through the optimization method, and to achieve this the POWERSIM simulation program is utilized. Via this policy simulation method, changes to national competitiveness and national happiness following changed values in decentralization can be estimated.
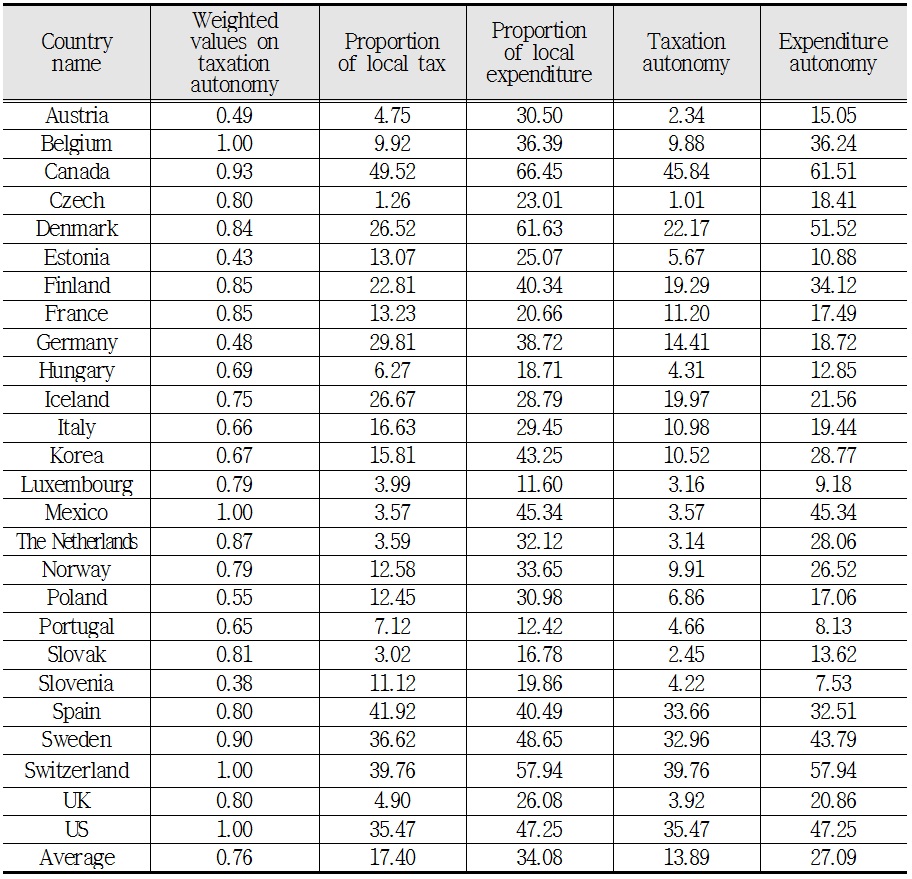
The values for taxation decentralization and expenditure decentralization levels were used to measure decentralization levels, and, as mentioned above, the value of taxation autonomy index was applied to calculate such values. First, the weighted values of discretion on taxation by central and local government as calculated by the OECD was used. For the ten categories, counterweighted values per categorical percentages are given, then the values are added. Assuming that these ten categories are interval scales, the category that shows the highest local government discretion is multiplied by 10, the second-highest category is multiplied by 9, and so on. The value calculated by this process will be named the ‘weighted value on taxation autonomy’. The results of recalculating distribution levels by applying them to the ratio of local taxation and expenditure levels of OECD nations in 2012 are seen below.
Table 4 shows that the taxation autonomy weighted values for 26 OECD nations are on average 0.76, while Korea’s is slightly lower than that, at 0.67. Meanwhile the table shows the ratio in 2012 of local taxes to total taxation. As Table 4 shows, the average for 26 nations in 2012 was 17.40, while that for Korea was 15.81, slightly below the average value.
] Weighted value on taxation autonomy, the ratio of local taxation and expenditure levels
Weighted value on taxation autonomy, the ratio of local taxation and expenditure levels
Meanwhile, since it is necessary also to examine local expenditure, the ratio of local expenditure in 2012 can be simplified, as seen in the table. While the average for the 26 countries is 34.08 percent, the ratio for Korea is 43.25 percent, higher than the average. The results of multiplying the taxation autonomy weighted values by these ratios and considering certain constraint factors are shown in Table 4.
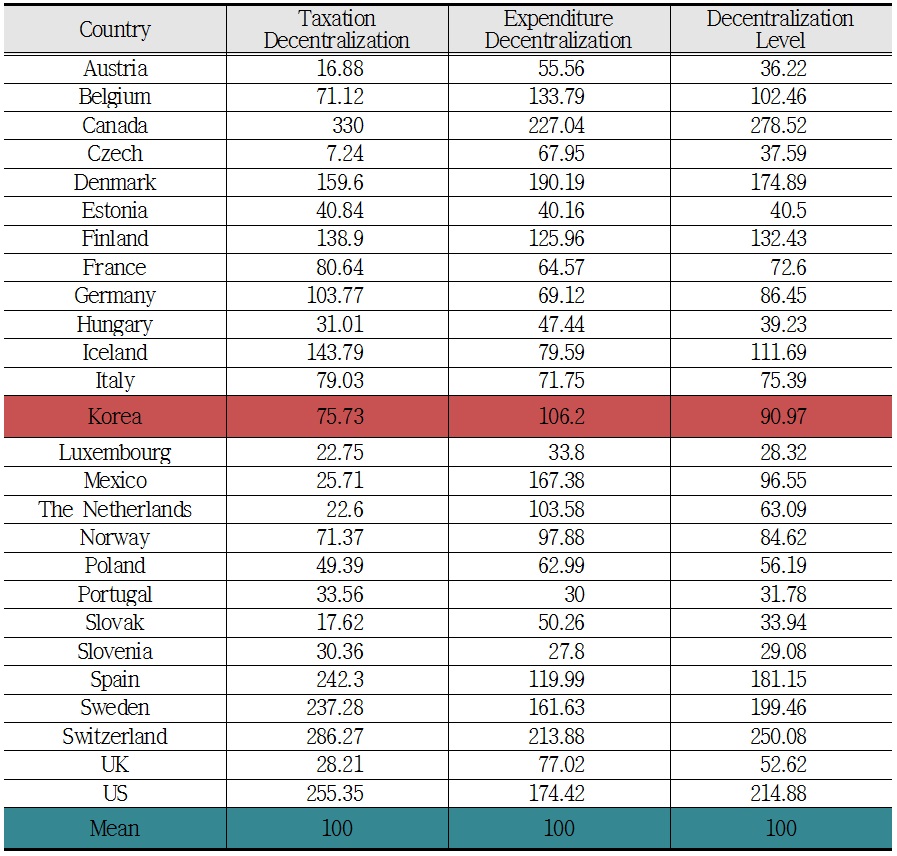
Since the taxation autonomy values and expenditure autonomy values are ranged differently, the average of each indicator is calculated to derive its relation to the average. Then, these two values are added and divided by 2, giving the value that will be utilized. Thus, if the OECD average is 100, the relative positions of different countries can be calculated. Levels of taxation and expenditure decentralization levels were derived using this method, and the decentralization scores calculated by adding these two values are shown in Table 5.
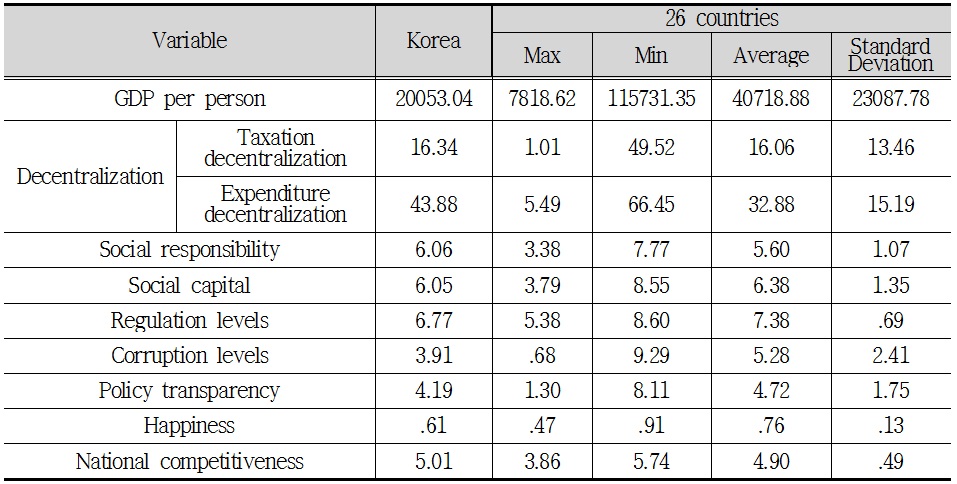
Table 6 shows the basic statistical value of the variables used in the research. The annual values from 2008 to 2013 are processed in a pooling method. However, relative decentralization values were not used for decentralization indicators, local tax and local expenditure ratios being used instead.
] Average and standard deviation of variables (2008?2013)
Average and standard deviation of variables (2008?2013)
As Table 6 shows, average GDP per person from 2008 to 2013 for the 26 countries was 40718.88, taxation decentralization 16.06, expenditure decentralization 32.88, social responsibility 5.60, social capital 6.38, regulation level 7.38, corruption level 5.28, policy transparency 4.72, happiness 4.72, and national competitiveness 4.90. A comparison between Korea’s values and those for the 26 countries from 2008 to 2013 show that all Korean variables were lower than average, with the exception of expenditure decentralization, social responsibility, and national competitiveness.
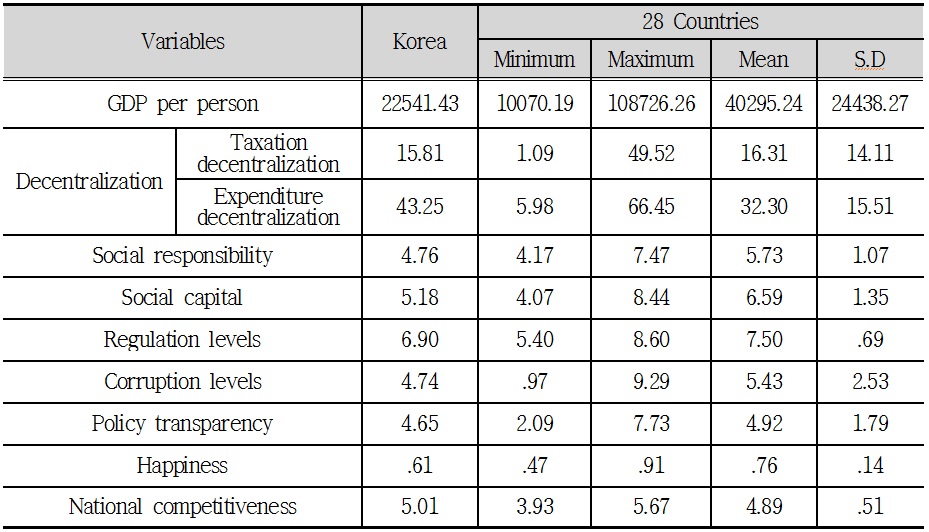
As regards the most recent data (2013), the average values for the 26 countries were 40.295.24 for GDP per person, 16.31 for taxation decentralization, 32.30 for expenditure decentralization, 5.73 for social responsibility, 6.59 for social capital, 7.50 for regulation levels, 5.43 for corruption levels, 4.92 for policy transparency, 0.76 for happiness, and 4.89 for national competitiveness. Comparing Korea’s scores with the averages for 28 countries in 2013 shows that all variables were below average with the exception of expenditure decentralization, social responsibility, and national competitiveness.
] Average and standard deviation of variables (2013)
Average and standard deviation of variables (2013)
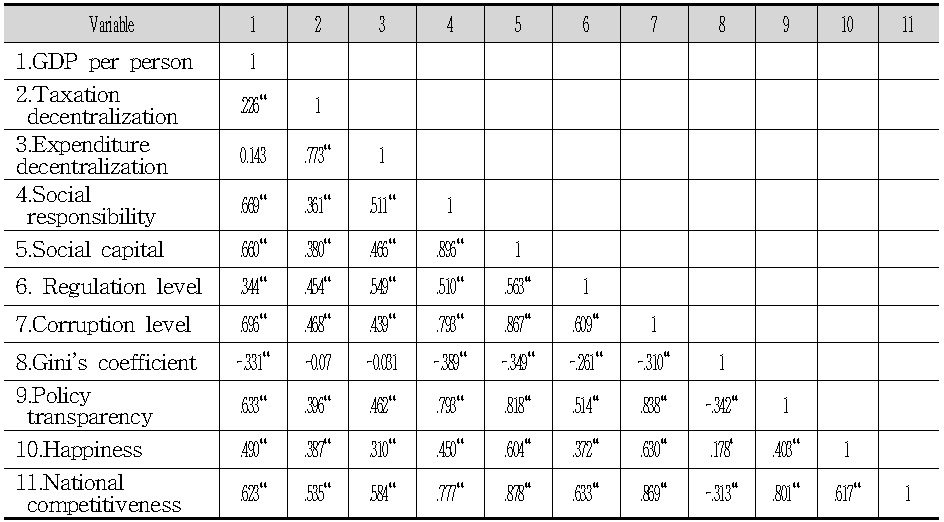
2) Correlation between variables
The results of an examination of the mutual correlation between variables are shown in Table 8. GDP per person and expenditure decentralization, taxation decentralization and Gini coefficient, and expenditure decentralization and Gini coefficient, were the only variables that did not show a correlation between the ρ<.05 and ρ<.01 levels, while all other variables did have a significant correlation.
Verification results of the model on in terms of how GDP per person and decentralization produce happiness and national competitiveness via social responsibility, social capital, regulation levels, corruption levels, Gini coefficient and policy transparency are shown in Table 9.
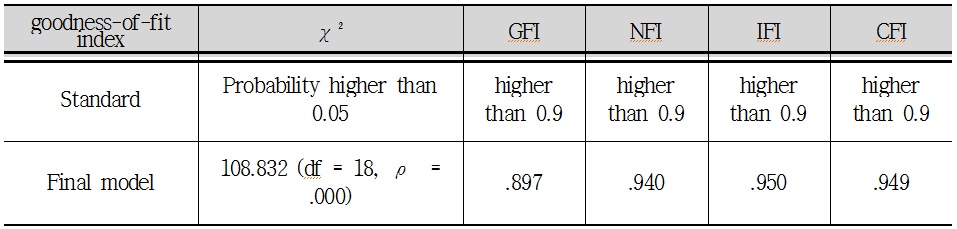
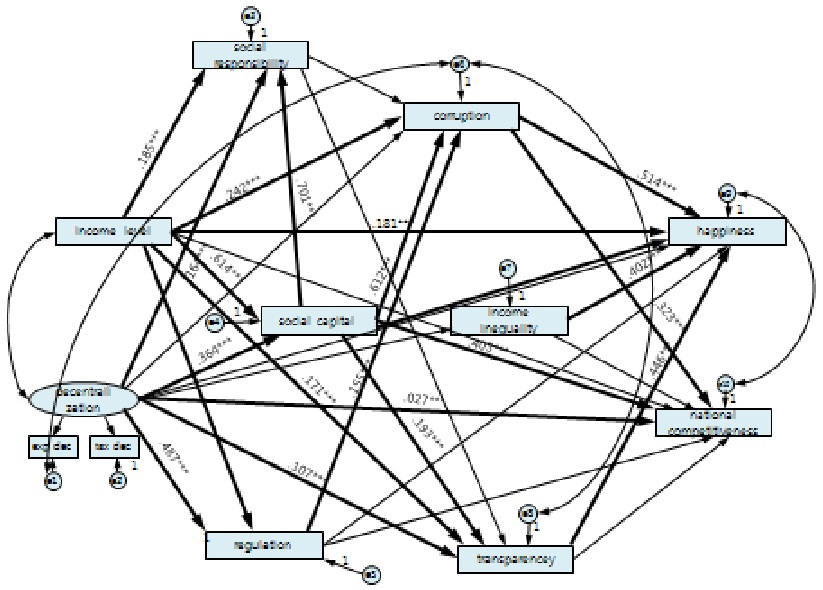
The goodness-of-fit index of the initial research model set according to the hypothesis in this research is X2 = 165.515 (df = 21, ρ = .000), GFI .854, NFI .909, IFI .920, CFI .918, and thus showed that the GFI goodness-of-fit index was inappropriate to the standards. Therefore, the error terms e1 and e6, e6 and e8, e9 and e10, which had modification indices larger than 4, were identified, and after it was understood that there was a degree of covariance (Kim, 2007) these were connected with bi-directional arrows. The specific goodness-of-fit index of the final model that underwent modifications was X2 = 108.832 df = 18, ρ = .000, GFI .897, NFI .940, IFI .950, CFI .949. The path-coefficient of the final causal model is as shown in Figure 2.
Excluding national competitiveness, GDP per person, which is seen as an exogenous variable, had a significant influence on social responsibility (β = .185, ρ = .000), social capital (β = .614, ρ = .000), regulation levels (β = .201, ρ = .000), corruption levels (β = .282, ρ = .000), policy transparency (β = .171, ρ = .005), and happiness (β = .181, ρ = .003). Decentralization had a significant influence on social responsibility (β = .164, ρ = .000), social capital (β = .364, ρ = 000), regulation levels (β = .487, ρ = .000), policy transparency (β = .107, ρ = .031), and national competitiveness (β = 1.027, ρ = .000). Social responsibility was seen to have no significant impact on any variable, social capital had a significant influence on social responsibility (β = .701, ρ = .000), corruption levels (β = .612, ρ = .000), policy transparency (β = .493, ρ = .000), happiness (β = .460, ρ = .000) and national competitiveness (β = .403, ρ = .000), and regulation levels did not show a significant influence on happiness and national competitiveness. Meanwhile, corruption levels had a direct influence on happiness (β = .514, ρ = .000), national competitiveness (β = .323, ρ = .000), and the Gini coefficient on happiness (β = .402, ρ = .000), and policy transparency also had a direct influence on happiness (β = -.446, ρ = .000).
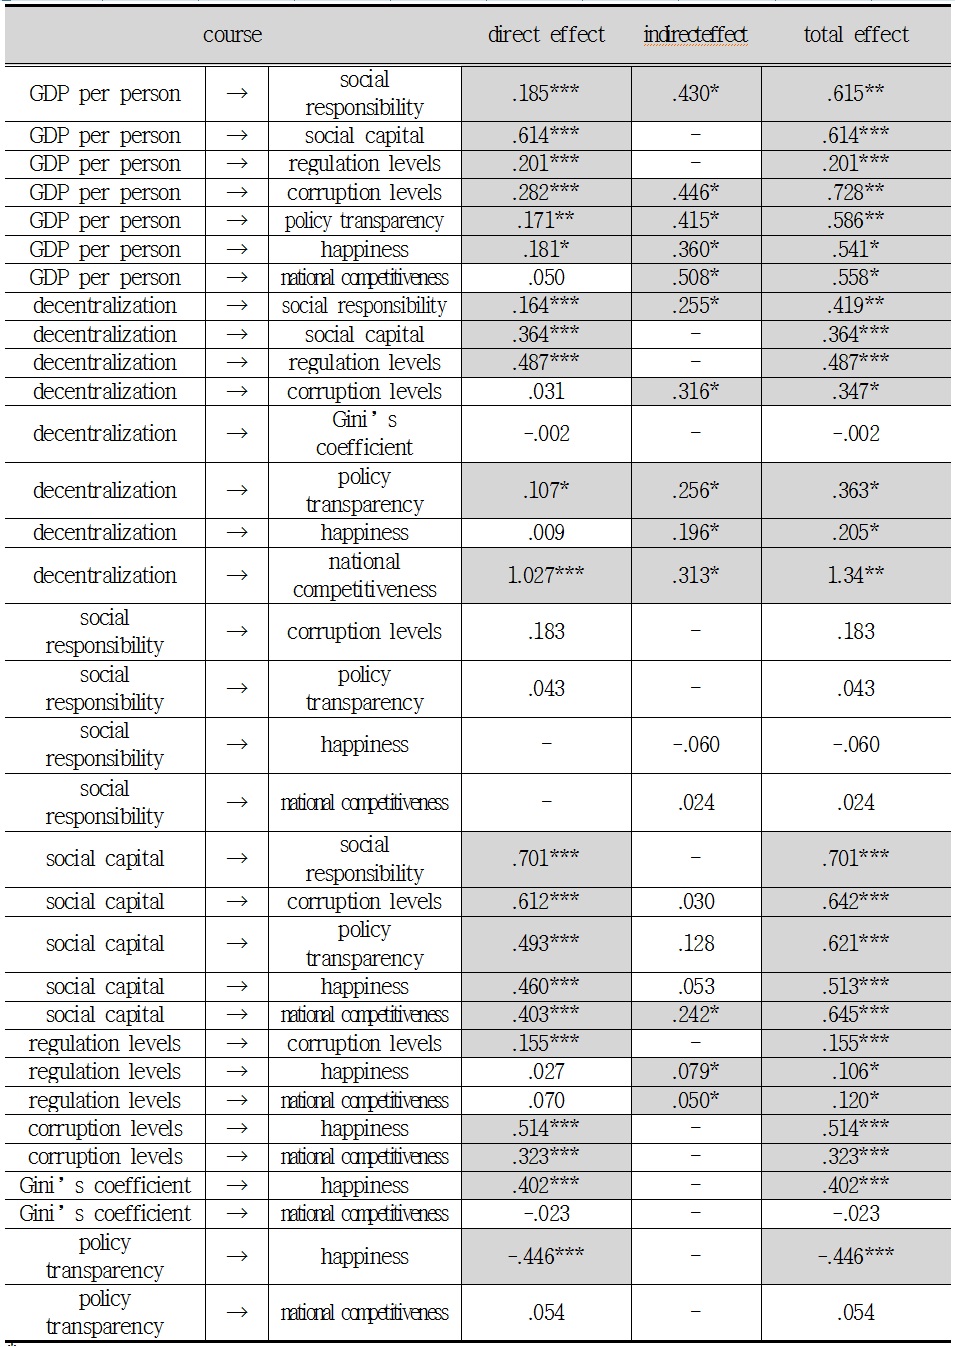
The disassembly of the total effects (direct and indirect effects) in order to examine specific courses of the model is shown in Table 10. When focused on significant total effects, the total effects of GDP per person at the ρ<.05 level were β = .615 for social responsibility, β = .614 for social capital, β = .201 for regulation levels, β = .728 for corruption levels, β = .586 for policy transparency, β = .541 for happiness, and β = .558 for national competitiveness. Also, the total effects of decentralization were β = .419 on social responsibility, β = .364 on social capital, β = .487 on regulation levels, β = .347 on corruption levels, β = .363 on policy transparency, β = .205 on happiness, and β = 1.34 on national competitiveness. Significant total effects of social capital were β = .701 on social responsibility, β = .642 on corruption levels, β = .621 on policy transparency, β = .513 on happiness, and β = .645 on national competitiveness, while regulation levels had total effects of β = .155 on corruption levels, β = .106 on happiness, and β = .120 on national competitiveness. In addition, corruption levels had significant total effects of β = .514 on happiness and β = .323 on national competitiveness. Gini coefficient had a total effect of β = .402 on happiness, and policy transparency had a significant total effect of β = -.446 on happiness.
] The total effects of variables caused to happiness and national competitiveness
The total effects of variables caused to happiness and national competitiveness
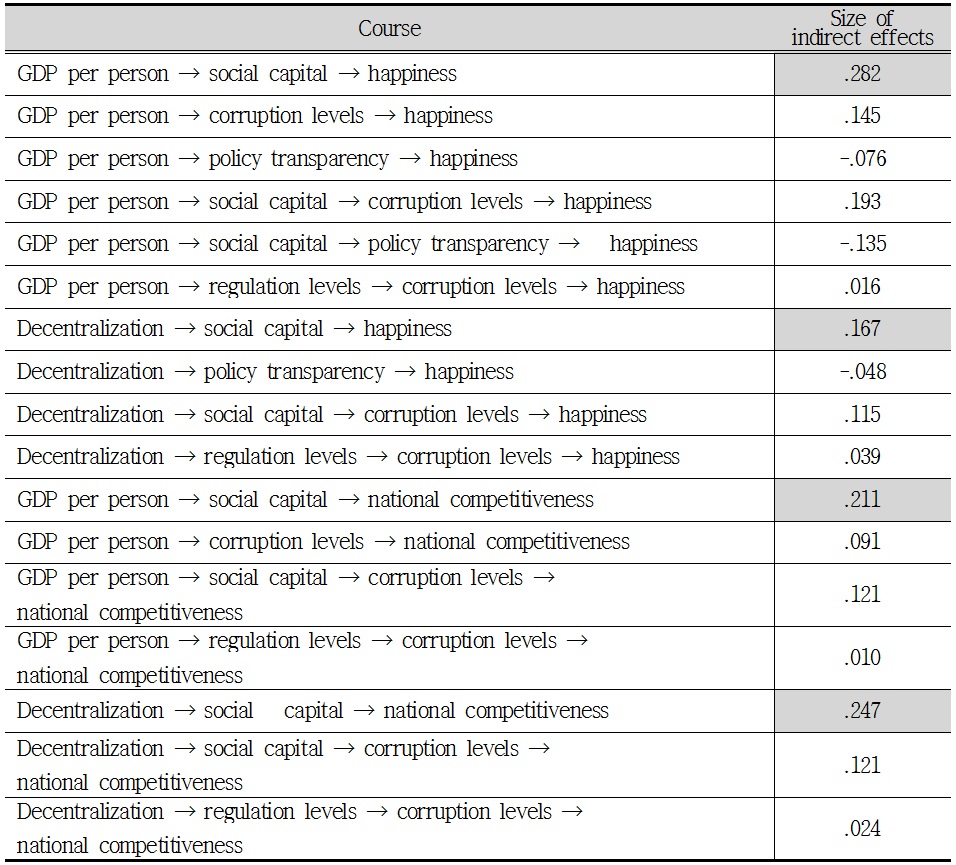
To understand via which course GDP per person and decentralization affect happiness and national competitiveness, a specific disassembly on the significance of indirect effects of variables was conducted using bootstrap. The results are shown in Table 11.
] Detailed explanation on the indirect effects on happiness and national competitiveness
Detailed explanation on the indirect effects on happiness and national competitiveness
Indirect effects are calculated by multiplying the direct effects of potential variables. First, the course which had the largest influence of all indirect courses from GDP per person to happiness was the GDP per person → social capital → happiness course, with an effect of .282. The course which had the largest influence of the indirect courses from decentralization to happiness was the decentralization → social capital → happiness course, which had an indirect effect of .167. The course that had the largest influence of the indirect courses from GDP per person to national competitiveness was the GDP per person → social capital → national competitiveness course, with an effect of .211. The indirect course from decentralization to national competitiveness that had the largest influence was the decentralization → social capital → national competitiveness course, which had an indirect effect of .247. As can be seen from these results, social capital was the most important intermediating factor that connects the course between GDP per person and decentralization to happiness and national competitiveness.
Local decentralization in general includes administrative, political, and fiscal decentralization. However, it is very difficult to compare administrative or political decentralization levels across countries. Though it is also difficult in the case of fiscal decentralization as well, comparisons here are relatively easier to make. In this study, the main focus was on fiscal decentralization, and comparisons were made by deriving decentralization scores of different countries by applying weighted values on indicators such as the discretion of local authorities on taxation, as well as utilizing traditional methods which consider the ratio of local taxes to total tax income or the ratio of local expenditures to total government expenditure. The results show that the fiscal decentralization level of Korea is estimated to be about 90 percent of the average OECD level. When one uses the weighted values of taxation autonomy related to the discretion of taxation as standards, Korea’s score becomes 88 percent compared to the OECD average, similar to the previously mentioned score. Also, since taxation decentralization levels are lower than the OECD average relative to expenditure decentralization, there is a need, especially, to strengthen decentralization in this area.
In addition, the results of an analysis of the influences decentralization has on dependent variables such as national competitiveness or national happiness show that although decentralization does not directly influence national happiness, not only does it have direct and indirect effects on national competitiveness but it actually affects this the most out of all policy variables.
From this analysis a number of policy implications can be drawn. First, there is a need to properly recognize local decentralization levels. There is a need for objective problem recognition in relation to the current level of Korea compared with that of other countries, instead of only emphasizing local decentralization. When one focuses on fiscal decentralization, the taxation and expenditure of local authorities in Korea fail to reach the average for the 26 OECD countries, being only 90 percent of this.
Second, there is a need to strongly promote decentralization, as it positively improves national policy variables. National competitiveness is directly influenced by decentralization: the effect on national competitiveness is stronger than that of any other variable. Not only that, but decentralization also directly increases social responsibility, fosters social capital, and brings positive effects to deregulation. Furthermore, it is estimated to have a direct effect on the improvement of policy transparency.
Even when one considers indirect effects, decentralization increases social capital, and this increase leads to an increase in national happiness. In addition, it is estimated that decentralization increases social capital, and this leads to an indirect increase in national competitiveness. As can be seen in these processes, decentralization itself has direct or indirect positive effects on national competitiveness and happiness, and therefore, strongly promoting decentralization in governmental policies is required. It is also found that deregulation, which has recently been emphasized by the Korean Government, can be improved through the promotion of decentralization.
Third, even if decentralization is promoted, it is necessary to put policy effort into increasing variables, such as social capital, which perform the role of intermediate parameters. Even if improvement here cannot be brought about instantly, efforts to improve social capital, such as ethical actions and mutual trust, are needed to improve the level of national happiness.
참고문헌
1.
Ahmad E., Brosio G., Tanzi V.
(2008)
Local Service Provision in Selected OECD Countries: Do Centralized Operations Work Better?
2.
Baskaran T.
(2011)
Fiscal Decentralization, Ideology, and The Size of the Public Sector
[European Journal of Political Economy]
Vol.27 P.485-506
3.
Bjornskov C., Drehe A., Fisher J.
(2008)
On Decentralization and Life Satisfaction
[Economic Letters]
Vol.99 P.147-51
4.
Choi Y. C.
(2013)
Analysis of the Relationships between Decentralization Level and Policy Variables
[Local Government Studies Review]
Vol.17 P.369-89
5.
Davoodi H., Zou H.
(1999)
Fiscal Decentralization and Economic Growth in the United States
[Journal of Urban Economics]
Vol.45 P.222-39
6.
Fukasaku K., de Mello L.
(1998)
Fiscal Decentralisation and Macroeconomic Stability: the Experience of Large Developing Countries and Transition Economies in Democracy. In K. Fukasaku and R. Hausmann (eds), Decentralisation and Deficits in Latin America
7.
Hong J. H., Ha H. S., Choi Y. C.
(2006)
Developing Indicators for Decentralization
[Local Government Studies]
Vol.10 P.7-30
8.
(2011)
World Competitiveness Report (online database).
9.
Jang J. H.
(2013)
Relationships between Infant Policy and National Competitiveness in OECD Countries
[Korea Comparative Government Studies]
Vol.17 P.73-94
10.
Jung J. H.
(2000)
How To Evaluate National Competitiveness?
11.
Keum C. H.
(2013)
Future Strategy for Decentralization Policies in Park Administration.
[KRILA Conference Proceedings]
12.
Keum C. H., Choi Y. C.
(2013)
Evaluating Decentralization Policies of Lee Myung Bak Administration
[Korea Local Autonomy Studies]
Vol.27 P.1-18
13.
Lee S. J.
(1993)
Management Strategies for Successful Policy Implementation
[Local Administration Review]
Vol.8 P.85-105
14.
Lee S. J.
(2005)
Evaluating Local Decentralization Policies of Roh Administration
[Public Administration Studies]
Vol.43 P.68-89
15.
(2013)
Measuring Fiscal Decentralisation: Concepts and Policies
16.
Park H. B.
(2001)
Social Capital and Local Government Competitiveness.
[KAPA Conference Proceedings]
17.
Schneider A.
(2003)
Decentralization: Conceptualization and Measurement
[Studies in Comparative International Development]
Vol.38 P.32-56
18.
So J. K.
(2004)
Measurement Indicators for Social Capital
[Korea Regional Development Studies]
Vol.16 P.89-118
19.
Suh S. T.
(2002)
Role and Tasks of Urban Planning for Strengthening Social Capital
[Land Studies]
Vol.33 P.73-87
20.
(2011)
Global Competitiveness Report 2010?2011
21.
Xie D., Zou H., Davoodi H.
(1999)
Fiscal Decentralisation and Economic Growth in the United States
[Journal of Urban Economics]
Vol.45 P.228-239
22.
Zhang T., Zou H.
(1998)
Fiscal Decentralization, Public Spending and Economic Growth in China
[Journal of Public Economics]
Vol.67 P.221-240
OAK XML 통계
이미지 / 테이블
[
<Table 1>
]
Measurement indicators for decentralization
[
<Table 2>
]
Weighted values per analysis areas and measurement indicators
[
<Table 3>
]
Description of measurement variables and source of data
[
<Figure 1>
]
A hypothetical research model
[
<Table 4>
]
Weighted value on taxation autonomy, the ratio of local taxation and expenditure levels
[
<Table 5>
]
Decentralization score
[
<Table 6>
]
Average and standard deviation of variables (2008?2013)
[
<Table 7>
]
Average and standard deviation of variables (2013)
[
<Table 8>
]
Correlation between variables
[
<Table 9>
]
The goodness-of-fit index of the model
[
<Figure 2>
]
Final model
[
<Table 10>
]
The total effects of variables caused to happiness and national competitiveness
[
<Table 11>
]
Detailed explanation on the indirect effects on happiness and national competitiveness