The Impact of Material Hardship on Children’s Physical Health Trajectories*, **
물질적 빈곤 경험이 저소득층 아동의 건강 궤적에 미치는 영향에 관한 연구
Author: Slack
Kristen S., Holl
Jane L.
Publish:
Journal of the Korean society of child welfare
Volume , Issue37, p103~137, March
2012
ABSTRACT
The Impact of Material Hardship on Children’s Physical Health Trajectories*, **
본 연구는 미국에서 복지수급을 받고 있는 가정에서 자라나는 아이들의 빈곤경험이 이들의 건강궤적에 미치는 영향에 대해 탐색적으로 분석하는 데 그 목적이 있다. 최근 건강불평등에 대한 연구를 통해 빈곤이 개인의 건강에 장⋅단기적으로 미치는 영향에 대한 관심이 증대되고 있으나, 아동기의 빈곤이 건강궤적에 미치는 영향에 대한 연구는 아직까지 탐색적인 수준에 머무르고 있다. 따라서 본 연구는 물질적 빈곤 경험이 저소득층 아동의 건강 궤적에 미치는 영향을 분석함으로써 아동 건강불평등의 영향요인에 대한 이해를 증진시키고자 한다. 본 연구에서는 1998년에 복지수급을 받고 있던 저소득층 가구들을 표본으로 2001년부터 2004년까지 총 4차년도의 패널데이터를 수집한 일리노이 가족 연구(Illinois Families Study)와 이 연구의 아동부가조사(Illinois Families Study-Child Well-being Supplement)데이터를 활용하였다. 질병으로 인한 아동의 의료이용 횟수와 앓아누운 날 수를 주요 종속 변수로 활용하였으며, 데이터의 분석은 패널데이터의 특성을 고려하여 다층성장모형 분석방법을 이용하였다. 독립변수들을 투입하지 않은 무조건모형에서는 의료이용 횟수와 앓아누운 날 수는 아이의 연령이 증가함에 따라 감소하는 것으로 나타났으며, 이는 전반적으로 아동의 건강상태가 계속 좋아지는 것으로해석될 수 있다. 반면에 물질적 빈곤과 건강궤적의 관계에서는 물질적 빈곤을 많이 경험할수록 저소득층 아동의 건강궤적에 부정적인 영향을 미치는 것으로 나타났으며, 물질적 빈곤의 개별적인 종류가 저소득층 아동의 신체적 건강에 미치는 영향은 측정 지표에 따라 다르게 나타났다. 구체적으로 불안정한 주거와 아동의 미충족 의료수준은 아동의 질병으로 인한 의료 이용궤적의 초기값과 유의미한 관계를 갖는 것으로 조사되었으며, 식품 미보장은 아동이 앓아누운 날 수로 측정된 건강궤적의 변화율과 통계적으로 유의미한 관계를 갖는 것으로 나타났다. 이러한 미국의 연구 결과는 한국에서 아동 건강 불평등에 대한 연구의 활성화 및 이를 극복하기 위한 정책적⋅실천적 방안 모색의 필요성에 대한 함의를 지닌다.
KEYWORD
health trajectories
,
low-income children
,
material hardship
,
physical health
,
hierarchical generalized linear modeling
Socioeconomic disparities in physical health have been found throughout the life course(Adler et al., 1994; Chen, Matthews & Boyce, 2002; Marmot & Wilkinson, 2006). Numerous studies investigating the association between income and adult health have found that income has a “gradient effect.1)” Moreover, recent findings from studies show that adverse socioeconomic experiences during childhood are associated with adult health outcomes(Galobardes, Lynch, & Smith, 2004; Hayward & Gorman, 2004; Power, Manor, & Matthews, 1999). These findings have increased interest in understanding the short-and long-term effects of poverty during childhood on physical health throughout the life course.
However, previous studies examining this association have done so mostly using cross-sectional or pooled data(Case et al., 2002; Currie & Stabile, 2003; Newacheck, Jameson, & Halfon, 1994; Weinick et al., 1998). Even studies that investigated age differentials in the effect of income and children’s physical health relied mostly on cross-sectional data and examined the effect by dividing the children into different age groups(e.g., 0-3, 4-8, 9-12, 13-17; Case et al., 2002; Currie & Stabile, 2003). One limitation of this approach is its inability to isolate cohort effects from actual changes in health over time.
In addition, the vast majority of studies that examined socioeconomic disparities and children’s physical health have compared the health of children in poverty to children from higher-income families(Newacheck et al., 1994; Weinick et al., 1998). As a result, little is known about why the health of children from similar socioeconomic backgrounds varies. Researchers who examined the changes and fluctuations of individual health over the life course in adulthood emphasize that there is not a general health trajectory followed by most people, but rather, there are wide variations among individuals depending on current and past life experiences(Aldwin, Spiro, Levenson, & Cupertino, 2001; McDonough & Berglund, 2003).
The present study aims to examine the health trajectories of low-income children and to explore how indicators of socioeconomic status and material hardship are associated with between-individual differences. Particular attention will be paid to examine the individual and cumulative effects of multiple indicators of material hardship on low-income children’s health trajectories. Using four waves of data from Illinois Families Study-Child Well-being Supplement, the present study aims to address the following research questions:
1)This term is used to describe the phenomenon of relatively wealthier people having better health outcome than the less privileged at every level of the income hierarchy (Adler et al., 1994; Case, Lubotsky, and Paxson, 2002), in terms of both mortality and morbidity (see Adler et al., 1994 for a review). 2)Several studies have found that the effect of income becomes stronger as children age(Case et al., 2002; Currie & Stabile, 2003). However, West (1997) suggests that the income effect is strong during the early years of childhood, diminishes during adolescence, and becomes stronger again during young adulthood. Moreover, Chen and her colleagues (2006) found that depending on the outcome, the income effect may stay the same across age groups.
Most studies on longitudinal health trajectories have focused on adult health (Aldwin et al., 2001; McDonough & Berglund, 2003). To the best of our knowledge, only one group of researchers investigated the trajectories of adolescent health employing a latent growth-curve analytic method(Wickrama, Conger, Lorenz, & Elder Jr., 1998; Wickrama, Lorenz, & Conger, 1997). Using a 12-item self-report scale that asked about adolescents’ physical complaints(e.g., headaches, stomach aches, and allergies), Wickrama and colleagues(1997) found that during the four-year study period, adolescents’ physical complaints increased over time. They also reported that trajectories of adolescent physical health are associated with trajectories of parental support, parental education, and parental rejection(Wickrama et al., 1997; Wickrama et al., 1998).
There is also a growing body of research in Korea that examined the impact of poverty on children’s physical health(Kwon & Ku, 2010; Lee, Kim, & Kim, 2010). For example, Kwon and Ku(2010) investigated the association between poverty and general assessment of children’s health using the data from the Seoul Panel Study of Children. They found that poverty negatively affects children’s health and that this association is mediated by poor parent child relationship and marital conflict(Kwon & Ku, 2010). Similar results were found with more nationally representative samples(Lee, Kim, & Kim, 2010). Studies have also found that family poverty is associated with children’s physical growth, which was measured by height-for-age and body mass index(Pak, Lee, & Kim, 2007; Pak, Lee, Lee, Kim, & An, 2008).
Conventional measures of SES(e.g., income, parental education, employment status) are most commonly used to examine the link between poverty and children’s health. However, scholars emphasize the need to move beyond conventional measures of SES, and incorporate additional economic indicators such as material hardship to better characterize the economic and living conditions of individuals in poverty(Beverly, 2000; Ouellette, Burstein, Long & Beecroft, 2004). Variables that are more proximal in nature may provide additional insight about the relationship between poverty and health, particularly, when examining within-group variations among children in poverty.
Although there is no general consensus about the definition of material hardship, this study focuses on five domains of material hardship(food insecurity/insufficiency,3) housing--quality, overcrowding, and security, basic utilities, unmet medical needs, and durable goods) identified by Ouellette and colleagues(2004). Previous literature examined the associations between children’s physical health and housing related hardships, food insecurity, and unmet medical needs.4) For example, children living inpoor-quality and overcrowded housing are more likely to suffer adverse health consequences, including accidents, and injuries, lead poisoning, and infectious diseases than children in better quality housing(Kim, Sataley, Curtis, & Buchanan, 2002; Pamuk, Makuc, Heck, Reuben, & Lochner, 1998; Sharfstein, Megan, Kahn, & Bauchner, 2001; Wood, 2003). In addition, children from households experiencing food hardship have worse health outcomes than children from low-income families who do not experience any food hardship(Alaimo, Olson, Frongillo, & Briefel, 2001; Olson, 1999; Weinreb et. al., 2002). The nature of the association between unmet medical needs and children’s health is still not clear due to conflicting results from research(Newacheck et al., 2000; Weathers, Minkovitz, O’Campo, & Diener-West, 2004). However, researchers have found that when these medical needs are not met, children are at risk for developing more severe and chronic physical and psychological conditions(Davidoff, Garrett, Makuc, & Schirmer, 2000; Newacheck et al., 2000; Szilagyi & Schor, 1998).
Studies that examine the association between material hardship and children’s physical health have generally concentrated on the impact of a single form of material hardship and seldom investigated multiple dimensions of material hardship(Alaimo et al., 2001; Olson, 1999; Rafferty & Shinn, 1991; Weinreb, Goldberg, Bassuk, & Perloff, 1998; Weinreb et. al., 2002). Although the findings from these studies offer insight into how children’s health is affected by each type of material hardship, they do not provide a clear description of how these interrelated domains of material hardship affect children’s physical health simultaneously. Joint consideration of multiple indicators of material hardship in analytic models is expected to help us better understand relative impact of different types material hardship on children’s physical health trajectory.
Moreover, some researchers assert that the number of co-existing risk factors may have a greater impact on children’s outcome than any specific type of single isk(Sameroff, Seifer, Barocas, Zax, & Greenspan, 1987; Sameroff, Seifer, & Bartko, 1997). Thus, a cumulative risk index where the number of risk factors that children experience is summed as a summary score is utilized to investigate the cumulative effect of risk factors on child outcomes. Currently, the association between indicators of materialhardship and children’s health trajectory is not investigated well, which prevents a better understanding of the relative and cumulative associations between material hardship and children’s health. Thus, this study seeks to examine the differential and cumulative effect of interrelated indicators of material hardship on children’s health trajectory.
3)Food insecurity is a concept that has been developed by the United States Department of Agriculture using an 18-item scale. Food insecurity is defined as the “Limited or uncertain availability of nutritionally adequate and safe foods or limited or uncertain ability to acquire acceptable foods in socially acceptable ways” (Nord & Bickel, 2002). On the other hand, food insufficiency is a concept that has been developed by the Community Childhood Hunger Identification Project. Food insufficiency is defined as “inadequacy in the amount of food intake because of lack of money or resources to access enough food,” and is measured by asking the respondents “how often [they did] not get enough food to eat in the last 3 months” (Casey, Szeto, Lensing, Bogle, & Weber, 2001). 4)Among the five domains of material hardship identified by Ouellette and colleagues(2004), I was not able to find previous studies that examined impact of material hardship on children’s physical health for two of the five domains (i.e., difficulty paying for utilities and durable goods). However, difficulty paying for utilities domain was considered in the analyses for consistency. The durable goods domain was not considered in this study due to the lack of adequate measures.
The analyses were conducted using data from the Illinois Families Study(IFS) and the Illinois Families Study-Child Well-being Supplement(IFS-CWB). The explanatory variables were mostly obtained from the first wave of the IFS.5) Information for the outcome variables(i.e., child physical health) was extracted from all four waves of the IFS-CWB.
IFS is a five-year panel study that followed a stratified random sample of 1,899 families who were residing in Illinois and receiving welfare cash benefits in September, 1998(Lewis et al., 2000). The study followed welfare recipients and their families for five years after the implementation of Temporary Assistance to Needy Families(TANF) in Illinois. The aim of the study was to examine the well-being and adaptation of families who were affected by welfare reform. The annual survey asked for information from current and former welfare recipients about their welfare and work experiences, financial hardships, health and well-being, and family characteristics. Individual-level administrative data which included information on welfare receipt and employment were obtained from the Children’s Integrated Database on Child and Family Programs in Illinois(IDB) created by the Chapin Hall Center for Children at the University of Chicago.
Following the first wave of the IFS survey, all families with a child under the age of three were selected for a supplementary study-IFS-CWB. The youngest child in each family was considered to be the “target child,” or the child of interest for the study. Survey questions for IFS-CWB gathered in-depth information about each target child including detailed information about target child’s health conditions, physical needs, medical providers, and access to health care services.
After the initial response rate of 72%(N=1363) during the first wave of IFS in 1999and 2000, the response rates the four waves of IFS-CWB survey were 95%(n=553), 88%(n=484), 92%(n=445), and 91%(N=405), respectively. Since one target child was selected from each household, the total number of families, as well as the total number of target child included in the first wave of IFS-CWB was 553. Sampling weights were created and applied to all the analyses to adjust for the over- representation of sample members from smaller counties and for non-responses. For Hierarchical Generalized Linear Modeling(HGLM) analyses, sampling weights were applied at the individual level(i.e., level-2).
Attrition analyses indicate that those who did not remain in the study were more likely to be African American and have a shorter history of welfare receipt compared to those who remained in the study. To minimize biases associated with differential attrition, all individuals who provided any information regarding the outcomes and full information for level-2 predictors were included in the study. This also reflects the level of flexibility that HGLM allows in dealing with missing observations and making the maximum use of available data to estimate parameters of individual change(Raudenbush & Bryk, 2002; Singer and Willett, 2003).
Two indicators of physical health were examined. For both dependent variables, issues related to unequal periods between interviews were adjusted for by adding an exposure variable(i.e., number of months between each interview) in HGLM models.
Number of sick visits : Caregivers were asked “since your last interview, how many times has the target child gone to see a doctor or other health professional because he or she was sick?” The number of visits counted by the primary caregiver was used as a count variable in the analysis.
Number of sick days in bed : Caregivers were also asked “since your last interview, how many days has the target child stayed home in bed because he or she was sick?” The number of sick days counted by the primary caregiver was included as a count variable.
2) Basic child and caregiver characteristics
Basic demographic characteristics, such as child’s gender, birth weight, and chronic physical conditions were included in the statistical models as dummy variables. Male children, children with chronic physical conditions that limit their activities, children whose birth weight was less than 2,500 gram or children whose birth weight was missing were assigned “1.” Child’s age at W2 IFS interview was included as a continuous variable.
To examine whether health care access affects the associations between socioeconomic status, material hardship, and children’s physical health, target child’s health insurance status, assessed at the W2 IFS interview, was considered as a control variable. The type of children’s health insurance was assessed by asking caregivers whether the “child is currently covered by a health insurance plan” at the time of the interview and “the type of health insurance.” Two dichotomous variables were created: one variable identified children who did not have any health insurance at the time of the interview, and the other variable identified children who had private health insurance. The reference group comprised of children who were on public health insurance, such as Medicaid or the State of Illinois’ Children’s Health Insurance Program(KidCare).
Caregiver characteristics such as age, race and ethnicity, marital status, and household characteristics including region of residence and number of children living in the household were also considered as control variables. Caregiver’s age at the W1 IFS interview was reported in number of years. For caregiver’s race and ethnicity, two dichotomous variables which indicate that the caregiver either 1) identified herself as Hispanic or 2) identified herself as Non-Hispanic white or other race or ethnicity were constructed. The African American caregivers were the reference group. Two dichotomous variables that indicate caregivers who were currently married or who were not married but cohabiting with a significant other were also constructed, leaving the remaining caregivers as the reference group. A region of residence(metropolitan area or downstate Illinois) and number of children living in the household were also included.
3) Socioeconomic characteristics
Variables that measure caregivers’ socioeconomic status including income, education, welfare history, and work experience were included in the analytic model to examine how conventional measures of socioeconomic status explain between-individual differences in low-income children’s physical health trajectories. Household income was measured as an ordinal variable from “1= less than $2,500” to “15=$50,000 or more.” A dichotomous variable that captured caregiver’s level of education was also created (high school graduate or greater or otherwise). For welfare history, the number of months on welfare during a 6-year period prior to the W2 IFS interview year (1995-2000) was computed from the administrative data. Similarly, past work experience was computed as the number of quarters working during the 6-year period prior to the W2 IFS interview year.
4) Material hardship indictors
In order to examine how material hardship affects children’s health, the study utilized two approaches to examine the association. First, each material hardship variable was dichotomized so that “1” indicated high risk and “0” indicated low risk (Appleyard, Egeland, van Dulmen, & Sroufe, 2005; Gutman, Sameroff, & Eccles, 2002).6) To understand the unique effect of each type of material hardship, these indicators were simultaneously included in the analytic model. Second, a cumulative material hardship index was formulated by adding the values for each material hardship item to estimate the number of material hardship experienced by each child.
Housing : Three aspects of housing(housing insecurity, housing quality, and overcrowding) were assessed. Housing insecurity was assessed using a five-item scale on caregivers’ experiences of housing insecurity. Caregivers were asked whether they had experienced more than a two-day period of having to “stay at a homeless shelter or domestic violence shelter,” “live in a car or other vehicle,” “live in an abandoned building,” “live on the streets” or “stay with a friend or relative for less than two weeks because you had nowhere else to go.” Children whose caregivers answered “yes” to at least one of these items were considered to have “housing insecurity.”
Caregivers’ housing conditions were assessed by asking whether any of the seven items(e.g., leaky roof, ceiling, or walls; rats, mice, roaches, or other insects; broken windows) applied to their current living situation. Children whose primary caregiver responded “yes” to two or more problems were considered as “having poor quality housing”(Mayer & Jencks, 1989).
The final aspect of housing quality included a measure of crowdedness computed as a ratio of the number of people per bedroom. Children in households with more than 2 members per bedroom were considered to live in crowded households.
Food hardship : In the present study, we define food hardship as often “having reduced quality and variety of children’s diet”(Nord & Bickel, 2002). The measure of food hardship consists of four child-specific food insecurity items that were derived from the USDA Core Food Security Module(Price, Hamilton, & Cook, 1997). Each item assesses whether a child is experiencing a specific type of food hardship regardless of an indication of hunger. Children whose espondents answered “often” to any of the four items in the scale were considered to be “experiencing food hardship.”
Utilities : Respondents’ financial capacity to afford essential utilities was assessed by asking respondents whether utilities(gas, electricity, oil) had been turned off since the last interview because payments were not made. If the respondent answered “yes” to any of the items, the children were considered to be living in households experiencing “utility hardships.”
Unmet medical needs : In order to assess whether the family was able to afford adequate health care, respondents were asked whether there had been a time when a child in the family, not necessarily the target child in this study, needed medical services from a doctor, prescription drugs, or dental care but did not receive the service because the respondent was not able to afford it. Children were assigned “1” if the respondent answered, “yes” to any of these questions regarding unmet medical needs.
Growth curve analysis using the Hierarchical Generalized Linear Modeling(HGLM) technique was employed in this study. The multilevel modeling technique accounts for within-individual changes over time as well as between-individual differences by dividing the model into two levels. This approach treats the longitudinal data as repeated measures(level-1) nested within individuals(level-2). Level-1 models allow us to estimate and understand how children’s physical health outcomes change over time. Level-2 models examine whether there are significant variations in each person’s health trajectory(Singer & Willett, 2003). Treating repeated measures as nested within individuals allows for greater flexibility in dealing with unequal spacing between observations and missing observations and allows us to make the maximum use of any and/or all available data to estimate parameters of individual change(Raudenbush & Bryk, 2002; Singer and Willett, 2003). In addition, a random effects model was fitted to account for the between-individual differences in low-income children’s health trajectories.
Since the variance for level-1 random effects for count outcome variables is not homogeneous and is dependent on the predicted value, Hierarchical Generalized Linear Models(HGLMs) with varying exposures were estimated. In HGLM, a level-1 link function is used to transform the outcome variable so that it could have a linear function with the explanatory variables. For count data, HGLM uses a Poisson model and a log link function(Raudenbush & Bryk, 2002). If Yti is the number of events occurring during a time length of mti, the level-1 unconditional model for the count data can be expressed as:
The expected number of events occurring during a time period of mti would be the product of the length of exposure and the event rate(λti). The link function(ηti) for a level-1 Poisson sampling model is the log event rate(ηti) that can have any value ranging from negative to positive. In addition, the time variable, tti, is defined as the wave of the IFS-CWB interview. As previously mentioned, the first wave of IFS-CWB interview coincided with the second wave of IFS. As a result, π0i represents the log event rate of the dependent variable for child i at tti=0, which is at W1 IFS-CWB interview. On the other hand, the slope(π1i) represents the rate of change in the log event rate(Snijders and Bosker, 2002).
The procedures used to fit level-2 models that examine the association between the explanatory variables and these growth parameters(i.e., π0i and π1i) are as follows. First, a level-2 unconditional model can be expressed as:
Since π0i represents the average log event rate at W1 IFS-CWB, β00 can be interpreted as the average log event rate at W1 IFS-CWB. In addition, π1i represents the expected amount of change in log event rate, and β10 represents the average amount of change in log event rate. The error terms, u0i and u1i, reflect the amount of variation that exist between individuals in relation to their growth parameters. These random effects are expected to have variances of τ00 and τ11 with a covariance of τ01.
The level-2 models with explanatory variables(Xqi) can be expressed as:
β00 is the expected log event rate at tti=0(W1 IFS-CWB interview); β01 is the amount of change in the expected log event rate at tti=0 when there is a unit increase in X1i; β10 is the expected rate of change in the log event rate; β11 is amount of change in average rate of change in the log event rate when there is a unit increase in X1i. The random components, u0i and u1i, can be interpreted as the random effects of child i on the log event rate at W1 IFS-CWB interview and on the rate of change in the log event rate after accounting for all the variables.
Using these strategies, indicators of material hardship and socioeconomic status, controlling for demographic variables of the child and the caregiver, were employed to estimate the intercept(π0i) and the slope(π1i).
5)Because detailed information about the target child’s health care utilization and insurance status was included in the IFS-CWB, access to health care services variables (i.e., regular source of health care and type of health insurance) were extracted from wave 1 IFS-CWB, which coincides with wave 2 of IFS. 6)Although the scales used in this analysis were dichotomized, the statistical properties of the original scales (e.g., housing problems and food hardship) were evaluated. Each scale yielded values of Cronbach’s alpha greater than .70.
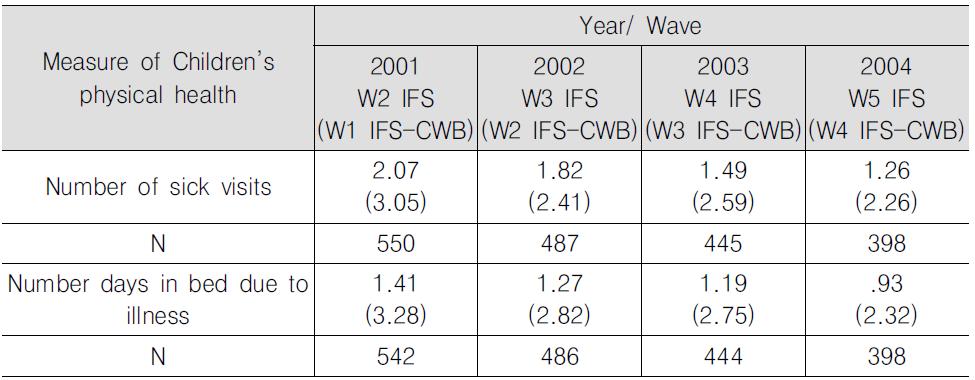
Means and standard deviations of the key outcome variables for each wave are presented in <Table 1>. Children had, on average, 2.07 sick visits to the doctor between Wave 1(W1) and Wave 2(W2) IFS interview and spent, on average, a reported 1.41 days in bed due to illness. The mean number of sick visits and number of sick days in bed decreased as each wave progressed.
] Means for the Measures of Children’s Physical Health, Spanning four waves
Means for the Measures of Children’s Physical Health, Spanning four waves
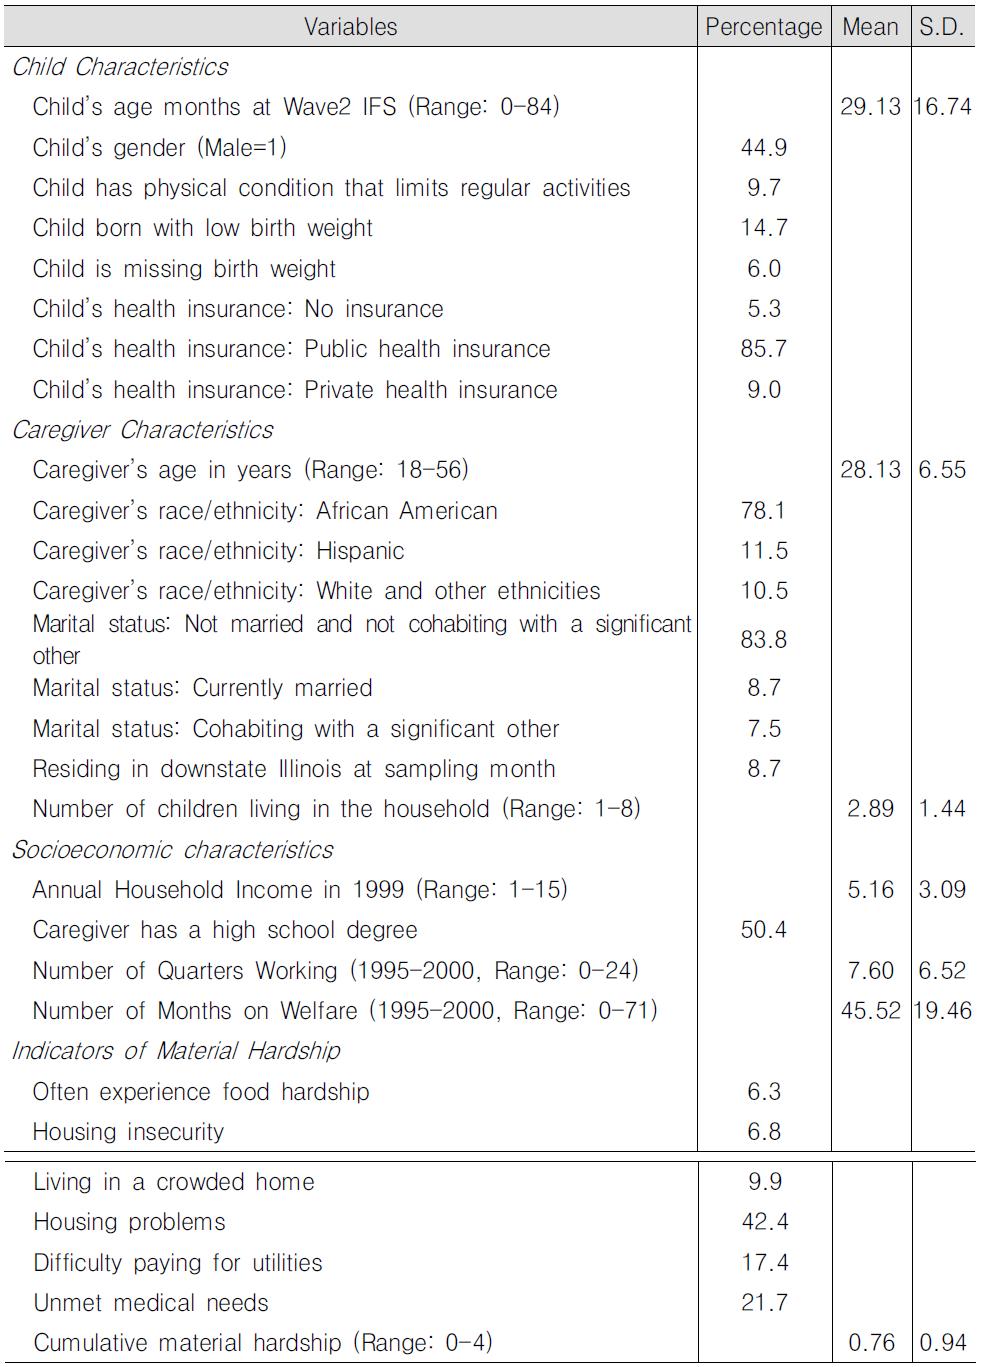
Descriptive(weighted) statistics for basic demographic characteristics of the sample children and the families are presented in <Table 2>. The target child’s average age in months at W1 IFS-CWB is 29.13 months(S.D. 16.74). Among the 553 children whose caregiver responded to the W2 IFS main survey and W1 IFS-CWB, 44.9% were male, 14.7% of the children had low birth weights(<2,500grms), and 9.7% of the children had physical conditions that limited their activity. Eighty-six percent of the children were covered by public health insurance, and 9.0% of the children were covered by private health insurance at W1 IFS-CWB.
In terms of caregiver characteristics, the mean age was 28.13 years(S.D. 6.55). Seventy-eight percent of the children had a primary caregiver who is African American, 11.5% had Hispanic caregivers, and 10.5% had a caregiver who is White or of another race. Approximately 8.7% of the sample children had a primary caregiver who was married at the time of the W1 IFS interview and an additional 7.5% of the children had a primary caregiver who was cohabiting with a partner. Ninety-one percent of the sample lived in Cook County. Descriptive statistics on caregiver’s socioeconomic conditions and material hardship are also provided in <Table 2>.
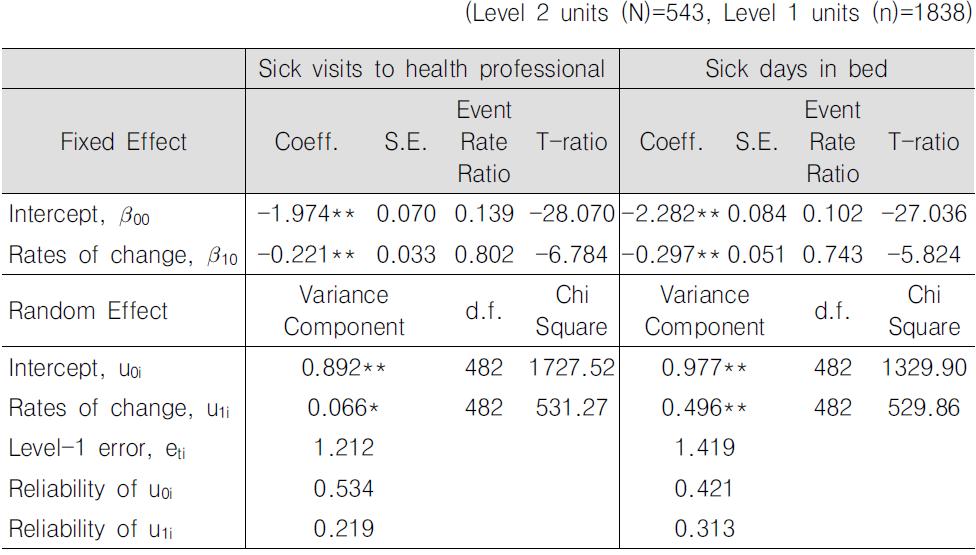
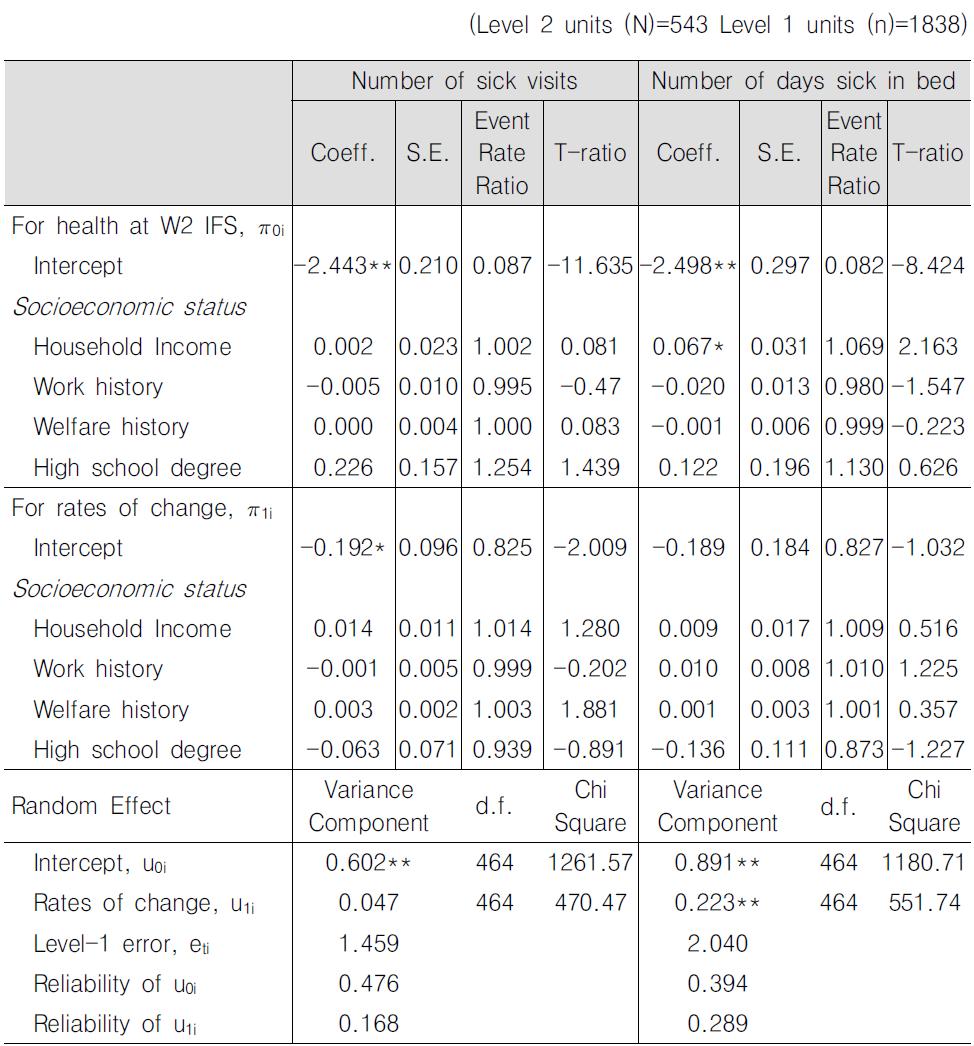
First, unconditional growth models that only include the time variable for the level-1 predictor were estimated. The results for these unconditional growth models are presented in <Table 3>.
] Unconditional models from HGLM longitudinal data analysis
Unconditional models from HGLM longitudinal data analysis
With regard to the trajectory of children’s sick visits, the expected number of sick visits experienced by children at W1 IFS-CWB(t=0) is, on average, .139 visits per month. A decrease of approximately .221 log event rate in the number of sick visits is observed for each successive data collection wave which coincides with the ageing of the cohort. On average, the estimated number of sick visits per month is expected to decrease to .111 visits per month at W2 IFS-CWB(t=1), and .072 visits per month at W4 IFS-CWB(t=3). The variance components suggest significant variations in the intercept and the rates of change over time. Similar results are found for the number of days a child stayed in bed due to illness variable. Children at W1 IFS-CWB(t=0) are estimated as having spent approximately .102 days per month in bed due to illness. Thereafter, the number of days spent in bed is expected to decrease by .297 log event rate. Significant variations in children’s health status at W1 IFS-CWB(t=0) and rates of change over time are also found for the number of days children stayed in bed due to illness trajectory.
To understand how conventional measures of socioeconomic status explain individual variations in children’s health trajectories, we examined the association between socioeconomic status and health trajectories controlling for basic demographic characteristics. The estimates for fixed and random effects are provided in <Table 4>.
For the number of days that a child stayed in bed due to illness, household income is found to have a significant positive association with the number of days a child spent in bed at W1 IFS-CWB(t=0). Interestingly, a unit increase in the household income category is associated with an increase in the number of days spent in bed per month at W1 IFS-CWB by a factor of 1.069 around the mean income. In other words, while the number of days a child spent in bed due to illness for a child living in a household with average income(of the study population) is .082 days per month, the number of days a child spent in bed for a child with a household income that is a unit higher than the average income is .088 days per month. However, other conventional measures of socioeconomic status such as caregiver’s education, work, and welfare experience are not significantly associated with both the intercept and the rates of change. In addition, the average log event rates of change(intercept for rates of change) is no longer significant suggesting that after including basic demographic characteristics and socioeconomic conditions in the analytic model, a significant change in the log event rates is not, on average, observed. However, significant variance components suggest that a significant amount of the variability in the number of days sick in bed trajectory can be explained by including additional variables.
] Estimated fixed and random effects of socioeconomic status and child’s health insurance status on children’s health trajectories
Estimated fixed and random effects of socioeconomic status and child’s health insurance status on children’s health trajectories
When the associations between socioeconomic characteristics and the trajectory for sick visits were examined, conventional measures of socioeconomic status such as household income, caregiver’s education, and work and welfare experience are not significantly associated with the trajectory of sick visits. While the variance component for the intercept is still significant, suggesting that there is still a significant amount of variance unexplained by these variables, the variance component for the slope is insignificant after including the basic demographic and socioeconomic characteristics.
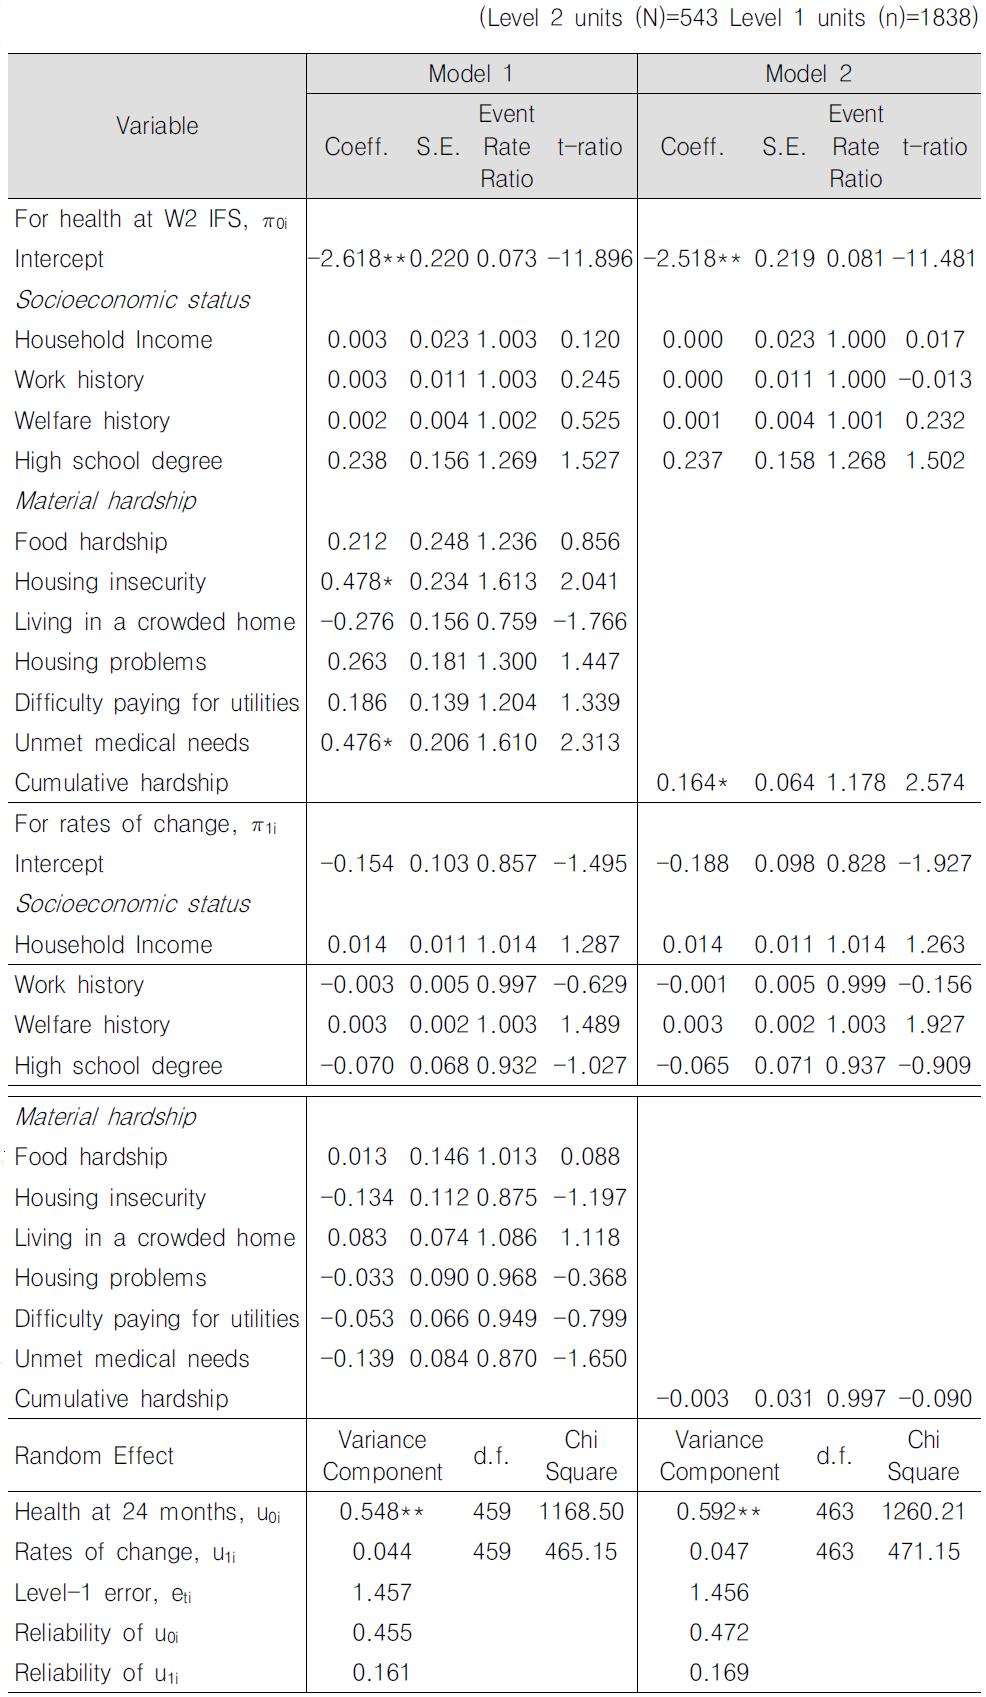
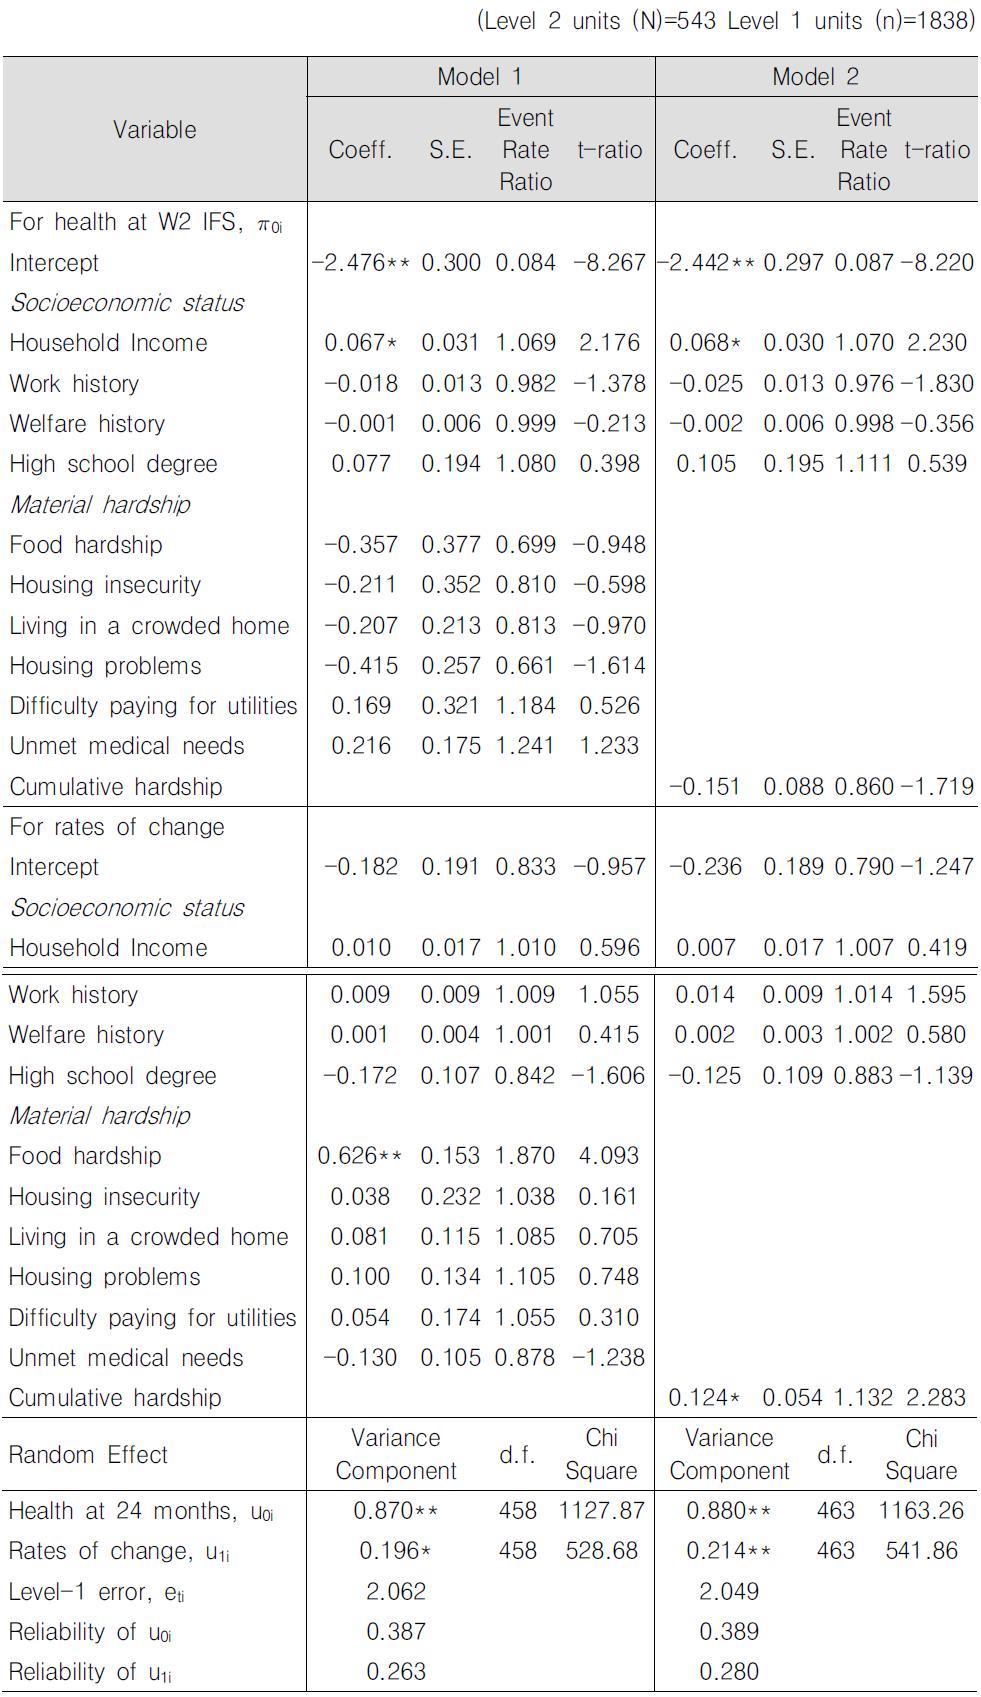
Seven indicators of material hardship across four hardship domains (Model 1) and a cumulative material hardship variable(Model 2) were included in two separate HGLM models to examine the association between material hardship and children’s physical health trajectories.
Controlling for demographic characteristics and socioeconomic status, having a child-any child in the household-with unmet medical needs is significantly associated with the number of sick visits to a health professional per month at W1 IFS-CWB(t=0)(Table 5, Model 1). Holding other variables constant, a child living in a household where children’s medical needs are not met is estimated to have 61.0% more sick visits than a child living in a household with no unmet medical needs. Similarly, a child experiencing housing instability is also found to have 61.3% more sick visits than a child who is not experiencing housing instability(Table 5, Model 1). However, individual indicators of material hardship are not associated with the rates of change for number of sick visits to a health professional at a statistically significant level.
When cumulative material hardship was substituted for individual indicators of material hardship, the findings suggest that cumulative material hardship is positively associated with the number of sick visits to the health professionals at W1 IFS-CWB(t=0) but not with the rates of change(Table 5, Model 2) at a statistically significant level. A child without any hardship is expected to have .08 visits per month to a health care professional at W1 IFS-CWB(t=0), and a child living in a household with all 4 types of material hardship is estimated to have 0.16 visits per month. In other words, the expected number of visits to a health care professional at W1 IFS-CWB(t=0) is estimated to increase by a factor of 0.164 as the number of material hardship increases.
] Fixed and random effects of material hardship on sick visits to health professional trajectories
Fixed and random effects of material hardship on sick visits to health professional trajectories
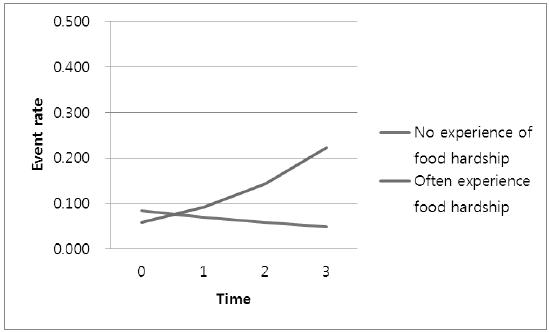
The associations between indicators of material hardship and the trajectory for the number of days a child stayed in bed due to illness are presented in <Table 6>. Indicators of material hardship are not associated with the number of days sick in bed at W1 IFS-CWB(t=0). However, a child’s frequent experience of food hardship is significantly associated with the log event rates of change(Table 6, Model 1). The slope coefficient is greater for a child living in a household where children often experience food hardship compared to a child living in a household without any child food hardship by 0.626 log event rate. As seen in <Figure 1>, a significant increase from an average of 0.059 sick days in bed per month to an average of 0.223 sick days is observed for a child whose household often experience child food hardship while the change observed for a child who did not experience food hardship is statistically insignificant. Similar results are found for cumulative material hardship (Table 6, Model 2). Although cumulative material hardship is not significantly associated with the number of days sick in bed at W1 IFS-CWB(t=0), a unit increase in the number of material hardship increased the slope coefficient by 0.124 log event rate.
The aim of the study is to understand the health trajectories of low-income children and to explore whether indicators of socioeconomic status and material hardship are significantly associated with their health trajectories. Multilevel growth curve analyses were conducted using panel data(4 waves of data for the outcome variable) on a sample of former and current welfare recipients’ children.
Findings from the unconditional models suggest that, on average, the number of sick visits and number of days sick in bed decrease as children grow older. In other words, an improvement in health has been observed. Also, the findings from the study show that, even among children from low-income families, there is wide variation in children’s health trajectories: some children have health trajectories that suggest improved health, some stayed the same, and some suggest declining health.
There is some evidence that material hardship may be associated with variations in children’s physical health trajectories. In this study, six indicators of material hardship representing four domains were used to examine the associations. The findings suggest that the nature of association between material hardship and children’s health trajectories are dependent on the health outcomes. In relation to number of sick visits to health professionals, living in households where children’s medical needs are not being met or households that experience housing instability are associated with greater number of sick visits at the intercept(t=0), but not with the rates of change. Insignificant findings between indicators of material hardship and the rates of change may partly be due to the fact that the variance component for the slope is insignificant after including the basic demographic and socioeconomic status variables.
For the number of sick days in bed trajectory, results show that frequent experiences of child food hardship is found to be positively associated with the rates of change in the number of sick days in bed over time, but not for the number of sick days in bed at the intercept(t=0). In other words, a child who lives in a household with frequent child food hardship may exhibit an increase in the number of sick days in bed as he or she grows older compared to children without child food hardship, who do not exhibit any significant change.
In addition to the individual effects of material hardship, cumulative material hardship is found to be associated with the intercept for the number of sick visits and the rates of change for the number of sick days in bed. For the number of sick visits trajectory, increase in the number of material hardship is found to be positively associated with the number of sick visits to the health professionals at W1 IFS-CWB(t=0), but not with the rates of change. On the other hand, increase in the number of material hardship is positively associated with the slope coefficient for the number of sick days in bed but not with the intercept.
HGLM estimation procedures do not provide standardized coefficients nor model-fit indices to statistically compare whether the individual effects approach better explains the variations in low-income children’s physical health trajectories than the cumulative effects approach. However, when variance components of the two models were compared, the trends suggest that individual effects model explains greater amount of variation in individual’s health trajectory than the cumulative effects model. Moreover, in a separate analysis (results not shown) that examined the cumulative effect of material hardship more conservatively, cumulative material hardship did not explain variations in children’s physical health trajectory above and beyond its individual effects. These findings provide some indication that individual effects of material hardship approach may be better for explaining the variations in low-income children’s physical health trajectory than the cumulative effects approach. However, comparisons between individual and cumulative effects are speculative at this point, thus warrants further investigation in future studies.
The findings also suggest that conventional measures of socioeconomic status may not be effective indicators for examining variations in health trajectories among children from low-income families. Most measures of socioeconomic status are not significantly associated with children’s health trajectories for both health outcomes. The only significant association-between household income and the intercept(t=0) of the number of sick days in bed-is found to be positive, which differs from previous findings. Although further examination is needed, it is possible that the unique characteristics of the sample, which consists of current and former welfare recipients, may provide some explanation to this unexpected study finding. IFS participants who have transitioned from welfare to work and are working full-time may be the ones who are reporting higher incomes in the sample. It may be possible that as women transition from welfare to work and work longer hours, they make work-family tradeoffs to secure higher income for their children(London, Scott, Edin, & Hunter, 2004). As a result, they may have less time to take care of their children, even though they may have the financial means to do so. Further investigation that examines the association between work-family tradeoff and number of sick days in bed is warranted. In addition, factors that caused the caregivers to become welfare recipients aside from income eligibility, such as substance abuse or domestic violence, may still be affecting the health and well-being of children living in these households. However, further investigate is needed to better understand this unexpected association.
There are several limitations of the study. First, the health measures used in this study are all caregiver-reported, proxy measures of children’s health, and do not directly assess children’s physical health. As a result, it is difficult to interpret some of the findings.7) Future research that incorporates more direct and objective measures of children’s health is needed. For example, physical health assessments from multiple informants including parents and pediatricians, health assessment tools that better assess physical functioning and overall quality of life, and diagnoses of acute and chronic conditions may provide a better assessment of children’s physical health. Second, because this analysis placed greater focus on understanding how socioeconomic conditions and material hardships are associated with between-individual differences in children’s physical health, time varying components were not included in the analytical models. However, one could argue that socioeconomic conditions and experiences of material hardship should be treated as time-varying variables. But given that the focus of this paper is to understand individual-level factors associated with the intercept and the slope of children’s physical health trajectories, examining how dynamics of poverty are associated with the dynamics of children’s physical health was beyond the scope of this study. However, this remains to be an important question that needs to be resolved in future studies. Third, there is still a significant amount of variation in children’s health trajectories that is not explained by the analytical models. Further studies need to investigate how other family and child characteristics such as prenatal care, healthy behaviors, lifestyle, parental support, child care, and neighborhood environment explain between-individual differences in health over time.
This study is one of the few studies that investigated the trajectories of children’s physical health using multi-level modeling. Other studies that investigated the trends in children’s physical health across different age groups have mostly relied upon cross-sectional or pooled data, which makes it difficult to separate out actual changes in children’s health from cohort effects. Material hardship variables used in this study have provided better insight into the ways in which social inequalities affect individuals’ physical health over time. For example, the findings illustrate the complexity of understanding the association between children’s experiences of material hardship and physical health. By utilizing individual indicators of material hardship, we were able to discern how each type of material hardship was associated children’s physical health trajectories. We were able to understand how the intensity of the material hardship experiences at Wave 1 of the IFS interview, which was measured through cumulative material hardship, also affected children’s physical health trajectories.
The findings also have implications for social welfare policy and practice. Unique effects of material hardship on children’s physical health trajectories provide support for developing programs to reduce low-income children’s experiences of material hardship. For example, the association between frequent experiences of food hardship and the rates of change for number of days a child spent sick in bed, paired with the child obesity epidemic in the U.S., underscores the importance of effectively implementing programs that secure nutritious meals to low-income children. Significant association between housing instability and the intercept for the number of sick visits highlights the importance of not only providing financial and housing support to families at risk of being homeless, but also providing comprehensive intervention services that monitor and address the health needs of these at-risk children. The significant negative association between unmet health care needs and the intercept for the number of sick visits also highlights the importance of providing adequate care to these children in a timely manner.
It is quite challenging to suggest implications of a study conducted in the U.S. for Korea. Nevertheless, implications of study findings can be tentatively suggested. The findings of this study highlight the importance of conducting longitudinal research that investigates children’s physical health trajectories. Several panel data including ‘Seoul Panel Study of Children’ and ‘Korea Youth Panel Survey’ provides longitudinal information on developmental outcomes of Korean children. However, most of these panel data contain limited information on children’s physical health. Thus, there is a need for future longitudinal studies that examine factors associated with Korean children’s physical health trajectories using comprehensive measures of physical health.
Although further investigation on whether the study findings are similar for Korean low-income children is necessary, significant association between frequent experiences of food hardship and the rates of change for number of sick days in bed suggests the importance of implementing food assistance programs to insure better health for young low-income children. In Korea, expansion of free lunch programs to all children and adolescents in the school system has been a controversial policy issue. However, food assistance to younger children who are not enrolled in schools were not considered in this policy debate. However, considering the age range of the sample children in this study, further development food assistance programs targeted to younger lowincome children can be suggested.
7)Parental reports of children’s physical health can be influenced by other factors such as a child’s past health events, including premature birth, parental assessment of their own health, and family circumstances (Perrin, West, & Culley, 1989; Waters et al., 2000).
참고문헌
1.
Aber J. L., Bennett N. G., Conley D. C., Li J.
1997
“The effects of poverty on child health and development.”
[Annual Review of Public Health]
Vol.18 P.463-483
2.
Adler N. E., Boyce T., Chesney M. A., Cohen S., Folkman S., Kahn R. L.
1994
“Socioeconomic status and health: The challenge of the gradient.”
[American Psychologist]
Vol.49 P.15-24
3.
Alaimo K., Olson C. M., Frongillo E. A. J., Briefel R. R.
2001
“Food insufficiency, family income, and health in U.S. preschool and school-aged children.”
[American Journal of Public Health]
Vol.91 P.781-786
4.
Aldwin C. M., Spiro A., Levenson M. R., Cupertino A. P.
2001
Longitudinal findings from the normative aging study III Personality, individual health trajectories, and mortality.
[Psychology and Aging]
Vol.16 P.450-465
5.
Angel R., Worobey J. L
1988
“Single motherhood and children’s health.”
[Journal of Health and Social Behavior]
Vol.29 P.38-52
6.
Appleyard K., Egeland B., van Dulmen M. H. M., Sroufe L. A.
2005
“When more is not better: the role of cumulative risk in child behavior outcomes.”
[Journal of Child Psychology and Psychiatry]
Vol.46 P.235-245
7.
Beverly S. G.
2000
“Using measures of material hardship to assess well-being.”
[Focus]
Vol.21 P.65-69
8.
Bor W., Najman J. M., Andersen M., Morrison J., Williams G.
1993
“Socioeconomic disadvantage and child morbidity: An Australian longitudinal study.”
[Social Science and Medicine]
Vol.36 P.1053-1061
9.
Case A., Lubotsky D., Paxson C.
2002
“Economic status and health in childhood: The origins of the gradient.”
[The American Economic Review]
Vol.92 P.1308-1334
10.
Casey P. H., Szeto K., Lensing S., Bogle M., Weber J.
2001
Children in food-insufficient, low-income families: Prevalence, health, and nutritional status.
[Archives of Pediatric and Adolescent Medicine]
Vol.155 P.508-514
11.
Chen E., Martin A. D., Matthew K. A.
2006
“Understanding health disparities: The role of race and socioeconomic status in children’s health.”
[American Journal of Public Health]
Vol.96 P.702-708
12.
Chen E., Matthews K. A., Boyce W. T.
2002
“Socioeconomic differences in children’s health: How and why do these relationships change with age?”
[Psychological Bulletin]
Vol.128 P.295-329
13.
Cooper H., Arber S., Smaje C.
1998
Social class or deprivation? Structural factors and children’s limiting longstanding illness in the 1990s.
[Sociology of Health and Illness]
Vol.20 P.289-311
14.
Currie J., Stabile M.
2003
“Socioeconomic status and health: Why is the relationship stronger for older children?”
[American Economic Review]
Vol.95 P.1813-1823
15.
Davidoff A. J., Garrett A. B., Makuc D. M., Schirmer M.
2000
“Medicaid-eligible children who don’t enroll: Health status, access to care, and implications for Medicaid enrollment.”
[Inquiry]
Vol.37 P.203-218
16.
Ernst P., Demissie K., Joseph L., Locher U., Becklake M. R.
1995
“Socioeconomic status and indicators of asthma in children.”
[American Journal of Respiratory Critical Care Medicine]
Vol.152 P.570-575
17.
Evans G., Kim P.
2007
“Childhood poverty and health: Cumulative risk exposure and stress dysregulation.”
[Psychological Science]
Vol.18 P.953-957
18.
Federico M. J., Liu A. H.
2003
“Overcoming childhood asthma disparities of the inner-city poor.”
[Pediatric Clinics of North America]
Vol.50 P.655-675
19.
Flores G., Bauchner H., Feinstein A. R., Nguyen U.-S. D. T.
1999
“The Impact of Ethnicity, Family Income, and Parental Education on Children’s Health and Use of Health Services.”
[American Journal of Public Health]
Vol.89 P.1066-1070
20.
Galobardes B., Lynch J. W., Davey Smith G.
2004
“Childhood socioeconomic circumstances and cause-specific mortality in adulthood: Systematic review and interpretation.”
[Epidemiologic Reviews]
Vol.26 P.7-21
21.
Gutman L. M., Sameroff A. J., Eccles J. S.
2002
“The academic achievement of African American students during early adolescence: An examination of multiple risk, promotive, and protective factors.”
[American Journal of Community Psychology]
Vol.20 P.367-399
22.
Hayward M. D., Gorman B. K.
2004
“The long arm of childhood: The influence of early-life social conditions on men’s mortality.”
[Demography]
Vol.41 P.87-107
23.
Hughes D. C., Ng S.
2003
“Reducing health disparities among children.”
[Future of Children]
Vol.13 P.153-167
24.
Kim D. Y., Sataley F., Curtis G., Buchanan S.
2002
“Relation between housing age, housing value, and childhood blood lead levels in children in Jefferson County, Ky.”
[American Journal of Public Health]
Vol.92 P.769-770
25.
Kwon E.-S., Ku I.-H.
2010
“The effect of poverty on children’s health.”
[Korean Journal of Social Welfare]
Vol.62 P.129-148
26.
Larson K., Halfon N.
2010
“Family income gradients in the health and health care access of US children.”
[Maternal Child Health Journal]
Vol.14 P.332-342
27.
Lee B.-J., Kim S.-S., Kim N-.H.
2010
“An exploratory study on Korean children’s development: The effects of socioeconomic factors and social capital.”
[Journal of Korean Society of Child Welfare]
Vol.31 P.107-141
28.
Lewis D. A., Shook K. L., Stevens A. B., Kleppner P., Lewis J., Riger S.
2000
Work, Welfare, and Well-Being: An Independent Look at Welfare Reform in Illinois. Project Description and First-Year Report.
29.
London A. S., Scott E. K., Edin K., Hunter V.
2004
Welfare reform, work-family tradeoffs, and child well-being.
[Family Relations]
Vol.53 P.148-158
30.
McDonough P., Berglund P.
2003
“Histories of poverty and self-rated health trajectories.”
[Journal of Health and Social Behavior]
Vol.44 P.198-214
31.
Wilkinson R. G., Marmot M.
2006
Social Determinants of Health.
32.
Montgomery L. E., Kiely J. L., Pappas G.
1996
“The effects of poverty, race and family structure on US children’s health: Data from NHIS, 1978 through 1980 and 1989 through 1991.”
[American Journal of Public Health]
Vol.86 P.1401-1405
33.
Newacheck P., Jameson W. J., Halfon N.
1994
“Health status and income: the impact of poverty on child health.”
[Journal of School Health]
Vol.64 P.229-234
34.
Newacheck P., Hughes D. C., Hung Y.-Y., Wong S., Stoddard J. J.
2000
“The unmet health needs of America’s children.”
[Pediatrics]
Vol.105 P.989-997
35.
Nord M., Bickel G.
2002
Measuring Children’s Food Security in U.S. Households, 1995-99.
36.
Olson C. M.
1999
“Nutrition and health outcomes associated with food insecurity and hunger.”
[The Journal of Nutrition]
Vol.129 P.521S-524S
37.
Ouellette T., Burstein N., Long D., Beecroft E.
2004
Measures of Material Hardship: Final Report.
38.
Pak S-.Y., Lee J-.I., Kim H. K.
2007
“Effects of home environmental characteristics on three year-old children’s physical growth.”
[Journal of Korean Society of Child Welfare]
Vol.24 P.91-118
39.
Pak S-.Y., Lee J-.I., Lee S-., J. Kim, H-.K. An, H-. S.
2008
“Effects of home environmental characteristics on current growth status and adult stature estimates of sixth-graders.”
[The Korean Journal of Growth and Development]
Vol.16 P.239-247
40.
Pamuk E., Makuc D., Heck K., Reuben C., Lochner K.
1998
Socioeconomic Status and Health Chartbook.
41.
Perrin E. C., West P. D., Culley B. S.
1989
“Is my child normal yet? Correlates of vulnerability.”
[Pediatrics]
Vol.83 P.355-363
42.
Power C., Mathews S., Manor O.
1998
“Inequalities in self-rated health: explanations from different stages of life.”
[Lancet]
Vol.351 P.1009-14
43.
Price C., Hamilton W., Cook J. C.
1997
Guide to Implementing the Core Food Security Module.
44.
Rafferty Y., Shinn M.
1991
“The impact of homelessness on children.”
[American Psychologist]
Vol.46 P.1170-1179
45.
Raudenbush S. W., Bryk A. S.
2002
Hierarchical Linear Models: Applications and Data Analysis Methods
46.
Sameroff A. J., Seifer R., Barocas R., Zax M., Greenspan S.
1987
“Intelligence quotient scores of 4-year-old children: Social environmental risk factors.”
[Pediatrics]
Vol.79 P.343-350
47.
Luthar S.S., Burack J.A., Cicchetti D., Weisz J., Sameroff A. J., Seifer R., Bartko T.
1997
“Environmental perspective on adaptation during childhood and adolescence.” In Developmental Psychopathology
P.507-526
48.
Schmeer K. K.
2011
“The child health disadvantage of parental cohabitation.”
[Journal of Marriage and Family]
Vol.73 P.181-193
49.
Sharfstein J., Megan S., Kahn R. S., Bauchner H.
2001
“Is child health at risk while families wait for housing vouchers?”
[American Journal of Public Health]
Vol.91 P.1191-1192
50.
Shi L., Stevens G. D.
2005
“Vulnerability and Unmet Health Care Needs: The Influence of Multiple Risk Factors.”
[Journal of General Internal Medicine]
Vol.20 P.148-154
51.
Singer J. D., Willett J. B.
2003
Applied Longitudinal Data Analysis: Modeling Change and Event Occurrence.
52.
Snijders T. A. B., Bosker R. J.
1999
Multilevel Analysis: An Introduction to Basic and Advanced Multilevel Modeling.
53.
Stevens G. D., Shi L.
2003
“Racial and Ethnic Disparities in the Primary Care Experiences of Children:A review of the literature.”
[Medical Care Research and Review]
Vol.60 P.3-30
54.
Szilagyi P. G., Schor E. L.
1998
“The Health of Children.”
[Health Services Research]
Vol.33 P.1001-1039
55.
Thomas S. B.
2001
“The color line: race matters in the elimination of health disparities.”
[American Journal of Public Health]
Vol.91 P.1046-1048
56.
Van der Lucht F., Groothoff J.
1995
“Social inequalities and health among children aged 10-11 in The Netherlands: causes and consequences.”
[Social Science and Medicine]
Vol.40 P.1305-1311
57.
Waters E., Doyle J., Wolfe R., Wright M., Wake M., Salmon L.
2000
“Influence of parental gender and self-reported health and illness on parent-reported child health.”
[Pediatrics]
Vol.106 P.1422-1428
58.
Weathers A., Minkovitz C., O’Campo P., Diener-West M.
2004
“Access to care for children of migratory agricultural workers: Factors associated with unmet need for medical care.”
[Pediatrics]
Vol.113 P.e276-282
59.
Weinick R. M., Weigers M. E., Cohen J. W.
1998
“Children’s health insurance, access to care, and health status: New Findings.”
[Health Affairs]
Vol.17 P.127-136
60.
Weinreb L., Goldberg R., Bassuk E., Perloff J.
1998
“Determinants of health and service use patterns in homeless and low-income housed children.”
[Pediatrics]
Vol.102 P.554-562
61.
Weinreb L., Wehler C., Perloff J., Scott R., Hosmer D., Sagor L.
2002
“Hunger: Its impact on children’s health and mental health.”
[Pediatrics]
Vol.110 P.e41-49
62.
Weitzman M., Byrd R. S., Auinger P.
1999
“Black and white middle class children who have private health insurance in the United States.”
[Pediatrics]
Vol.104 P.151-157
63.
Wickrama K. A. S., Conger R. D., Lorenz F. O., Elder Jr. G. H.
1998
“Parental education and adolescent physical health.”
[Journal of Marriage and the Family]
Vol.60 P.967-978
64.
Wickrama K. A. S., Lorenz F. O., Conger R. D.
1997
“Parental Support and Adolescent Health: A growth curve analysis.”
[Journal of Health and Social Behavior]
Vol.38 P.149-63
65.
Williams D. R.
1999
“Race, socioeconomic status, and health. The added effects of racism and discrimination.”
[Annals of the New York Academy of Sciences]
Vol.896 P.173-188
66.
Wood D. L.
2003
“Effect of child and family poverty on child health in the United States.”
[Pediatrics]
Vol.112 P.707-711
OAK XML 통계
이미지 / 테이블
[
]
[
]
[
]
[
]
[
]
[
]
[
<Table 1>
]
Means for the Measures of Children’s Physical Health, Spanning four waves
[
<Table 2>
]
Descriptive statistics for level-2 variables at Wave 1 IFS (n = 553)
[
<Table 3>
]
Unconditional models from HGLM longitudinal data analysis
[
<Table 4>
]
Estimated fixed and random effects of socioeconomic status and child’s health insurance status on children’s health trajectories
[
<Table 5>
]
Fixed and random effects of material hardship on sick visits to health professional trajectories
[
<Figure 1>
]
Food hardship and number of days sick in bed trajectories
[
<Table 6>
]
Fixed and random effects of material hardship on days sick in bed trajectories