WHY DOES INEQUALITY INCREASE CORRUPTION?
Corruption is commonly defined as “misuse of public office for private gain” (Rose-Ackerman 2008). Corruption takes many forms such as political and bureaucratic corruption, depending on the types of public officials—elected or appointed—that are involved in corrupt acts, and petty and grand corruption, depending on the magnitude of corrupt transactions. Corruption is, by definition, illegal, although one can consider some legal acts and practices corrupt such as political influence of big money and conflict of interests.
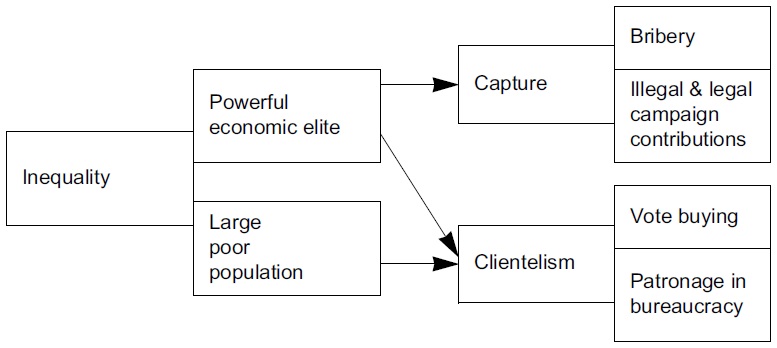
Why does inequality increase corruption? I argue that inequality increases corruption by encouraging capture and clientelism. Capture means that the state or a specific government agency has lost autonomy and serves the special interests of the elite or those that are supposed to be regulated. Although state capture can occur without illegal corruption, for example through legal campaign contributions, capture by the private interests often involves illegal exchange of governmental favors and illegal campaign contributions or personal bribery. In clientelistic political systems, politicians (patron) and voters (client) exchange votes for particularistic benefits. Clientelism is not necessarily illegal or corrupt, but it often involves vote buying and provision of patronage jobs in the public sector in violation of merit rules.
Inequality leads to capture of politics and bureaucracy, which increases political and bureaucratic corruption. Inequality also encourages clientelism, which involves vote buying and patronage appointments in the bureaucracy, and the former increases political corruption and the latter bureaucratic corruption. Figure 1 outlines the causal mechanisms.
First, higher inequality would lead to higher redistributive pressures, which would in turn give the wealthy incentives to capture the state to defend their interests (You and Khagram 2005). In the absence of capture, high inequality should lead to high levels of redistribution, as for example in the MeltzerRichard model (Meltzer and Richard 1981). But in highly-unequal settings, the wealthy have strong incentives to buy political influence and employ corruption to minimize taxation and redistribution. Capture can occur at the highest level of policymaking process as well as at the policy implementation process, encouraging grand political corruption as well as bureaucratic corruption.
Acemoglu and Robinson (2008) proposed a model of “captured democracy,” in which de jure political power of citizens is offset by de facto political power of the elite based on lobbying, bribery, and use of extralegal force. Although they did not discuss the role of inequality in this version of their model, “captured democracy” is more likely at higher levels of inequality because of higher stakes and greater expected returns for the elite from controlling politics. Ziblatt (2009) found that land inequality led to capture of local institutions by landed elites, which in turn led to electoral fraud in the late nineteenth century Germany.
Second, as Robinson and Verdier (2013) argue, clientelism becomes an attractive political strategy in situations of high inequality. Under high levels of inequality, the wealthy elite will not want programmatic politics to develop, because programmatic competition is likely to strengthen leftist parties that will jeopardize their interests. The rich have incentives to develop clientelistic politics as an alternative. Also, high inequality means a large proportion of poor people, and the poor are vulnerable to clientelism (Scott 1972). The poor may be better off by developing programmatic politics, but they usually suffer from collective action problems. It makes perfect sense for poor individuals to engage in clientelistic exchange of their votes with particularistic benefits such as cash, gifts, and patronage jobs in the public sector even if it is collectively irrational.
Vote buying itself is not only a form of petty electoral corruption, but it also increases large-scale political corruption by encouraging politicians to solicit illicit campaign contributions. Moreover, clientelism is likely to protect corrupt politicians, because clientelism converts principal-agent relationship between voters and politicians into patron-client relationship. While programmatic competition will enable voters (principal) to hold corrupt politicians (agent) accountable, under clientelistic competition voters (client) will not be able to punish corrupt politicians (patron).
Clientelism typically increases patronage appointments in the public sector, and the prevalence of patronage in the bureaucracy will increase bureaucratic corruption. Those bureaucrats who have entered the bureaucracy via patronage appointments are less likely to be committed to public interest than those who have become civil servants via open competition on merit. The former are more likely to try to get promotions via patronage or by bribing their bureaucratic bosses and political patrons. They are also more vulnerable to corrupt demands from their political patrons.
Capture and clientelism may be the main reasons why many democracies, especially young democracies, fail to control corruption. These problems are likely to be more serious in countries with higher levels of economic inequality. Also, the effect of inequality on corruption is likely to be stronger in democracies and authoritarian regimes with elections than in hard-authoritarian regimes, because competitive elections and democratic policymaking processes are more vulnerable to clientelism and capture.
1Ideally, the selection of the most-similar cases requires that the chosen cases are similar in all respects except the variables of interest, i.e., the dependent variable (corruption) and the key explanatory variables (inequality). The three countries satisfy this requirement very well (You 2014, forthcoming) for more details.
RELATIVE LEVELS OF CORRUPTION IN KOREA, TAIWAN, AND THE PHILIPPINES
It is not easy to compare corruption across countries. Corruption, by its nature, is conducted secretly, and the probability of exposure will be different in different countries. Most empirical studies of corruption rely on measures of perceived levels of corruption such as Transparency International’s Corruption Perceptions Index (CPI) and Kaufmann, Kraay, and Mastruzzi’s (2010) Control of Corruption scores (CC). The CPI and CC are aggregate indices based on a variety of surveys of mostly business people and ratings by country experts. Because perceptions are subjective and prone to bias, there must be substantial measurement error. Moreover, the definitions of corruption employed by various cross-national measures of perceived corruption are often vague and conceptually different from one another, but most of the measures are highly correlated with one another (Lambsdorff 2008).
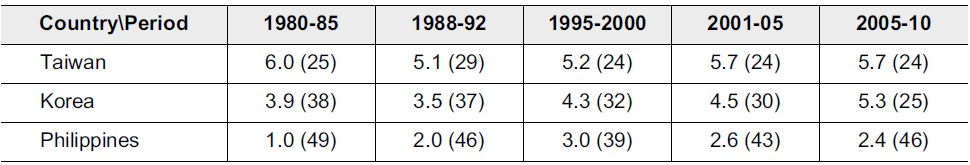
Although Transparency International (TI) has been publishing CPI annually since 1995, it has also published “historical” CPI data for the periods of 1980—1985 and 1988—1992. Table 1 shows the trends of CPI scores and ranks for Korea, Taiwan, and the Philippines from the early 1980s to the present. CPI can vary between 0 (most corrupt) and 10 (least corrupt). The table indicates that Taiwan’s CPI scores have been the highest among the three countries throughout the entire period, those of the Philippines the lowest, and those of Korea in between. Out of 54 countries for which the historical CPI scores are available, Taiwan has consistently ranked among the top performers within developing countries, the Philippines among the worst, and Korea in between, albeit with a trend of gradual improvement.
[Table 1.] Trends of CPI Scores and Ranks (in Parentheses)

Trends of CPI Scores and Ranks (in Parentheses)
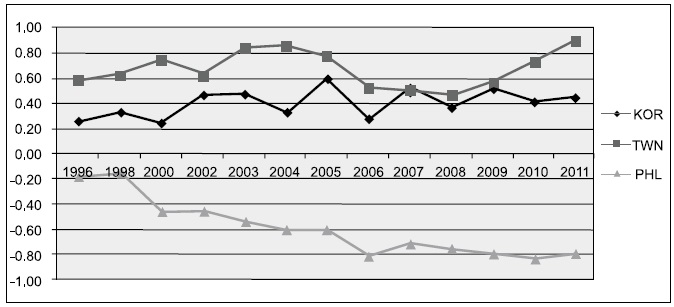
Figure 2 shows the trends in Control of Corruption scores, for Korea, Taiwan, and the Philippines. CC is a standardized score with the mean of zero and the standard deviation of one, and a higher CC value represents a lower level of corruption. The trend of corruption control (CCI) for the Philippines is a deteriorating one, starting from about 0.2 standard deviation below the world mean in 1996 and moving downward to about 0.8 standard deviation below the mean in the recent years. Taiwan’s CCI shows a slight improvement from 1996 to 2004, followed by some deterioration until 2008 and a rebound since then, indicating a trend from about 0.6 standard deviation above the world mean in 1996 to over 0.8 in 2004 to 0.5 in 2008 to 0.9 in 2011. Korea’s CCI score improved from about 0.2 in 1996 to 0.6 in 2005, but it has slightly declined to 0.45 in 2011. The trends of CCI for three countries are roughly similar to those of CPI, with Korea and Taiwan making improvements but with the Philippines showing deterioration in control of corruption.
It is often more useful to look at specific indicators of corruption that are comparable across countries and across time than composite indices of corruption such as CPI and CC. The Executive Opinion Survey of the World Economic Forum has been asking businessmen to choose the biggest obstacle for doing business in each country. In the Philippines, an average of 22.9% of businessmen chose corruption as the biggest problem between 2003 and 2011. In contrast, only 2.4% of Taiwanese businessmen and 5.5% of Korean businessmen did so.
TI’s Global Corruption Barometer Survey has been asking the general public if the respondents or their family members have paid a bribe to public officials during the past year. This survey question is likely to represent the relative frequency of petty bribery. In the Philippines, 17.5% of the respondents on average (between 9% and 32% each year, from 2004 to 2010) admitted paying a bribe to officials, while in Taiwan and Korea the averages were 3.3% and 2.9%, respectively.
Both surveys suggest that the Philippines is among the most corrupt countries in Asia. In terms of business executives’ perceptions on corruption, Taiwan and Korea are slightly behind Singapore and Japan but substantially better than most Asian countries. In terms of petty bribery, Taiwan and Korea are among the best along with Japan, Singapore, and Hong Kong.
All the evidence presented above consistently indicates that Korea has been slightly more corrupt than Taiwan but much less corrupt than the Philippines at least since around 1980. Moreover, these differences antedate the transition to democratic rule. During the period of 1980-1985, all the three countries were under authoritarian regimes. CPI 1980 1985 finds that the authoritarian regime of Marcos (1972-1986) was perceived to be extremely corrupt, while that of Chiang Ching-kuo (1975-1987) was relatively clean and that of Chun Doo-hwan (1980-1987) in between the other two.
Unfortunately, there are no available quantitative measures of corruption comparable across these countries for an earlier period. However, there is evidence that there was rampant corruption in all three countries in the early post-independence period. Corruption and looting were so common under the Chinese military government after the liberation from Japanese rule in 1945 that Taiwanese revolted in a popular uprising, known as the “February 28 Incident,” in 1947. It is well known that corruption was widespread under Korea’s first president Syngman Rhee (1948-1960), who had to resign as president after large student demonstrations against the election rigging and corruption of the regime, known as the “April 19 Student Revolution,” in 1960.
This suggests that Korea and Taiwan made substantial improvement in control of corruption over time,2 while the Philippines failed to make improvement or even deteriorated throughout the post-independence period. It is clear that both Korea and Taiwan have been significantly less corrupt than the Philippines at least since the early 1980s, and probably from much earlier, although they were all similarly corrupt at the time of independence. Also, Korea and Taiwan have made further improvement over the last decades after the democratic transition, but the Philippines has shown the opposite trend. The main purpose of this study is to ask what caused this difference.
2I do not mean that Korea and Taiwan did not suffer from corruption. Although corruption has improved overall in both countries, the collusion between the chaebol (family-controlled conglomerates) and the political elite has become an increasingly serious problem in Korea and so-called blackgold politics and the properties of the KMT became salient political issues in Taiwan.
Why have Korea and Taiwan been much less corrupt than the Philippines? Although inequality of income and wealth is closely correlated with the relative levels of corruption in these countries, it is worthwhile to consider the explanatory force of several other factors that have been advanced in the literature, including economic development, democracy, government intervention, Protestantism, Confucianism, and ethnic homogeneity. None appears to provide a convincing explanation of the three cases in question.
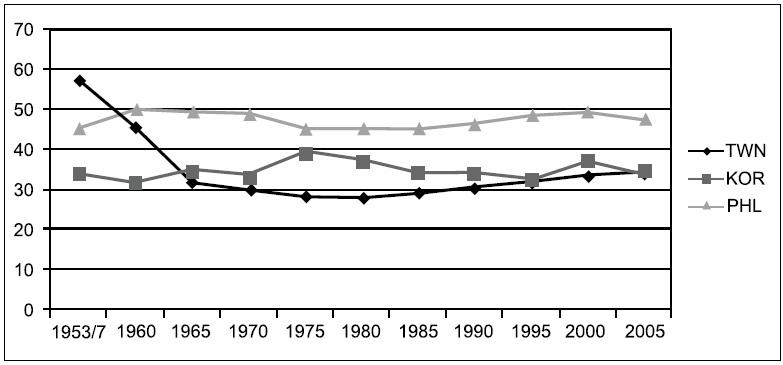
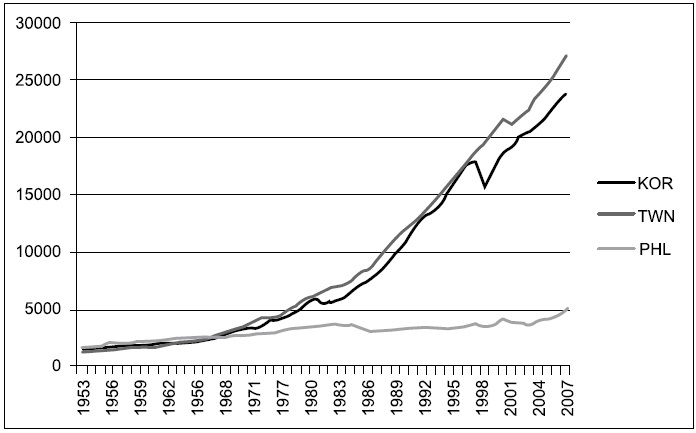
The level of economic development (per capita income) has been found by many empirical studies to have significant effects on corruption; in short, more developed countries are generally less corrupt (Lambsdorff 2005; Treisman 2007). Figure 3 indicates, however, the Philippines was initially more developed than either Korea or Taiwan; it was only surpassed by them in the late 1960s. Considering that the Philippines’ higher corruption appears to have started much earlier than 1980, it is more likely that different levels of corruption explain the variations in economic growth in these countries rather than the other way around (Kaufmann and Kraay 2002).
Although democracy provides checks against corruption, democratic elections are not invariably a cure for corruption (Rose-Ackerman 1999). Montinola and Jackman (2002) demonstrate that partial democratization may increase corruption, but that once past a threshold, democracy inhibits corruption. Treisman (2007) also finds long-established democracies are significantly less corrupt. On the other hand, some scholars and politicians, notably Lee Kwan Yew, former Prime Minister of Singapore, have argued that authoritarian regimes are superior to democracies in controlling corruption and achieving economic growth (Zakaria 1994).
Both Korea and the Philippines initially had some degree of formal democracy until 1972 (except for 1961-1963 in Korea), and had dramatic democratic transitions in 1986 (the Philippines) and 1987 (Korea) through “people power” movements. Taiwan had an authoritarian regime for a long time and experienced a gradual democratic transition during the late 1980s. Among the three countries, Taiwan used to be the least democratic until the early 1990s, but also the least corrupt. This seems to support the argument of Lee Kwan Yew. However, corruption has decreased since the democratic transition, especially since the mid-1990s, in Korea and Taiwan. Also, Marcos’s Martial Law regime (1972-1986) is known as a period of the most egregious corruption in the history of the Philippines. Thus, there is no simple relationship between democracy and corruption among these three countries.
The degree of government intervention in the economy, which is often measured as the size of government, or the proportion of government expenditure over GDP, is also regarded as a cause of corruption, because it can create rents and encourage rent-seeking activities. The share of government in real GDP was lower in the Philippines, with an average of 12.7% between 1953 and 1970, than in the other two countries, with an average of 20.9% in Korea and 25.2% in Taiwan during the same period, according to data from Heston, Summers, and Aten (2009). However, the level of corruption was not lower, but higher in the Philippines.3
Ethno-linguistic fractionalization has been found to be positively correlated with corruption, although its significance disappears after per capita income and latitude controls are added (Mauro 1995; La Porta et al. 1999). Ethno-linguistic diversity may partly explain high level of corruption in the Philippines, considering that Chinese-Filipino businessmen tended to bribe government officials and provide politicians with illicit campaign contributions to avoid discriminatory treatment in doing business (Wurfel 1988). However, Korea has an extremely high level of homogeneity both ethnically and linguistically, but corruption used to be somewhat higher in Korea than in ethnically and linguistically heterogeneous Taiwan. Thus the ethno-linguistic story does not seem to work well either.
Protestantism has been found by many cross-country studies to be associated significantly with less corruption (La Porta et al. 1999; Paldam 2001). On the other hand, “Confucian familism” has often been accused of fostering patrimony, nepotism, social distrust, and bribes or gift exchanges (Fukuyama 1995; Kim 1999). But Korea has had a much larger Protestant population than Taiwan, and Korea used to be slightly more corrupt than Taiwan. Confucian tradition is very strong in Korea and Taiwan, while it is absent in the Philippines, but Korea and Taiwan are much less corrupt than the Philippines. There is no obvious link between religion and corruption in the three cases.
Income inequality is one of the several variables reviewed here that is correctly correlated with the relative levels of corruption among these three countries. Figure 4 presents the trends of income inequality (Gini index) in the three countries. It is clear that income inequality in the Philippines has been much higher than that in Korea and Taiwan at least since around 1960. Between Korea and Taiwan, Korea seems to have had slightly higher level of inequality, especially during the 1970s and 1980s.
Table 2 summarizes the discussion so far. None of the conventionally recognized causes of corruption, except for inequality, is correctly correlated with the level of corruption across the three countries under consideration here. However, correlation does not mean causation. In order to sort out the causal direction and mechanisms, it is necessary to trace how the three countries came to have different degrees of income inequality. Land reform played a major role in this regard.
[Table 2.] Predictive Ability of Possible Causes of Corruption
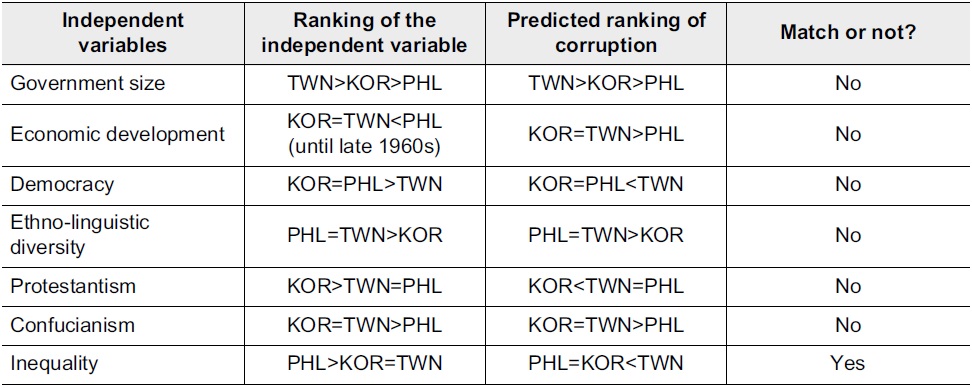
Predictive Ability of Possible Causes of Corruption
3One can certainly object to using the size of government as a measure of government intervention, but scholars generally agree that governments in Korea and Taiwan heavily intervened in the economy while the role of the Philippine state was not large (Wurfel 1988).
SUCCESS AND FAILURE OF LAND REFORM
One plausible explanation for different levels of income inequality between Korea and Taiwan on the one hand and the Philippines on the other hand is land reform (Lie 1998; Rodrik 1995; You 1998). Land reform was successful in Korea, Taiwan, and Japan after World War II, but failed in the Philippines. Hence, it is plausible that success and failure of land reform produced different levels of inequality, which in turn affected corruption. However, it is also possible that different levels of corruption determined the fate of land reform, and hence produced different levels of inequality. My comparative historical investigation shows that success and failure of land reform was little affected by corruption but largely determined by exogenous factors such as external communist threats and U.S. pressures.
When Korea was liberated from Japanese colonial rule in 1945, it was primarily an agricultural economy with few landlords and a vast number of peasants. The richest 2.7% of rural households owned two thirds of all the cultivated lands, while 58% owned no land at all. By 1956, however, the top 6% owned only 18% of the cultivated lands. Tenancy dropped from 49% to 7% of all farming households, and the area of cultivated land under tenancy fell from 65% to 18% (Ban, Moon, and Perkins 1980; Lie 1998).
Land reform in South Korea was carried out in two stages: by the American Military Government (AMG) in 1948 and by the South Korean government from 1950 to 1952. In March 1948, the AMG began to distribute 240,000 hectares of former Japanese lands to former tenants, which accounted for 11.7% of total cultivated land. After two separate governments were formally established in the southern and northern parts of Korea in 1948, the government of South Korea began to implement agrarian land reform in 1950, just before the Korean War broke out. Restricting the upper ceiling of landownership to three hectares, the government redistributed 330,000 hectares of farmland by 1952. In addition, about 500,000 hectares were sold directly by landlords to their tenants. Thus, 52% of total cultivated land transferred ownership, and the “principle of land to tillers” was realized (Ban et al. 1980; Chun 2001; Kim 2001).
In Taiwan, land reform was also carried out in three stages. First, in 1949, farms rents were reduced to 37.5% from the previous 50% or over. Secondly, arable public lands were sold to tenant farmers over a ten-year period from 1948 to 1958. Thirdly, in 1953, land-to-the-tiller program, or the compulsory sale of land by landlords, was launched. Absentee ownership was abolished, and a low ceiling was imposed on land that could be retained by landlords. The proportion of tenant farmers in farm families fell from 38% in 1950 to 15% in 1960, and the proportion of land cultivated by tenants fell from 44% in 1948 to 14% in 1959 (Fei, Ranis, and Kuo 1979).
Almost all Filipino presidential candidates since the 1950s have run on platforms promising land reform, but reform has seldom been pursued with vigor (Kang 2002). The initial discussion of land reform under the Quirino government (1948-1953) collapsed, and President Magsaysay’s moderate proposal of land reform legislation was amended by Congress so that most of the large estates could easily avoid expropriation. The Land Reform Act of 1955 placed only 2% of the nation’s agricultural land subject to redistribution, and the government acquired less than 0.4% of the total farm areas in the first six years of the program. Magsaysay’s tenancy-reform proposal that would have transformed share tenants into leasehold (“fixed” rent) tenants was also watered down (Putzel 1992; Riedinger 1995).
Marcos’s land reform sounded ambitious at first. Presidential Decree 27 of 1972 allowed tenants of rice and corn land whose landlords held more than seven hectares to purchase the parcels they tilled. However, implementation was slow and minimal. Prior to the Aquino administration, only 4% of the country’s cultivated lands were acquired, and the number of beneficiary families was just 6-8% of those landless nationwide in 1985 (Riedinger 1995). The Filipinos did not see any meaningful implementation of land reform until the limited, but substantial compared to previous attempts, reform was carried out by the Aquino and Ramos governments.
Table 3 demonstrates how much the success and failure of land reform made a difference in the distribution of land ownership in the three countries. The land gini fell sharply in Korea and Taiwan, but not in the Philippines. In Korea and Taiwan, large landlords disappeared and tenancy fell dramatically. In the Philippines, however, landless families represented 50-64% of the agricultural population as of 1980 (Riedinger 1995).
[Table 3.] The Trends of Land Gini
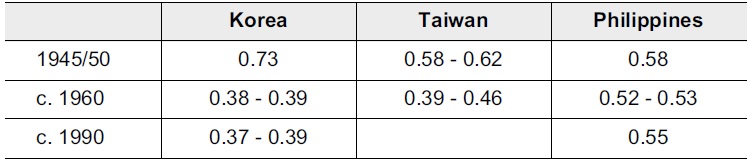
The Trends of Land Gini
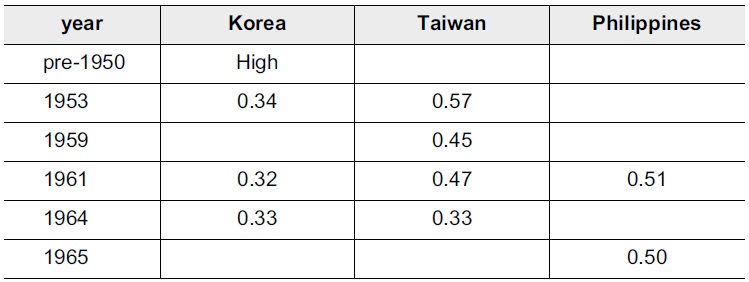
In Korea and Taiwan, land reform helped to reduce income inequality remarkably. Table 4 shows that a dramatic improvement in income distribution took place in Taiwan from an income gini of 0.57 in 1953, when it began implementing the land-to-the-tiller program, to 0.33 in 1964. Although income distribution data is unavailable for Korea’s pre-reform period, inequality must have been very high. According to an analysis by Ban, Moon, and Perkins (1980) the top 4% of the rural population (previous landlords) lost 80% of their income, while the bottom 80% (tenants and owner-tenants) increased their income by 20-30% because of land reform. After the reform Korea showed an unusually equal distribution of income with a gini of 0.34 in 1953. Note, however, income inequality remained high in the Philippines with gini of 0.51 in 1961 and 0.50 in 1965.
[Table 4.] The Trends of Income Gini

The Trends of Income Gini
Why, then, did Korea and Taiwan carry out extensive land reform early after independence, whereas the Philippines did not? Was it corruption or other exogenous factors that determined the fate of land reform? I offer three explanations. The threats from North Korea and Communist China played a major role in promoting land reform in South Korea and Taiwan, respectively. The role of the United States in land reform was important and progressive in South Korea and Taiwan, but largely conservative in the Philippines (Putzel 1992). In addition, the political influence of the landed class was stronger in the Philippines, while the landlords in Korea and Taiwan lost their influence after independence because of their collaboration with the Japanese.
An overview of the decision-making and implementation processes within the U.S. State Department and the American Military Government (AMG) in Korea and within Rhee’s government reveals that the communist threat and political competition with North Korea to win the support of peasants played a decisive role in pushing for a progressive reform program. There was a debate between the liberals and conservatives within the U.S. State Department about land reform in Japan and Korea, and the liberal approach won the debate (Putzel 1992).
When the first election was held for the Republic of Korea in the South in 1948, all parties pledged to implement land reform and the Constitution included a commitment to land reform. Because of communist threats from North Korea, which carried out radical land reform in 1946, even the rightist leaders tried to appeal to peasants with the promise of land redistribution. The Korea Democratic Party (KDP) that represented the interests of landlords did not openly object to land reform, but only tried to delay the implementation of the reform and to increase the compensation for the landlords. President Syngman Rhee, a strong anti-communist politician, appointed Cho Bong-am, a former communist, as Minister of Agriculture, and he drafted a progressive land reform bill with compensation of 150% of annual produce. Although the KDP members attempted to increase the compensation to 300%, the Assembly passed the Land Reform Act with 150% of compensation and payment on February 2, 1950, and President Rhee signed it into law on March 10, 1950 (Kim 2001).
An interesting phenomenon in Korea’s land reform was that many landlords sold their land directly to their tenants before the land reform legislation was implemented. The total area sold by landlords (500,000 hectares) exceeded the area of land redistributed by the government (330,000 hectares), and the bulk of the sell-out occurred in 1948 and 1949 when the prospect of land reform was clear (Hong 2001).
Taiwan’s case also demonstrates the important role of Communist China and the liberal reformers of the U.S. State Department. When Chiang Kai-shek was defeated by Mao Tse-tung’s agrarian revolution on the Chinese mainland, some 2 million predominantly military and bureaucratic refugees fled to Taiwan. Chiang’s corrupt and conservative Kuomintang (KMT) in mainland China transformed itself into a more coherent and autonomous party-state in Taiwan and embraced land reform, apparently having been taught a bitter lesson from its failure (Evans 1995). The United States also advocated progressive agrarian reform to counter communism, and the U.S. advisors worked closely with KMT officials in Taiwan (Putzel 1992).
In the Philippines, the politics of land reform were more complex. During the U.S. colonial period (1898-1941), the Americans established close governing relationships with the Philippine landed elite. After the Philippines gained independence in 1946, the United States still exerted considerable political influence. In the absence of external communist threat, however, the United States did not feel urgency to press for land reform in the Philippines. It was not until 1951 that the U.S. Mutual Security Agency commissioned Robert Hardie to study the tenancy problem in the Philippines, because of growing concern over the rise of an armed peasant movement led by the Huks. Hardie’s report released in December 1952 contained far-reaching, comprehensive land reform proposals such as distributing land to 70% of the tenants in the country (Putzel 1992).
The landlords and their representatives in Congress strongly resisted, however, and President Quirino called the Hardie Report a “national insult.” In 1953, Hardie was replaced by John Cooper. Cooper suggested that only minor reforms were necessary in his report in 1954. As the Huks’ rebellion was suppressed, the U.S. approach to land reform changed to a conservative direction. The rise of McCarthyism further conservatized the U.S. position on land reform (Putzel 1992). Once the U.S. pressure for progressive land reform subsided, the landed oligarchy was easily able to preserve their economic base through their representatives in Congress (Doronila 1992).
The failure of land reform in the Philippines reflects the endogenous nature of U.S. relations with the Philippine landed elite as well as domestic politics. However, the crucial distinction between Korea and Taiwan on the one hand and the Philippines on the other hand was in the existence or absence of external communist threats. Also, there was rampant corruption in all three countries in the early years of independence. Thus it was not corruption but external communist threats that appear to have determined the success and failure of land reform.
CONSEQUENCES OF FAILED LAND REFORM ON CORRUPTION IN THE PHILIPPINES
Consistent with the proposition that high inequality encourages capture and clientelism, high inequality in the Philippines led to state capture by the landed elite and endemic practices of clientelism. The failure of land reform in the Philippines helped the landed oligarchy to maintain and further expand their economic power by diversifying to commerce, manufacturing, and finance (Wurfel 1988). The landed oligarchy not only accumulated economic wealth but also political power since patron-client relationship between landlords and tenants could easily be utilized for mobilization of votes. Studies found that the Philippine legislator was typically a member of a wealthy landlord family and that the proportion of congressmen and senators with very wealthy family backgrounds increased between 1946 and 1962 (Abueva 1965; Stauffer 1966).4 Public officeholding branches of a family frequently helped protect or channel favors to the family business.
High inequality in income and wealth produced redistributive demands, but it also increased the incentives of the wealthy to capture the state on issues that went far beyond blocking of land reform. There is ample evidence on how the economic policy machinery was routinely hijacked by the powerful landed and business elites (MacIntyre 1994). This made it difficult to implement any economic policies coherently.
An example is the political economy of taxation. High income inequality created demand for progressive taxation and marginal income tax rates were high. But collection rates were very low. The corporate tax code was riddled with special exemptions (Haggard 1990b). A study of tax burden by income class revealed the regressiveness of the Philippine taxation. In 1960, families with an annual income of less than 500 pesos paid 23% of that income in taxes, mostly indirect, whereas families with income between 5,000 pesos and 10,000 pesos paid less than 15%. Potential taxpayers in the upper brackets found it easy to buy their way out of a heavy assessment, either by bribing the tax collector or by making a campaign contribution to his patron, usually in Congress (Wurfel 1988).
In addition to these examples of capture, postwar Philippine politics has been characterized by the persistence and prevalence of clientelism. Although elections were dominated by two political parties until 1972, the parties were merely shifting coalitions held together by patron-client relationships extending from prominent families in each province through lesser gentry in towns, petty leaders in villages, and down to the common people. Indeed, clientelism was an attractive strategy for the elite in the highly unequal Philippines. The power elite in both parties showed their common interest in suppressing programmatic politics and maintaining clientelistic competition when they unseated six congressional seats won by the progressive Democratic Alliance in 1946. The Democratic Alliance had advocated for progressive land reform, but disbanded in 1947 facing military repression (Montinola 2012; Thompson 1995). In addition, the large proportion of poor people was prone to clientelism. Traditional patron-client relationships based on deferential exchange of favors weakened over time, and they were replaced by a system of exchange of electoral support for particularistic material benefits. Exchange of public sector jobs for votes as well as direct vote-buying became increasingly widespread (Lande 1965).
The landed elite also exerted influence, through congressmen, on bureaucratic recruitment. The Philippine constitution stipulated that appointment to the civil service be made on merit alone, “to be determined as far as practicable by competitive examination.” According to a Filipino political scientist, however, the pattern had been set by the early years of independence; “bureau directors and division chiefs received appropriations from the legislature in exchange for appointing friends, relatives, and needy constituents of congressmen” (Wurfel 1988, 78-79). Personal contacts and clientelistic exchanges of jobs for votes, became increasingly important for entrance into the central bureaucracy, and the role of competitive exams became relatively marginal. The spoils system developed to the extent that a scandalous “50-50 Agreement” between the Congress and Presidential Palace was reached surrounding the bureaucratic appointments in 1958. Under the agreement, newly available positions would be divided equally between the president and the congress (Francisco and De Guzman 1963). Although the “50-50 Agreement” collapsed because of wide criticism and resistance from the Senate, it was tried again in 1967.5
A survey of higher civil servants indicated the upward trend of patronage appointments in the early postwar period (Francisco 1960). The percentage of those who had entered the civil service through competitive civil service examination was 37.7% among the older cohort (over 45 years of age) and 26.0% among the younger cohort (45 years of age or less). The percentage entering through oral interviews, without examination, was much higher among the younger (48.1%) than among the older bureaucrats (34.7%). Thus, the Philippine state failed to develop an autonomous and meritocratic bureaucracy and came to be characterized as a “patrimonial oligarchic state” (Hutchcroft 1998).
The prevalence of patronage appointments in the bureaucracy increased bureaucratic corruption. Many patronage jobs were temporary positions, and hence their continued employment was tied to the continued support of their patrons. Corruption was often employed as one way of rewarding their patrons and intermediaries directly or as a means of securing money and gifts for them. The bureaucrats employed by patronage were also vulnerable to their patrons’ request for favors in policy implementation and in raising illicit campaign contributions to their political patrons (Hodder 2009). In a 1971 survey of bureaucrats, two thirds of respondents admitted widespread corruption in the bureaucracy (Montinola 1999).
In addition to exchanges of jobs for votes, direct vote-buying practices became increasingly common. The price of a vote varied a lot, but it rose steadily everywhere, often reaching as much as the daily wage. By one estimate, vote buying involved perhaps one-fourth of the electorate in the 1960s. As a result, Filipino elections were among the world’s most costly. In 1961, by one calculation, candidate spent per voter 1.6% of per capita national income. The total campaign expenditures for all candidates were equivalent to 13% of the national budget of that year. In the eight-year interval between the election of President Magsasay in 1953 and the victory of President Macapagal in 1961, presidential campaign expenditure rose more than tenfold. Election costs for all candidates in 1969 were estimated to be nearly 1 billion pesos, almost one-fourth of the national budget for that year and nearly twice the percentage in 1961 (Wurfel 1988). Not surprisingly, rapidly rising campaign spending led to increasing political corruption.
Once the vicious cycle of high inequality-high corruption was in place, it continued through the Martial Law regime of Marcos (1972-1986) and through democratically elected governments (1986-present). In 1972, Marcos declared martial law with promises of land reform and anti-corruption reform. Promised reforms did not materialize, however, and the Philippines became an archetype of the “predatory state.” Apparently, he found it easier to maintain his authoritarian regime by making a coalition with the powerful landed-industrial elite and dispensing favors to his cronies than by implementing genuine reforms.
The dramatic democratic transition through “People Power” in 1986 created high hopes for anti-corruption reform. Initially high expectations, however, were quickly followed by disappointments. With democratization, traditional elite families returned to dominate Philippine politics with the old style of capture and clientelism. Of the 200 representatives elected in 1987, 169 (nearly 85%) were classified as belonging to “traditional clans” (Mojares 1993). The dominance of politically powerful clans, or political dynasties, continued in later elections. Most post-Marcos representatives have multiple business interests, and only a small percentage of representatives (17% in the 9th House, 15% in the 11th House, and 17% in the 12th House) had no business interests (Coronel et al. 2004).
With continuing clientelism, patronage appointments are not declining, either. Evidence indicates that the share of CES eligibles occupying CES positions has been declining, which implies that political appointments have been increasing (Monsod 2008/2009). The powerful oligarchic business elite still extract privilege from a largely incoherent bureaucracy (Hutchcroft 1998).
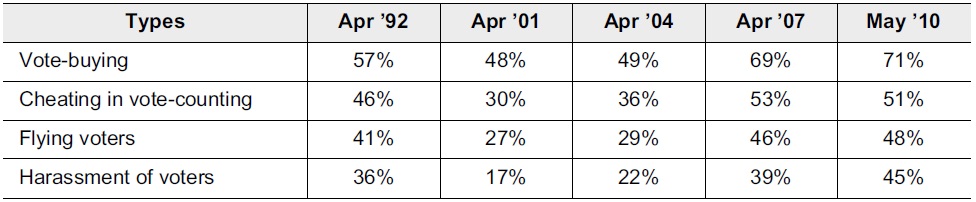
Under conditions of high inequality and widespread poverty in the Philippines, clientelistic practices are continuing and democratic mechanisms of accountability are not working. Around 90% of the Filipinos still consider themselves poor, and they are much more likely to sell their votes than the rich and the middle class according to a survey (Schaffer 2007).6 Programmatic party competition has not developed, and vote-buying practices are still common. Table 5 shows increasing perceptions of vote buying and cheating in elections in the Philippines. The proportion of people who expected vote-buying in elections slightly decreased from 57% in 1992 to 48% in 2001, but it increased again to 71% in 2010. Expectations of other election irregularities have been increasing as well.
[Table 5.] Pre-Election Expectations of Election Irregularities in the Philippines

Pre-Election Expectations of Election Irregularities in the Philippines
Clientelistic politics prohibit the Philippine voters from punishing corrupt politicians at polls. Although people power II forced a corrupt president, “Erap” Estrada (1998-2001), to resign in 2001, the Filipinos found his successor Gloria Arroyo (2001-2010) even more corrupt. She was reelected in 2004 despite her notorious reputation for corruption amongst accusations of large-scale electoral fraud. She was able to survive the impeachment attempts only by relying on her clientelistic networks and “people power fatigue.” While the 2010 elections produced election of reform-coalition-backed Benigno Aquino III as president, his electoral victory was accompanied by disturbing elections of Imelda Marcos, Gloria Arroyo, a rapist, a cult group leader, and a warlord as members of the House, Ferdinand Marcos Jr. as a member of the Senate, and Imee Marcos, the late dictator’s daughter, as governor of Ilocos Norte. These politicians had no problem employing clientelism in order to obtain sufficient votes.
Throughout the post-war history, Philippine presidents made various anti-corruption pledges and established various anti-corruption agencies. Today, the Philippines has a large stockpile of anti-corruption laws and jurisprudence and one of the biggest number of anti-corruption bodies and audit institutions: 17 agencies led by the Office of Ombudsman and the special anti-corruption court, Sandiganbayan. The problem is not the lack of anti-corruption laws and agencies but the lack of political incentives to fight against corruption and ineffective enforcement. A study shows that out of nearly 80,000 cases of corruption, bribery, and other cases brought to the Ombudsman and Sandiganbayan from 1979-2006, there were only 27 meaningful convictions handed down, a dismal record of 27 convictions in 27 years (CenPeg 2007). Since the Philippine presidents relied on clientelistic networks, which were maintained by huge resources financed largely through corrupt means, their political will to combat corruption was weak and anti-corruption reforms were mere rhetoric without rigorous enforcement.
4Stauffer (1966) found that the proportion of House representatives with a very wealthy family background increased from 21.5% in 1946 to 49.9% in 1962, and the same proportion for senators increased from 45.8% to 70.8% over the same period. 5Patronage jobs were less crucial to senators with a nationwide electoral district than to House representatives. 6According to a survey conducted in 2001 in the Philippines, among the respondents who were offered money for votes, 68% of the moderately poor (58-73% of the population) and 75% of the very poor people (18-32% of the population) accepted the offer, compared to 38% of the middle class and the rich (7-11 percent of the population) who did so (Schaffer 2007).
CONSEQUENCES OF LAND REFORM ON CORRUPTION CONTROL IN KOREA AND TAIWAN
In Korea and Taiwan, land reform opened space for state autonomy from the dominant class because powerful landed elites disappeared. Both Korea and Taiwan were able to establish meritocratic and autonomous bureaucracies, which were largely free from capture and penetration by special interests. Political clientelism and vote buying practices existed in Korea and Taiwan, but programmatic politics developed over time and clientelism gradually receded in significance.
In Korea, the leveling effect of land reform was further intensified by the Korean War (1950-1953). The war destroyed a substantial share of industrial and commercial properties. The complete dissolution of the landed elite and the rapid expansion of education created an unusually egalitarian society with high social mobility. As land reform made education affordable to more people, enrollment in primary, secondary, and tertiary education increased twice, eight times, and ten times, respectively, in ten years (Kwon 1984).
It is true that Korean chaebols, or family-controlled conglomerates, grew over time and economic concentration by chaebols and collusion between government and business increased until the financial crisis of 1997. This may partly explain Korea’s higher corruption than Taiwan’s. There were important differences from the Philippine case, however. Korean chaebols were small until the 1960s, although their size and market power grew with the export-led industrialization that started in the mid-1960s and the heavy and chemical industries drive during the 1970s. Even though chaebols’ economic power grew exponentially in the 1970s and 1980s, they still did not have the direct political influence visible in the Philippines. Their relatively humble social origin is also contrasted with the Philippine conglomerates, which are largely from wealthy landlord families. As of 1985, about 38% of the top fifty chaebol owners came from poor farm families or small merchant families, and only one-quarter originated from the landlord or big-business families (Koo 2007; Jones and Sakong 1980). In addition, despite growth of the chaebol, overall income inequality did not increase substantially.
There was considerable corruption between the incipient chaebols and the political elite starting from the 1950s. The sale of vested properties, formerly Japanese-owned industrial properties, typically favored the politically well-connected as well as interim plant managers. The Rhee government set the price of the properties much lower than the market value and offered the new owners generous installment plans. In return for their windfall gains, the new owners of these properties provided kickbacks to Rhee’s Liberal Party. Vested properties provided the initial base for many chaebols (Lim 2003). The import substitution industrialization policy pursued by the Rhee government also provided opportunities for corruption and rent-seeking as in the Philippines.
Creation and distribution of rents was common not only under Syngman Rhee’s regime, but also under Park Chung-hee and Chun Doo-hwan’s rule. Under Park Chung-hee and Chun Doo-hwan, the most important forms of rents were allocation of low-interest-rate domestic and foreign loans. The government favored chaebol firms and exporters in the distribution of rents in return for their political contributions and export performance, and often protected their monopoly by restricting entry of other firms in specific industries.
There were substantial differences in the importance of rent-seeking and patronage between import substitution and export-oriented industrialization strategies, however. Under an import substitution policy, government protection and favors were decisive for the profitability of businesses. Under an export-oriented policy, however, firms had to compete in foreign markets. Although various forms of favors and subsidies helped the firms to compete in foreign markets, productivity and competitiveness became increasingly important. In order to promote exports, the government had to discipline the chaebols with favors based on export performance rather than clientelistic criteria. The transition from import substitution to export-oriented industrialization as well as implementation of coherent EOI policies did not face much resistance from the vested interests because of their political weakness when compared to the Philippines (Mo and Weingast 2013).
The absence of powerful economic interests also provided favorable conditions for the establishment of a meritocratic and coherent bureaucracy in Korea. Korea’s meritocratic bureaucracy was not established overnight but developed gradually over time. Previous developmental state literature is misleading by erroneously contrasting Syngman Rhee’s reliance on patronage and Park’s establishment of a meritocracy in bureaucratic recruitment (for example, Kim 1987; Evans 1995). By 1960, about 80% of high-level civil servants, including Grade II (director general), Grade III-A (director), and Grade III-B (section chief), had been promoted from within the bureaucracy (Bark 1961; Kang 2002). New appointments at the Grade III-B level were increasingly recruited through highly competitive higher civil service examination (
[Table 6.] Modes of New Recruitment at the Grade III-B in Korea
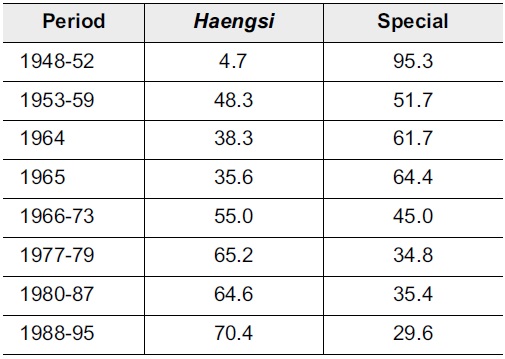
Modes of New Recruitment at the Grade III-B in Korea
When the new state was established in 1948, it needed to recruit a large number of civil servants and it was inevitable to recruit the bulk of them from among the Korean officials of the American Military Government (1945-1948), many of whom had been officials of the Japanese colonial government. It was hard to recruit a large number of officials through
In addition, civil service examinations for Grade V-B (lowest level) were first administered in 1960 after the April 19 Student Revolution. The short-lived democratic government led by Prime Minister Chang Myon felt pressure from university students, and the government tried to absorb them through civil service examinations (Lee 1996). Thus, meritocracy in bureaucratic recruitment and promotion developed through the late years of Rhee (1953-1960), Chang (1960-1961), Park (1961-1979), and post-Park periods. Although there were patronage appointments, the demand for patronage jobs was not as great as in the Philippines.7
The gradual development of a meritocratic bureaucracy led to a gradual improvement in control of bureaucratic corruption. Table 7 shows that the annual number of public officials indicted for corruption (bribery and embezzlement) was roughly constant from the 1950s through the 2000s except for a slight decline in the 1980s and a surge in the 1990s. But it is important to control for the size of bureaucracy as well as the overall effectiveness of prosecution. The ratio of the number of public officials indicted for corruption to the number of all people indicted for any crime (Ratio A) has steadily declined over time from 0.2% in the 1950s to 0.02% in the 2000s. The ratio of the number of public officials indicted for corruption to the number of public officials indicted for any crime (Ratio B) has also steadily declined from 36.8% in the 1950s to 4.0% in the 2000s. This indicates that bureaucratic corruption has steadily and gradually declined in Korea.
[Table 7.] The Trend of Public Officials Indicted for Corruption in Korea
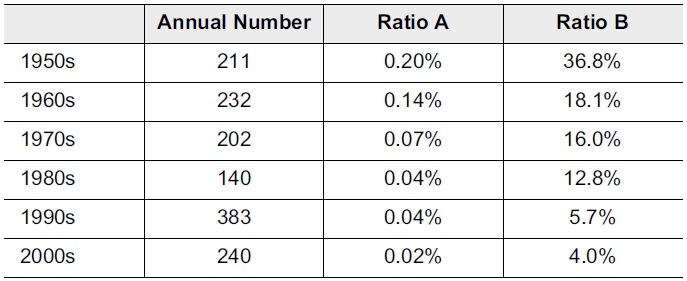
The Trend of Public Officials Indicted for Corruption in Korea
Korea’s electoral democracy encountered the same problem of vote buying and high election costs as the Philippines did. Vote-buying practices became common as early as in the 1950s and were visible as late as the 1990s. But with relatively equal distribution of income and an increasingly large middle class, the demand for clientelism and vote buying was not as substantial as in the Philippines. In particular, Korea has been successful in curbing vote-buying practices and other election irregularities since the 1990s. While more than 10% of voters indicated their experience of receiving gifts, entertainment, or cash in the 1990s, that percentage dropped to around one or two percent in recent elections, according to post-election voter surveys conducted by Korea’s National Election Commission. With the decline of clientelism and the development of programmatic party competition, anti-corruption reforms were introduced and corrupt politicians have been punished, including two former authoritarian presidents and family members of the democratically elected presidents. Although high election costs have been a big concern since as early as the 1960s, some studies indicate that election costs were not as high as in the Philippines.8 Moreover, the trend of top-level political donations shows a declining trend of high-level political corruption since the mid- or late 1990s.
When Taiwan was liberated from Japanese colonial rule in 1945, it came under the control of Chiang Kai-shek’s Kuomintang (KMT). Most Taiwanese welcomed the reinstitution of Chinese rule, but they soon were disappointed and outraged about rampant corruption and looting by the military government headed by Chen Yi, the first governor-general. Taiwanese resentment over corruption and oppression led to the February 28 uprising in 1947. After the KMT was defeated by the Communists on the mainland and fled to Taiwan, martial law was declared in May 1949. The authoritarian rule of the KMT party state lasted for 38 years until the lifting of martial law and beginning of gradual democratization in 1987.
The KMT’s defeat on the mainland as well as the February 28 incident provided Chiang Kai-shek with some bitter lessons. The KMT regime carried out a farreaching land reform (1949-1953), which gave the regime autonomous space from societal interests. In Taiwan, large enterprises in strategic sectors were state-owned and the small and medium-sized enterprises (SMEs) dominated the private sector. Thus, with the dissolution of the landlord class, there were no powerful private interests that could exert strong influence on the government. The fact that political leadership of the KMT came from mainland China, while businesses were mostly run by indigenous people, also contributed to the insulation of the state from private interests. Chiang also launched a comprehensive reform program of the party, and many KMT officials considered corrupt or disloyal resigned, were forced out of the party or failed to come to Taiwan altogether. Thus, the regime was relatively free from not just corrupt officials but also rentseeking landlords and warlords. During the authoritarian era, the formerly-corrupt KMT transformed itself to a relatively clean and coherent party and established a developmental state with a meritocratic bureaucracy on Taiwan.
The Examination Yuan recruited civil servants through civil service examinations, and the percentage of government employees who had passed civil service examination steadily increased from 10.8% in 1954 to 25.8% in 1962 to 35.5% in 1972 to 45.3% in 1980 (Clark 2000). The university system in Taiwan supplied a steady stream of graduates to fill positions at the lower level of the government bureaucracy (Ho 1987).
Since Taiwan’s authoritarian regime largely limited elections for public office at the local level, political clientelism and electoral corruption were initially limited to the local level. With the gradual democratic transition, clientelism and vote buying practices spread to the national level. Because of low levels of inequality and poverty, however, clientelism and vote buying did not develop to such an extreme level as in the Philippines. With vigorous anti-corruption and anti-vote buying prosecution, most clientelist networks centered on local factions have disintegrated (Wang and Kurzman 2007). Unlike in the Philippines, vote buying and clientelistic politics did not appeal to most middle class voters, and programmatic party competition developed over time.9 With programmatic competition, corrupt politicians have been prosecuted or punished at the polls. After the KMT lost power in 2000, partly because of its corrupt image, the party introduced serious anti-corruption reforms such as the pledge to not nominate corrupt politicians as candidates for public office. When the DPP government was involved in corruption scandals, even the first lady was not exempt from prosecution and the DPP lost general elections and had to transfer power back to the KMT in 2008.
7Under Rhee, a small number of powerful politicians in his Liberal Party enjoyed the privilege of dispensing patronage jobs. During the democratic Chang administration, there was discussion of allowing each member of National Assembly to recommend two eligible candidates for his or her district to the state bureaucracy, which was criticized by the public. Under Park, patronage appointments were largely given to the military officers. The scope of patronage appointment in Korea, however, was far smaller than that in the Philippines. 8According to Milne (1968), the index of campaign expenditure (cost per vote/industrial hourly wage) for the Philippines in 1961 was 16. The same index for Korea in 1963 was between 2.7 (lowest estimate) and 10 (highest estimate), according to Lee and Kim (1969). 9The most salient issue in Taiwanese politics has been national identity and the cross-strait relations. Recently, socioeconomic issues have been becoming salient as well.
At the time of independence after World War II, Korea, Taiwan, and the Philippines were all poor nations with high levels of inequality and corruption. Sweeping land reforms in Korea and Taiwan around 1950 dissolved the landed elite and produced an unusually equal distribution of income and wealth, while in the Philippines failed land reform maintained the power of the landed oligarchy and high inequality. Different levels of inequality as well as class structures in these countries significantly influenced subsequent levels of corruption. Thus, success or failure of land reform several decades ago has had long-lasting impact on inequality, and thereby corruption.
The landed oligarchy in the highly-unequal Philippines had strong incentives to buy political influence and capture the state to protect their interests. Because of continuous popular demand for land reform, the politicians repeatedly promised land reform and the landlords increasingly relied on political corruption and capture to prevent or water down genuine reforms. In Korea and Taiwan, there were no powerful landed interests that had the incentives and capability to capture the state after the land reform. Thus, land reform opened the space for greater state autonomy.
Although there were clientelism and vote-buying in all the three countries, the prevalence of vote-buying and the associated costs of election campaigns were highest in the Philippines where both elites and masses had stronger incentives to engage in clientelistic exchanges. The high proportion of the poor in the Philippines still provides a fertile ground for clientelism, while programmatic competition has gradually developed in Korea and Taiwan. These incentives were visible in patterns of bureaucratic recruitment as well. In the Philippines, the role of competitive exams in bureaucratic recruitment declined over time as patronage appointments increased. In Korea and Taiwan, the role of competitive exams increased over time.
Although the focus of this study is to explain the large differences in corruption between Korea and Taiwan on the one hand and the Philippines on the other hand, inequality may also explain Korea’s somewhat higher level of corruption than Taiwan’s. Korea’s chaebol-centered industrialization strategy that was chosen by Park Chung-hee has subsequently led to increasing economic concentration by the chaebol, compared to the small-and-medium-sized enterprises-centered industrialization of Taiwan. Although Korea’s economic concentration and domination of family-conglomerates has not reached the level of the Philippines’, capture by the
This study makes significant contributions to the literature on corruption. It broadens the scope of corruption research beyond a single-minded focus on economic growth by exploring the role of inequality in fuelling corruption. It provides convincing historical evidence on the causal effect from inequality to corruption (and to underdevelopment),11 which was previously identified in a couple of cross-national studies (Easterly 2007; You and Khagram 2005). I recognize that causal direction may work both ways and find evidence of a reinforcing relationship between inequality and corruption in the case of the Philippines. But this article provides evidence from Korea and Taiwan that (changes in) inequality can affect (changes in) corruption over time. It does so by employing a comparative historical case study in which land reform was exogenous; success or failure of land reform was not determined by corruption but exogenous factors such as external communist threat and U.S. pressures. As a result, it is able to show how land reform, by affecting inequality in wealth and income, influenced corruption (and thereby economic growth). Many empirical studies found the negative causal effect of inequality on economic growth, and various causal mechanisms were suggested. This study indicates that corruption is likely to be an important channel through which inequality adversely affects economic growth.
This study finds evidence on two major causal mechanisms from inequality to corruption: capture and clientelism. High inequality increases redistributive pressures, which in turn give the rich stronger incentives to capture the policymaking and implementation processes. Under conditions of high inequality economic and political elites have incentives to develop clientelism rather than programmatic competition that could encourage the development of leftist parties, and the large poor population is vulnerable to clientelism because of the collective action problem. These causal mechanisms suggest that the effect of democracy on corruption may vary depending on the level of inequality. Democratic control of corruption may not function well under high levels of inequality, because clientelism prevents voters from punishing corrupt politicians and because policy processes are captured by the elite. Recent studies of democratization show that democracies are less likely to survive at higher levels of inequality (Boix 2003). High corruption and difficulty of controlling corruption in such countries may be an obstacle to democratic consolidation.
Last but not least, the findings on the gradual development of meritocratic bureaucracies in Korea and Taiwan and the role of land reform shed new light on the origin of developmental states in these countries. In particular, the conventional view that credits Park Chung-hee for establishing a meritocratic bureaucracy as a core of a developmental state in Korea is questioned. The role of land reform in the establishment of developmental states in East Asia needs to be explored further.
10Author’s forthcoming book (You 2014, forthcoming) includes a chapter that discusses this issue in detail. 11(You 2014, forthcoming) has a chapter that presents cross-national quantitative evidence, implying generalizability of the findings of the comparative historical analysis of the three countries.