Cerebral blood flow (CBF) is generally coupled with the metabolism of brain tissue (Raichle, 1998). Normal aging has been associated with various changes in the brain, including reductions in cerebral blood flow (CBF), gray matter (GM) and white matter (WM) volume, as well as relatively selective decline in specific neurotransmitter systems, and other neurophysiological changes (for review see Buckner, 2004; Morrison and Hof, 1997). Neuroimaging techniques like PET and MRI have been used to investigate the relationship between aging and CBF changes (Bentourkia et al., 2000; Davis et al., 1983; Gur et al., 1987; Leenders et al., 1990; Melamed et al., 1980; Pantano et al., 1984; Parkes et al., 2004; Shaw et al., 1984; Slosman et al., 2001) as well as the relationship between aging and brain atrophy (Filipek et al., 1994; Good et al., 2001; Guttmann et al., 1998; Luft et al., 1999; Pfefferbaum et al., 1994; Raz et al., 1997; Resnick et al., 2000). However, the relationship between CBF and structural changes in aging remains unclear. While the previously mentioned studies demonstrate a significant ageassociated decrease in CBF, other studies report that CBF remains stable with aging after controlling for structural changes (Itoh et al., 1990; Meltzer et al., 2000). Moreover, the risk of vascular disease, which is associated with structural changes and reductions in CBF (Gsell et al., 2000), also increases with age and may further modulate CBF alterations. In addition to defining CBF in ‘normal’ brain aging, distinguishing these effects of aging from the earliest changes of neurodegenerative diseases like Alzheimer’s disease (AD) remains a major challenge.
Arterial Spin Labeling (ASL) MRI is a quantitative measure of CBF which may be a potentially useful marker of early AD (Alsop et al., 2010). Given the linkage between CBF and brain metabolism, ASL MRI may offer a less expensive and easier to acquire alternative to flurodeoxyglucose (FDG) PET, which has shown great promise as an early marker of both disease presence and progression. However, to optimally assess the effects of aging and neurodegeneration on brain structure and function, as well as to gain a better understanding of the aging brain, it is useful to examine the effects of aging on CBF, as measured by ASL, in the context of concomitant structural changes (Akiyama et al., 1997; Chen et al., 2011; Tohgi et al., 1998). In this study, we explored the effects of aging on resting CBF in healthy older adults. We used several methods to correct for age-related structural changes. By comparing the correlations between age and CBF values with and without correction, our goal was to illuminate the extent to which resting CBF changes in aging can be explained by structural changes.
One approach adopted in this study was partial volume correction. The partial volume effect (PVE) is caused by the limited spatial resolution in brain imaging. Each voxel in functional brain imaging usually contains three types of tissues: gray matter (GM), white matter (WM), and cerebrospinal fluid (CSF). The uncorrected CBF value reflects an averaged contribution from all three tissues but not from GM alone. The ratio of GM/WM changes substantially with aging, especially in older adults. The error introduced by PVE on CBF has been reported in a number of early PET studies (Du et al., 2005; Kops and Reilhac, 2004; Leenders et al., 1990; Meltzer et al., 2000; Meltzer et al., 1996; Pantano et al., 1984; Schmidt and Sokoloff, 2001; Tanna et al., 1991), and more recently in ASL studies (Asllani et al., 2008; Du et al., 2006). After PVE correction, age-associated CBF changes specific to GM can be explored.
We also investigated the effect of local volume atrophy on CBF values. We used a method of tensor-based morphometry to identify deformation of the local volume. The tensor-based Jacobian map has been demonstrated to be a reliable index in detecting local volume changes (Hua et al., 2009). The Jacobian determinant is the local volume scaling factor after we spatially normalized the individual structural image to standard space using nonlinear registration (while the linear registration represents the whole brain volume resizing) (Chung et al., 2001; Freeborough and Fox, 1998).
With use of these two approaches we found that while CBF changes were attenuated by structural alterations, there were still significant changes in CBF that could not be entirely explained by structure. These findings enhance our understanding of the aging brain and the relationship between age-associated volume loss and CBF.
Data acquired from forty-one healthy older adults (mean age ± SD, 68.7 ± 8.0 years, range 54-82 years, 14 males) were analyzed. There was no significant difference in age between men and women (mean age ± SD, 68.6 ± 9.8 years for men; 68.8 ± 7.1 years for women; independent samples t-test, p = 0.93). Each participant was carefully screened for evidence of dementia and had no history of neurological or psychiatric disorders. Mini-Mental State Examination scores (Folstein et al., 1975) were 29.5 ± 0.9. There was no significant correlation between age and MMSE scores (r = -0.17, p = 0.3). The study protocols were approved by the Institutional Review Board (IRB) of the University of Pennsylvania and informed consent was obtained from all subjects prior to the study.
MRI Scanning was conducted on a Siemens 3.0T Trio whole-body scanner (Siemens AG, Erlangen, Germany), equipped with a product eight-channel array head coil. ASL perfusion MRI scans were performed on all subjects using a pseudo-continuous ASL sequence (TR = 4 sec, labeling duration = 1.5 sec, post-labeling delay = 1.5 sec) (Dai et al., 2008; Detre et al., 1992; Detre et al., 1994; Silva and Kim, 1999; Wu et al., 2007). Interleaved images with and without labeling were acquired using a gradient EPI (echo-planar imaging) sequence with 8 mm slices and 4 mm in-plane resolution. During the scans, participants were asked to relax, keep their eyes open and stay awake (resting scans). In addition, high-resolution T1-weighted anatomical images were obtained using a 3D MPRAGE sequence (TR = 1620 ms, TI = 950 ms, TE = 3 ms, flip angle = 15°, 160 contiguous slices of 1.0 mm thickness, in plane resolution = 1 mm × 1 mm).
Imaging data processing and analyses were carried out with Statistical Parametric Mapping software (SPM5, Wellcome Department of Cognitive Neurology, UK, implemented in MatlabR2008b, Math Works, Natick, MA). AMatlab and SPM-based toolkit, ASLtbx,1 was used to quantify CBF values and reconstruct CBF maps for perfusion analyses. We used an SPM-based toolbox, VBM8,2 to segment each individual subject’s structural image. A false discovery rate (FDR) correction was applied to account for multiple comparisons. Additionally, AlphaSim in AFNI (Version: 2010_10_19_1028, B. Douglas Ward3) was applied to estimate the probability of false positive clusters. In a 79 × 95 × 69 volume with cubical 2 mm voxels and a full width at half maximum (FWHM) noise smoothness of 8 mm, if the pervoxel p-value threshold is set at 0.001, to keep the probability of getting a single noise-only cluster at 0.05 or less, the cluster size threshold should be 92 voxels or more (Monte Carlo simulation times: 10000).
2.3.1 Structural images processing
Standard VBM analysis with default parameters was applied for structural preprocessing. T1 images were normalized to a template space and segmented into gray matter (GM), white matter (WM) and cerebrospinal fluid (CSF). The corresponding GM, WM, and CSF probability maps in native space were calculated. These maps were used to calculate PVE corrected CBF images. To estimate the local volume changes, we used the Jacobian determinant as an index. The Jacobian determinant for each voxel was written in normalized space. To estimate the global tissue volume changes, the numeric brain volumes of GM, WM and CSF for each subject were also calculated.
2.3.2 Uncorrected CBF image processing
For each participant, functional images were first realigned to correct for head motion and smoothed in space using a three-dimensional, 6mm FWHM Gaussian kernel. The perfusion weighted image series were then generated by pair-wise subtraction of the label and control images, followed by conversion to an absolute CBF image series based on a single compartment CASL perfusion model (Wang et al., 2008). Thus, the resulting CBF data sets contained 117 acquisitions with an effective TR of 8 s. One mean CBF image was generated, and co-registered with an anatomical image for each individual participant. These CBF images were normalized to a 2 × 2 × 2 mm3 Montreal Neurological Institute (MNI) template using bilinear interpolation and smoothed using an 8 × 8 × 8 mm3 FWHM Gaussian kernel. Subsequently, the smoothed CBF maps were entered into the whole brain voxel-wise multiple regression analysis using the PET model in SPM5. The correlation map between resting CBF and age was generated, controlling for gender and whole brain global CBF values.
2.3.3 PVE corrected CBF image processing
Due to the large voxel size used in ASL MRI, the gray matter CBF values may be underestimated. Therefore, we conducted a partial volume effect (PVE) correction to the original CBF maps (Du et al., 2006; Hu et al., 2010). The corresponding GM, WM, and CSF probability maps were registered and then resampled to the native ASL MRI space for each participant. The resampled GM probability maps were thresholded at 30% probability to locate the GM voxels for the following PVE correction. Assuming a global ratio of 0.4 between WM perfusion and GM perfusion based on a previous PET study (Leenders et al., 1990), PVE factors on original GM CBF were corrected using the method proposed by Du et al. (Du et al., 2006) with the following equation: IPVEcorr = Iuncorr / (PGM + 0.4 × PWM), where IPVEcorr and Iuncorr are the corrected and uncorrected intensities, and PGM and PWM are the tissue probabilities obtained by segmenting the structural images as described above. Here the CBF value was assumed to be the sum of the partial flow contributed by GM and WM (CBF difference in CSF was assumed to be zero). And the partial flow contribution of WM was represented as a linear function of the contribution of GM. Additionally, the PVE index maps were also obtained by applying the equation to each voxel: PPVE = PGM + 0.4 × PWM. The PVE corrected CBF images and the PVE index maps were then normalized to a 2 × 2 × 2 mm3 MNI template using bilinear interpolation and smoothed using an 8 × 8 × 8mm3 FWHM Gaussian kernel.
The PVE corrected CBF images were entered into the whole brain voxelwise multiple regression analysis in SPM5. The correlation maps between CBF values and age were generated, controlling for gender and whole brain global mean CBF values. The PVE index maps were also entered into the whole brain voxel-wise multiple regression analysis. The correlation maps between the index values and age were generated, controlling for gender.
2.3.4 Atrophy correction
Local brain volumes atrophy with aging, which may affect CBF values. We used the Jacobian determinant map as an index. The Jacobian determinant maps were normalized to a standard MNI template as the uncorrected CBF images. To investigate to what extent the CBF change can be explained by local volume atrophy, the Jacobian index was entered into the partial correlation analysis between CBF values and age as a covariant.
2.3.5 ROI analysis
Regions of interest (ROIs) were selected from the above-mentioned multiple regression correlation map of uncorrected resting CBF and age (p < 0.001, uncorrected; minimum cluster size = 20) (Table 1). A gray matter mask was made from the mean GM probability map thresholded at 0.8. CBF values were extracted from uncorrected and PVE corrected CBF images and averaged across all voxels within each ROI. To ensure that the same voxels were analyzed for uncorrected and corrected CBF, the uncorrected CBF images were also masked by gray matter probability maps (thresholded at 0.3) before smoothing. PVE and Jacobian index values were also extracted from the aforementioned PVE and Jacobian index maps and averaged across all voxels within each ROI. Subsequent statistical analyses were performed using SPSS 16.0.4 Partial correlations between age and CBF values (with and without PVE correction) were calculated controlling for global mean CBF values and gender. Partial correlations between the PVE index and the Jacobian index values with age were calculated controlling for gender. To control for additional local volume atrophy, the Jacobian index values were entered as a covariate in the partial correlation analysis between age and both the uncorrected and PVE corrected CBF values (also controlling for global mean CBF values and gender).
1http://www.cfn.upenn.edu/~zewang/ASLtbx.php 2http://dbm.neuro.uni-jena.de/vbm/ 3http://afni.nimh.nih.gov 4SPSS Inc.;http://www.spss.com
3.1 Multiple regression analysis
3.1.1 Relationship between uncorrected resting CBF and age
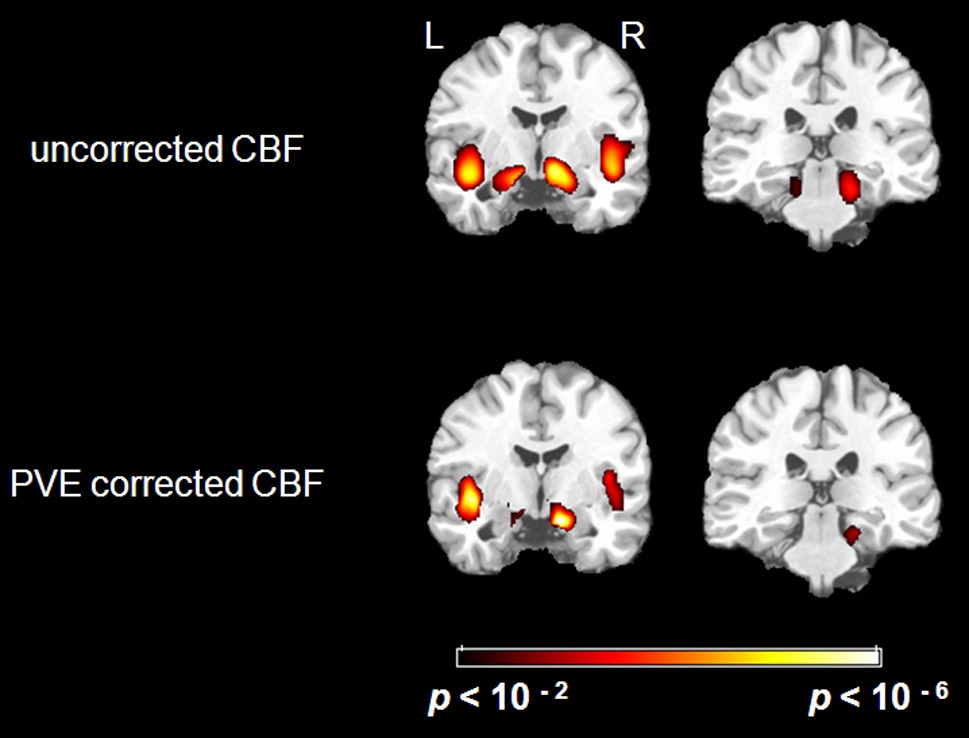
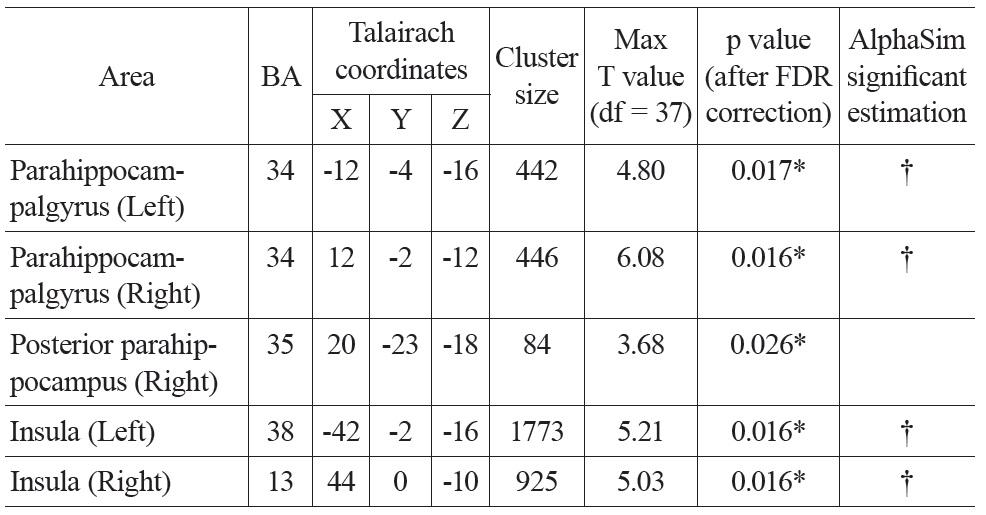
There were significant negative correlations between uncorrected resting CBF and age in the parahippocampal gyrus and the insula after eliminating the variance associated with global mean CBF and gender (Figure 1. Top). We selected all five significant regions as ROIs for later comparison: left and right parahippocampal gyrus, right posterior parahippocampus, left and right insula (including a part of superior temporal gyrus, STG). The negative correlations between uncorrected CBF and age in all of the ROIs were significant after FDR correction (see Table 1 for details). There were also positive correlations between uncorrected resting CBF and age in the thalamus (left), middle temporal gyrus (left and right), superior frontal gyrus (left and right) and precentral gyrus (left and right), but none reached significance after FDR correction.

Talairach coordinates and statistics for the regression analysis between uncorrected CBF and age
3.1.2 Relationship between structural change and age
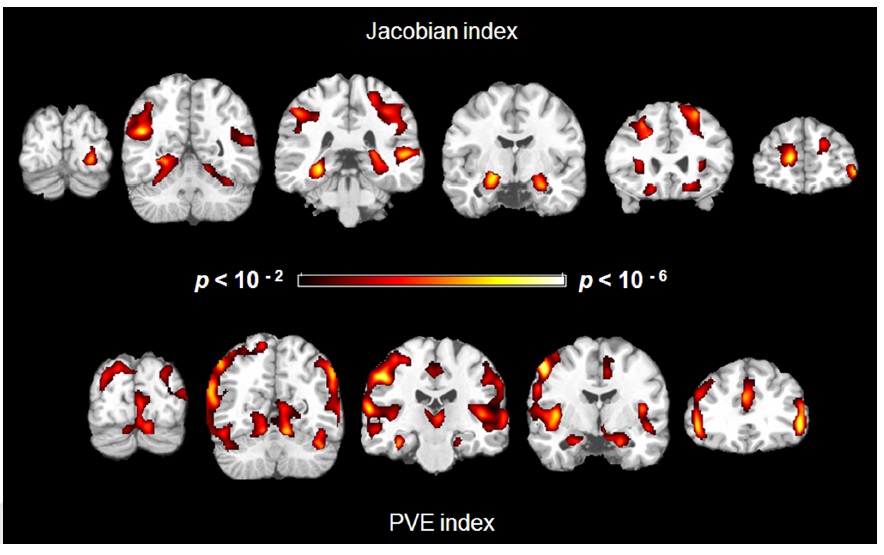
We found negative correlations between structural indices and age in several regions. For the Jacobian index maps and age, controlling for gender, age was associated with greater atrophy in the hippocampus (left and right), parahippocampus (left and right), insula (right), middle occipital gyrus (left and right), middle temporal gyrus (left and right), superior parietal lobe (left and right), cingulate sulci (left and right), central sulci (right) and superior frontal gyrus (left and right) (Figure 2 Top).
Similarly, for the PVE index, there were negative correlations in the hippocampus (left and right), parahippocampus (left and right), insula (left and right), middle frontal gyrus (left and right), postcentral gyrus (left and right), and parietal cortex (Figure 2 Bottom). There was, however, a positive correlation in the right superior frontal gyrus.
Brain volumes of GM (523.0 ± 7.4 ml), WM (563.5 ± 8.8 ml), CSF (262.9 ± 9.4 ml) and global tissue (GM + WM + CSF) (1349.3 ± 18.3 ml) were generated after segmentation processing using VBM8. There was no significant correlation between global tissue volume and age (r = 0.005, p = 0.98). Partial correlation analysis was conducted between GM/WM/CSF volumes and age controlling for gender and global tissue volume. A significantly negative correlation was found between GM volume and age (r = -0.70, p < 0.001). Concomitantly, a positive correlation was found between CSF volume and age (r = 0.67, p < 0.001). There was no significant correlation between WM volume and age (r = -0.21, p = 0.19).
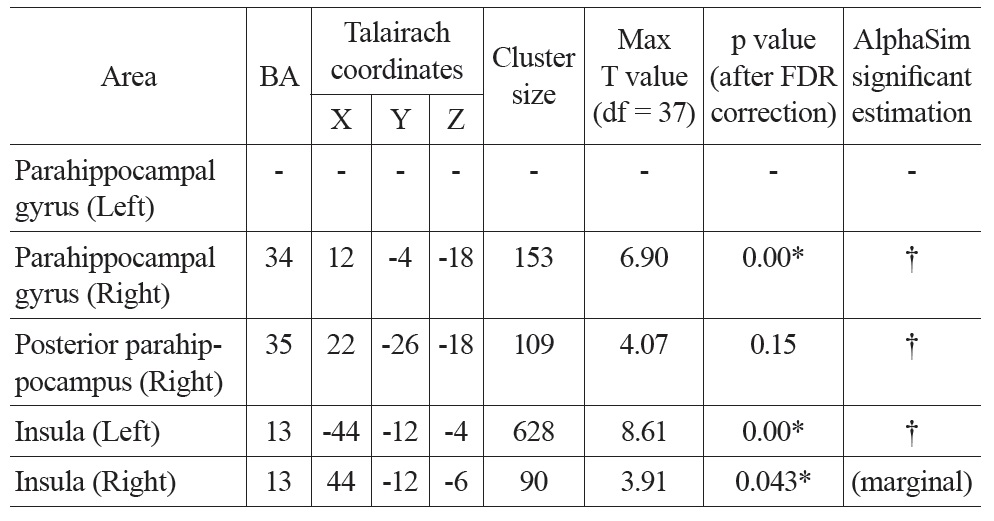
Talairach coordinates and statistics for the regression analysis between PVE corrected CBF and age
3.1.3 Correlations between PVE corrected CBF and age
After PVE correction, we found similar negative correlations between mean CBF values and age in the right parahippocampal gyrus and both insula, but not significantly in the left parahippocampal gyrus (Figure 1 Bottom). The right parahippocampal gyrus, right posterior parahippocampus and left insula also survived AlphaSim correction (> 92 voxels for p < 0.05), the right insula was marginally below threshold (90 voxels) (Table 2). There were also positive correlations in the superior frontal gyrus (right), and the inferior parietal lobe (left and right), but these did not meet the FDR correction threshold.
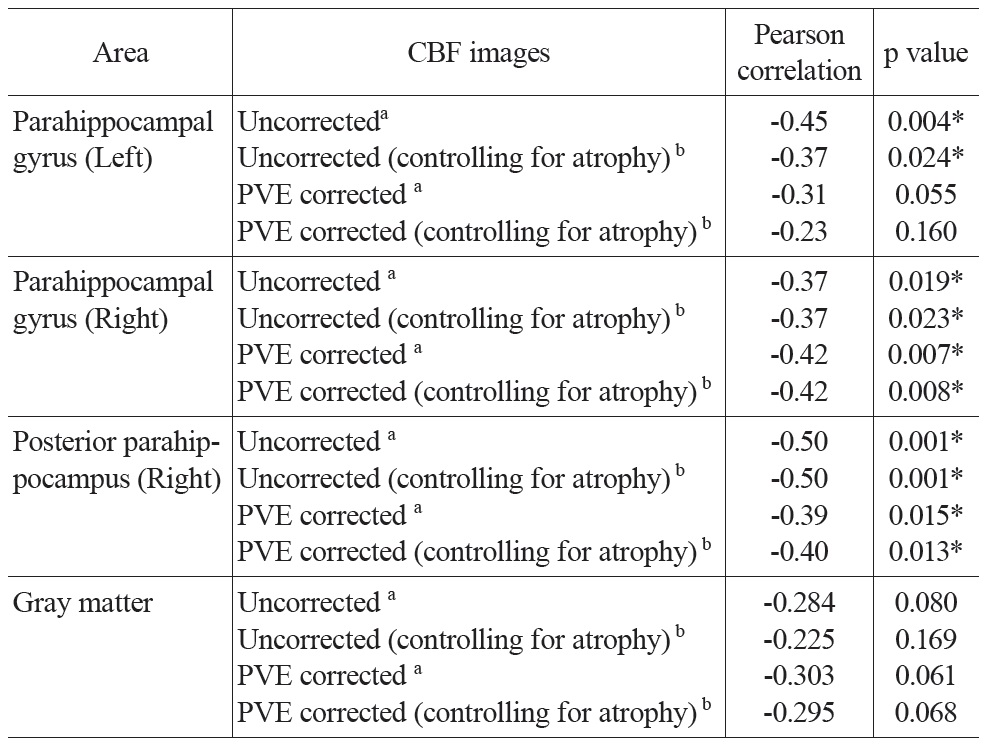
[Table 3.] Partial correlation between mean CBF and age

Partial correlation between mean CBF and age
Partial correlation analysis between CBF values and age controlling for global mean CBF values and gender were conducted for both uncorrected and PVE corrected CBF in all ROIs and the gray matter mask (Table 3). Significant negative correlations were found in most of the ROIs. The partial correlation for left parahippocampal gyrus was only marginally significant (r = -0.31, p = 0.055) after PVE correction. All the other partial correlations were significant (p’s < 0.02). CBF across the entire gray matter did not yield significant correlations, but trended towards significance in both the uncorrected and PVE-corrected data (p’s < 0.1; see Table 3 for detailed results). To address the possibility of an additional atrophy effect, the Jacobian determinant values were entered as a covariant into the above-mentioned partial correlation analysis. Results were similar to those reported above.
The uncorrected global mean CBF values and the mean CBF values extracted from the GM mask were also entered into a bivariate Pearson correlation analysis with age. There was no significant correlation between global mean CBF and age (r = -0.11, p = 0.50) or between GM mean CBF and age (r = -0.17, p = 0.30).
Partial correlation analyses between CBF values and MMSE scores controlling for global mean CBF values and gender were also conducted for both uncorrected and PVE corrected CBF in all ROIs. The partial correlation for the left insula was significant (r = 0.34, p = 0.034) without PVE correction, while not significant (r = 0.28, p = 0.087) with PVE correction. All the other correlations were not significant (p’s > 0.13).
3.3 Left and right parahippocampal asymmetry
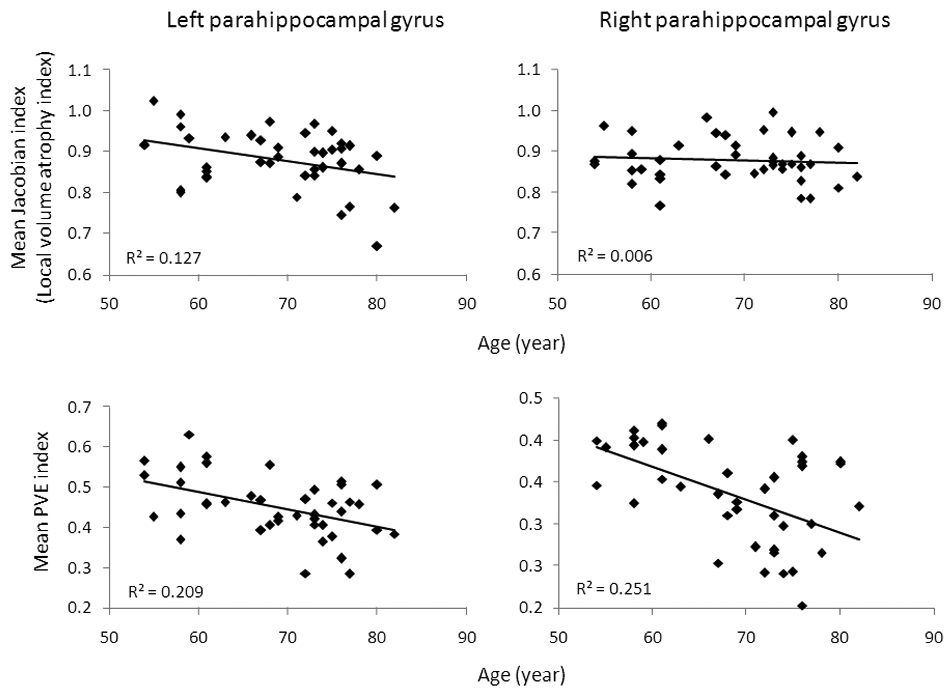
Mean Jacobian and PVE factors were also extracted from two ROIs (the left and right parahippocampal gyrus) per subject. A paired-samples t-test revealed that Jacobian values between two ROIs were not significantly different (t(40) = 0.22, p = 0.83), but PVE values for the left ROI were significantly larger than those for the right ROI (t(40) = 15.3, p < 0.001). There was a significant correlation (Pearson correlation) between the mean Jacobian factor and age in the left parahippocampal gyrus (p < 0.03), but not in the right parahippocampal gyrus (p > 0.6). Correlations between PVE factors and age were significant both in the left and right parahippocampal gyrus (p’s < 0.01) (Figure 3).
In the current study, we investigated the effects of aging on CBF decline with ASL MRI while controlling for changes in brain structure, specifically, GM/WM heterogeneity (indexed by PVE factor) and atrophy of local volume (indexed by Jacobian factor). To do this, we calculated the relationship between uncorrected mean CBF values and age, as well as between indices of structural change and age. We found that these statistical maps partially overlapped with each other in the medial and superior temporal cortex. After correcting for these structural changes, we still found significant age-related CBF decreases in the right parahippocampal gyrus, right posterior parahippocampus, and bilateral insula. However, the correlation between the mean CBF values and age in the left parahippocampal gyrus was no longer significant after PVE correction.
For the age-associated structural change, we used two different approaches to examine their effects on CBF. To account for alterations of the GM/WM ratio, we applied a PVE correction. The impact of PVE related issues on CBF measures has been theoretically clear since early PET studies. Based on those studies, we were able to directly correct CBF values by the PVE index. To account for local volume atrophy, we used Jacobian determinant as an index. The relationship between local atrophy and CBF is less clear, and in order to understand how much the change of CBF with age could be explained by atrophy, we applied the Jacobian index as a covariant in the partial correlation analysis of CBF with age. Finally, the PVE is also influenced by atrophy and it is unclear whether both of these measures should be applied for adjustment of CBF data or whether they provide some degree of redundant information. Nonetheless, even controlling for atrophy, there was little change in the relationship between PVE corrected CBF and age (see Table 3).
The regions that showed age-related CBF decreases were a subset of the regions that have been reported in other work investigating this issue, including parahippocampal gyrus (Beason-Held et al., 2009), insula (Asllani et al., 2009; Beason-Held et al., 2009; Leenders et al., 1990) and STG (Chen et al., 2011; Jahng et al., 2006). However, the present results did not include other regions that have been reported by previous studies, for example the medial frontal cortex (Asllani et al., 2009), the precuneus (Beason-Held et al., 2009; Lee et al., 2009) and the anterior cingulate (Chen et al., 2011; Pagani et al., 2002). One possible explanation of these differences with earlier work is that our cohort was limited to older adults (age > 50 years old). Age-related CBF changes have been reported to vary depending on the age of the group. For older adults, regions with CBF reduction tend to be limited to smaller regions than in younger cohorts. Another possible explanation for the differences is gender effect. It has been reported that women showed fewer areas of CBF reduction compared to men (Asllani et al., 2009). In our study, there were more females than males (27 females and 14 males).
We found considerable overlap between regions of reduced CBF and volume with age. Nonetheless, after mitigating against the effects of partial volumes and local atrophy, we still found significant age-associated CBF decline in most of the regions observed for the uncorrected data. This result supports the notion that CBF changes with aging cannot be explained solely by structural change. This suggests that alterations in metabolism, largely reflective of synaptic activity (Attwell and Laughlin, 2001; Schwartz et al., 1979), decline with aging independently of atrophy. One possible caveat concerning our correction methods is that they relied on an automated methodology that may have inherent inaccuracies. For example, the segmentation processing in VBM may not be as accurate as manual segmentation. Nonetheless, previous studies have reported that VBM and manual volumetry are quite consistent (Uchida et al., 2008). Furthermore, Mak et al. (2011) demonstrated that these two procedures performed similarly in the hippocampal measurements of cognitively normal older adults.
Asymmetry of CBF and structural atrophy were found in our study in the left and right parahippocampal gyrus. In the left parahippocampal gyrus, the mean CBF values with PVE correction did not decrease significantly with age. Age-related atrophy was also asymmetric in the left and right parahippocampus (Figure 3). Similarly, other studies have also reported significant lateral asymmetry for the regional distribution of perfusion (Floyd et al., 2003; Pfefferbaum et al., 2010; Rodriguez et al., 1991). The reason for this asymmetry is unclear and may be related to hyper-perfusion, perhaps as evidence of compensation or inflammation (Alsop et al., 2008; Hu et al., 2010).
Various studies have investigated the effect of gender on CBF and glucose metabolism changes in resting or activation conditions (Adinoff et al., 2006; Esposito et al., 1996; Gur et al., 1995; Kawachi et al., 2002; Kim et al., 2009). Our results showed greater CBF decline in the right parahippocampal gyrus, which was consistent with earlier studies on female participants (Asllani et al., 2009). In our study, gender was used as a covariate in partial correlation analysis. We did not analyze the difference between genders because we had more females (27 females) than males (14 males). Further work needs to be done to address this question.
Although several methods have been developed for PVE correction in PET, only two methods have been used for ASL perfusion MRI (Asllani et al., 2008; Du et al., 2006). In both methods, the CBF value is assumed to be the sum of the individual pure tissue contributions of GM and WM CBF. In this study, we used the method proposed by Du et al. (2006), and a global ratio of 0.4 between WM and GM perfusion was assumed based on a previous PET study (Leenders et al., 1990). It might be more accurate to determine the WM:GM perfusion ratio with each participant’s own perfusion data. Another algorithm for PVE correction has been proposed by Asllani et al. (2008). In their method, they use a regression algorithm to calculate the parameters instead of using the predefined global ratio. This seems to be more precise, but the regression-kernel may cause unknown errors and compromise the results. Additionally, there are other studies that only account for gray matter density (GMD) by dividing normalized CBF values by GMD in separate ROIs or voxels in each subject (Taki et al., 2011). More work is needed to evaluate different correction methods.
In the present study, we found significant age-related decreases in CBF in the parahippocampal gyrus (right) and insula (left and right). This decline was independent of age-related structural changes due to GM/WM heterogeneity and local volume atrophy. While PVE correction was clearly critical for the interpretation of CBF measurement, age-associated alterations appear to be somewhat independent of brain atrophy, providing additional insight into the physiology of the aging brain. Given the notion that AD, and perhaps other neurodegenerative conditions, may express brain changes in metabolism/synaptic activity prior to atrophy (Walsh and Selkoe, 2004), ASL MRI may provide a sensitive measure of such alterations. The definition of normal brain aging changes will serve as an important context in which to assess CBF alterations associated with disease.
CBF (cerebral blood flow); CSF (cerebrospinal fluid); EPI (echo-planar imaging); GM (gray matter); IRB (institutional review board); MRI (magnetic resonance imaging); MTL (medial temporal lobe); PVE (partial volume effect); ROI (region of interest); WM (white matter); STG (superior temporal gyrus).