Advances in brain morphometric analyses have provided a rich set of quantitative parameters that can be related to a cognitive function of interest in a voxel-wise fashion. Considerable research has focused on changes in regional grey matter density (GMD) or cortical thickness during development. There are strong data to suggest that these changes may underlie cognitive and intellectual development in children and adolescents. For example, improved performance on Verbal IQ (VIQ) has been correlated with cortical thinning in the left dorsal frontal and parietal lobe in children between 5 and 11 years of age (Sowell et al., 2004). Moreover, in the developing brains of children 7 to 17 years old, the trajectory or rate of change in the thickness of the cerebral cortex, rather than cortical thickness itself, has been found to be most closely related to the level of intelligence (IQ) (Shaw et al., 2006). Neural maturation reflected in cortical morphology during this period is dynamic, such that higher IQ has been associated with an initial accelerated and prolonged phase of cortical increase, which yields to equally vigorous cortical thinning by early adolescence.
Recently, metrics of brain structure other than GMD, such as white matter architecture characterized by diffusion tensor imaging (DTI), have been applied for assessing brain-behavior relationships. For instance, DTI studies have shown that the development of working memory capacity correlates positively with prefrontal-parietal connectivity (Nagy, Westerberg, & Klingberg, 2004). Based on structural and functional imaging data in both children and adults, Jung and Haier (2007) proposed the ParietoFrontal Integration Theory (P-FIT) of intelligence suggesting a distributed network underlying individual differences in intelligence and reasoning. The P-FIT model assumes that cognitively salient information processed by the sensory cortex in the temporal and occipital regions are connected to the prefrontal cortex, via the parietal lobule, where the anterior cingulate is implicated in response selection. Jung and Haier proposed that this network is dependent upon white matter tracts (e.g., arcuate fasciculus) that facilitate the process.
One difficulty in applying structural indices such as GMD and DTI as markers of cognitive ability is that brain morphometric features may not have adequate sensitivity to index changes in brain function, and may lag considerably behind the development of intelligence. As an alternative index of cerebral metabolism and neural activity, quantitative perfusion measures should provide an important physiological variable in the analysis of brain-behavior relationships. To date, however, scarce research has examined CBF in typical development due to the invasive nature of existing imaging techniques, such as positron emission tomography (PET) and single photon emission computed tomography (SPECT). Studies on clinical pediatric populations are unclear, but it is generally thought that global CBF has an inverse relationship with IQ in children (Rosenbaum, Almli, Yundt, Altman, & Powers, 1997; Strouse, Cox, et al., 2006).
Arterial Spin Labeling (ASL) is an emerging MRI technique that measures perfusion by using magnetically labeled arterial blood water as an endogenous tracer. ASL perfusion MRI is ideally suited and offers a great potential for pediatric perfusion imaging because it is totally noninvasive and provides improved image quality compared to perfusion images in adults due to unique physiologic properties of a child’s brain (Wang & Licht, 2006). The capability for absolute CBF quantification is another desirable feature of ASL for longitudinal studies to follow neuro-developmental changes (Rosenbaum et al., 1997; Strouse, Hulbert, DeBaun, Jordan, & Casella, 2006).
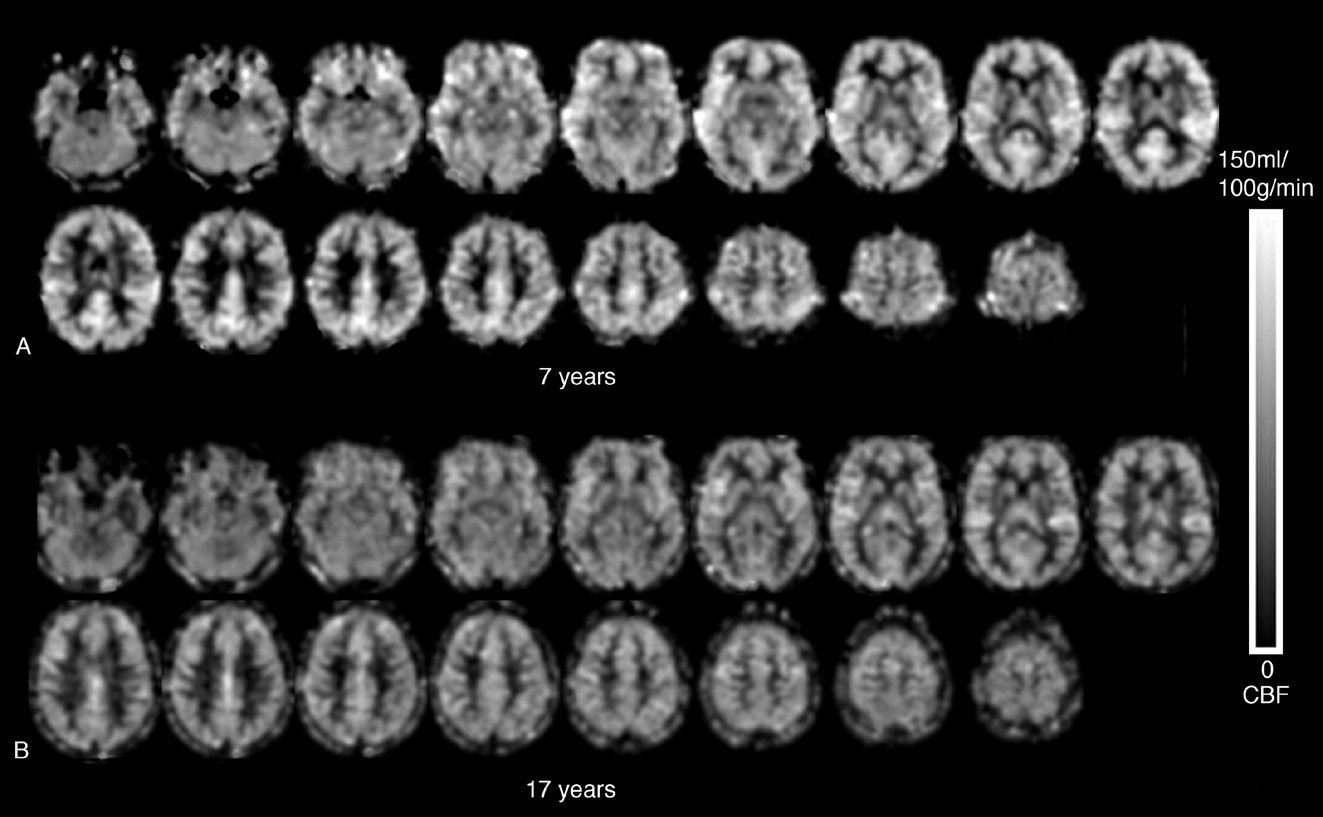
To date, a handful of ASL perfusion MRI studies have been carried out to address developmental changes of CBF with age (Biagi et al., 2007; Wang, Rao, & Detre, 2009). A general trend of decreasing CBF with age has been demonstrated in typically developing children age 5 and above. Further, a recent study looking at regional CBF with adjustment of variations in GMD showed that the relationship between GMD adjusted CBF and age can be characterized by an inverted U-shape followed by a U-shaped trajectory in most brain regions throughout childhood and adolescence (Taki et al., 2011). However, no study has explored the relationship between the development of CBF and intelligence. This study is part of a multi-modality longitudinal study looking at CBF across typical development via ASL perfusion MRI to create a reference data set of cerebral perfusion. In the present study, we aimed to explore the relationship between CBF and IQ using data collected at the first time point, in a cohort of 39 typically developing children and adolescents. Based on the P-FIT model, we hypothesize that CBF in the parito-frontal network is associated with IQ in children and adolescents, independent of morphometric measures.
Participants were recruited via advertisements distributed at various schools and online sources in the Los Angeles area. Interested participants were contacted via phone interviews and screened for eligibility; those who had any history of neurologic or psychiatric disorders, abuse of drugs or alcohol, major systemic diseases, or contraindications to MRI were excluded. Written informed consent was obtained from each subject and their parents according to the Institutional Review Board (IRB) of University of California Los Angeles (UCLA) guidelines prior to IQ assessment and MR scans. All subjects were healthy children between the ages of 7 and 17 (25 female). The mean age of the subjects was 11.3 ± 2.8 (SD). The final sample consisted of 39 participants.
Trained examiners collected intelligence quotients (IQ) by administering the Wechsler Abbreviated Intelligence Scale (WASI) third edition (Wechsler, 1999). The WASI measures intelligence in children 6 years of age and older. Verbal IQ (VIQ) was assessed by the Vocabulary and Similarities subtests and performance IQ (PIQ), by the Matrix Reasoning and Block Design subtests, and full scale IQ (FSIQ) by the sum of VIQ and PIQ in accordance with WASI instructions. Handedness in this sample reflected that of the general population, which is approximately 70% right-handers and 30% left-handers.
All images were collected on a 3-T Siemens TIM Trio Scanner (Erlangen, Germany), using a product 12-channel head coil. Subjects were instructed to refrain from caffeine use 3 hours before the study. The imaging protocol included T1-weighted structural MRI, ASL perfusion MRI and DTI scans. A 3D Magnetization Prepared Rapid Gradient Echo (MPRAGE) volumetric scan was acquired for high resolution T1-weighted anatomic images (TR = 1620 ms, TI = 950 ms, TE = 3 ms, FOV = 256 × 256 mm2, flip angle = 15°, 1.0 mm slice thickness, matrix = 256 × 256, 1NEX with a total scan time of 8min). A pseudo-continuous ASL (pCASL) sequence (Wu, Fernández-Seara, Detre, Wehrli, & Wang, 2007) was used for perfusion MRI scans, using gradient-echo echo-planar imaging (EPI) as the readout (TR = 4s, TE = 11 ms, labeling duration = 1.5s, post-labeling delay = 1.2s, 24 slices with 5 mm thickness and 1 mm gap acquired in ascending order, 80 acquisitions with a total scan time of 5.5 min). During resting perfusion scans, subjects were instructed to relax and keep head still while looking at a blank screen projected through Resonance Technology goggles.
2.4 Perfusion MRI analysis (ASL)
Magnitude images from the scanner were analyzed using in-house-developed scripts in Matlab (MathWorks, Natick, MA). Raw EPI images were first motion-corrected to the first image of the series via a six-parameter rigid body spatial transformation in SPM8.1 Perfusion images were generated by pairwise subtraction between the control and tag pairs and averaged over time. Quantitative CBF maps in units (mL/100g/min) were calculated using an one compartment model (Wang et al., 2005), assuming a labeling efficiency of 0.85 and a blood T1 of 1.65s at 3T. The accuracy of this quantification model has been validated in a recent study (Jain et al., 2010). All CBF maps were visually inspected to exclude data with imaging artifacts and the final sample included 39 subjects. For each subject, global mean CBF values were extracted in the whole brain. The CBF images were normalized into the canonical space (MNI brain template) following the transformation matrix determined by VBM analysis (see below), and spatially smoothed by a Gaussian kernel with 12-mm full-width at half-maximum (FWHM).
2.5 Voxel-based morphometry (VBM)
VBM analysis was preformed using SPM8, according to standard procedures (Thacker, 2005). For preprocessing, all the individual MR images were reoriented manually so that the origin was set just posterior to the genu of the corpus callosum. The images were then automatically segmented by using a cluster analysis technique. This process partitioned the images into gray matter, white matter, and cerebrospinal fluid (CSF) by using a modified mixture model cluster analysis technique with a correction for image intensity nonuniformity (Ashburner & Friston, 2000). The segmented images were then coregistered and normalized to standard MNI space. The image sets were smoothed with an isotropic Gaussian filter (10-mm FWHM). To adjust the effect of structural variations on regional CBF, CBF data were divided by GMD pixel by pixel in each subject (Taki et al., 2011).
Normalized CBF maps and GMD adjusted CBF maps were analyzed using general linear model (GLM) in SPM8, including gender, age, FSIQ and global mean CBF as covariates. For VBM, gray matter densities were normalized by proportional scaling. Global values were obtained using a separate MATLAB code that added together volumes of gray matter, white matter, and CSF, to represent total brain volume. The same multiple regression analysis was performed, with age, sex, and FSIQ as covariates. For both CBF and VBM analyses, regions of positive and negative correlations with FSIQ scores were identified at an arbitrary threshold of p-value < 0.01 with a minimal cluster size of 50 voxels (1.5 × 1.5 × 1.5 mm3). Small volume correction was further performed on detected activation clusters, using masks of Brodmann Area (BA) provided by Automated Anatomical Labeling toolbox.2
1http://www.fil.ion.ucl.ac.uk/spm/ 2http://www.fil.ion.ucl.ac.uk/spm/ext/#AAL.
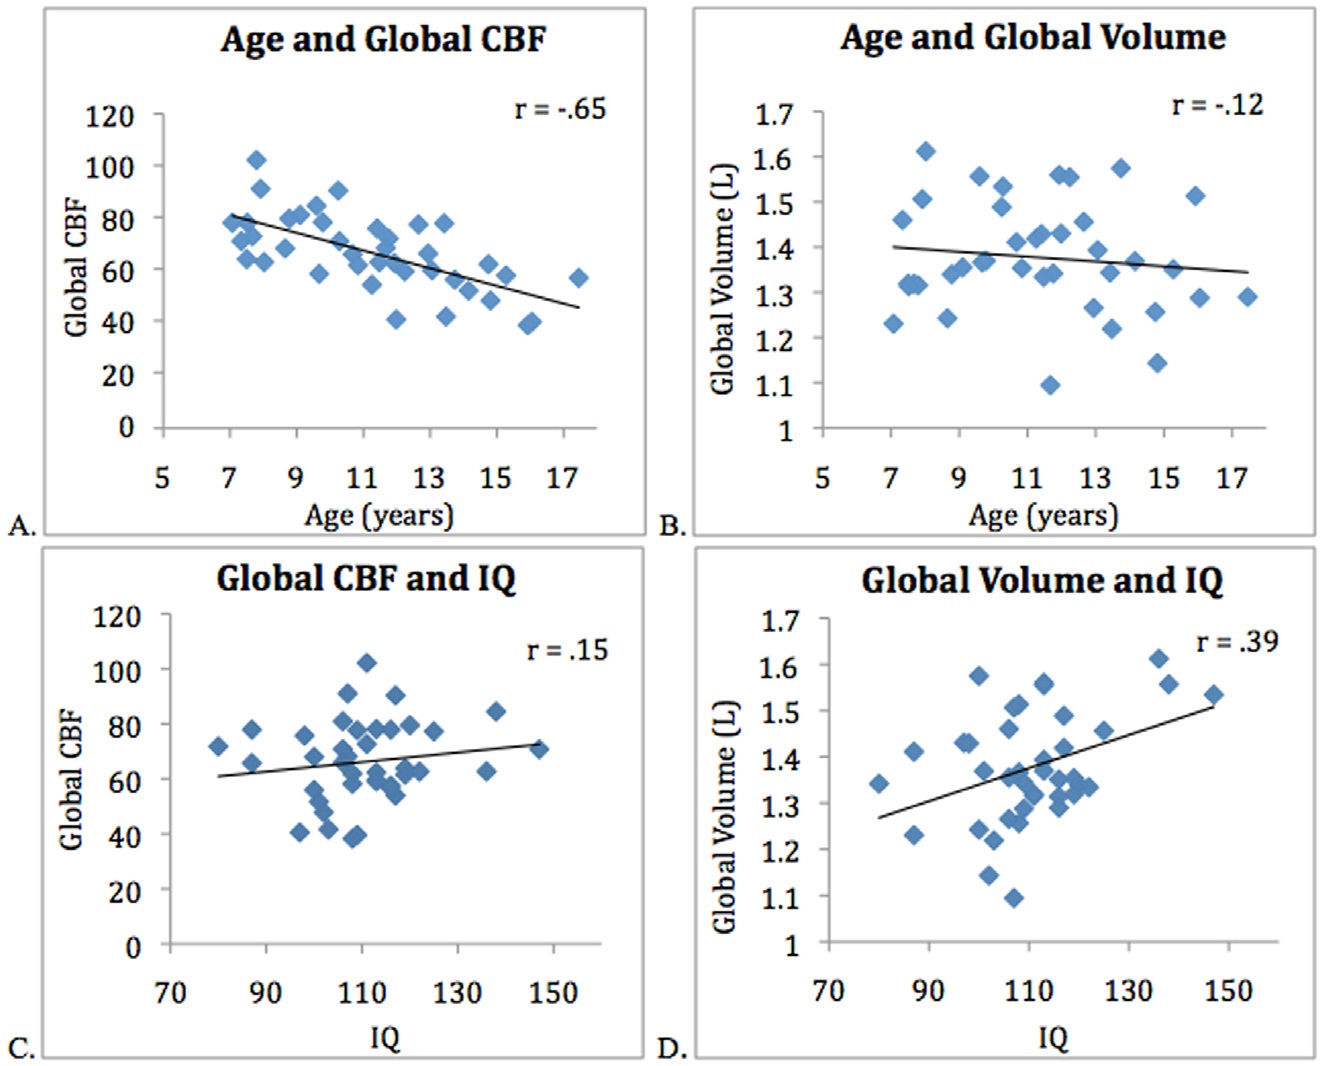
The mean FSIQ score for all 39 participants was 110.5 ± 13.0 (SD). The data indicated a significant negative correlation between age and global CBF (
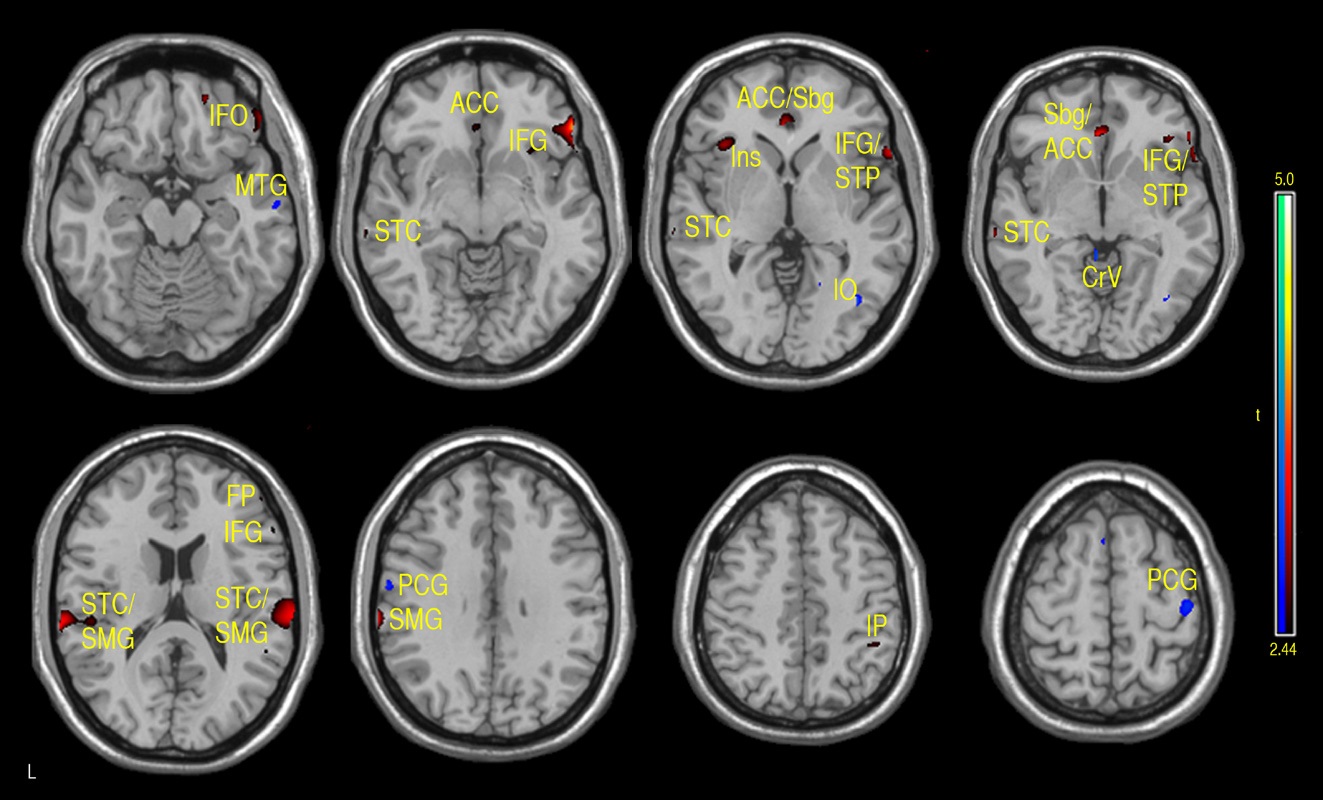
Both positive and negative correlations with FSIQ were found in a number of regions. FSIQ was positively correlated with CBF in the subgenual/anterior cingulate cortex (ACC) (BAs 25/24), right inferior orbitofrontal (BA 47) and superior temporal pole (BA 38), bilateral superior temporal and sppramarginal cortex (BA 42/40), right inferior parietal regions (BA 40) and left insula (see Fig. 3 and Table 1a).
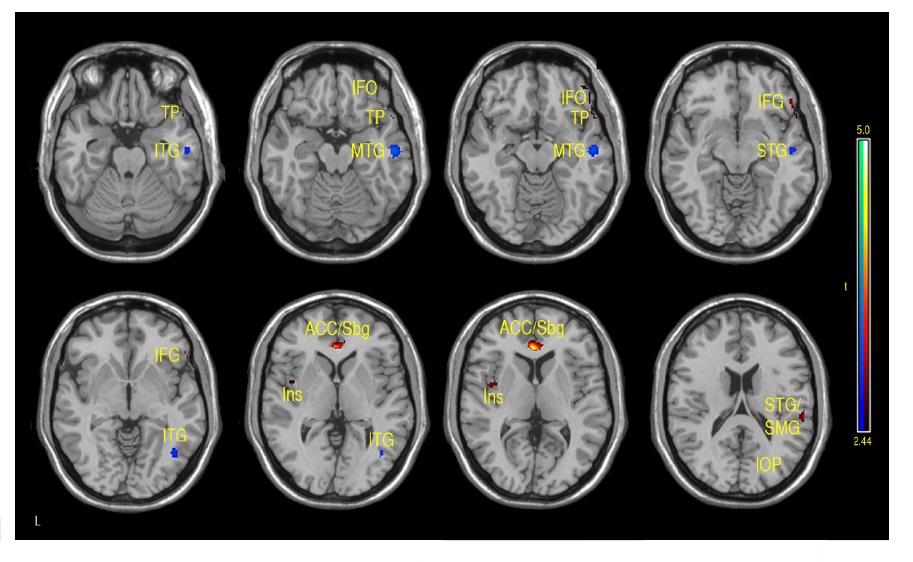
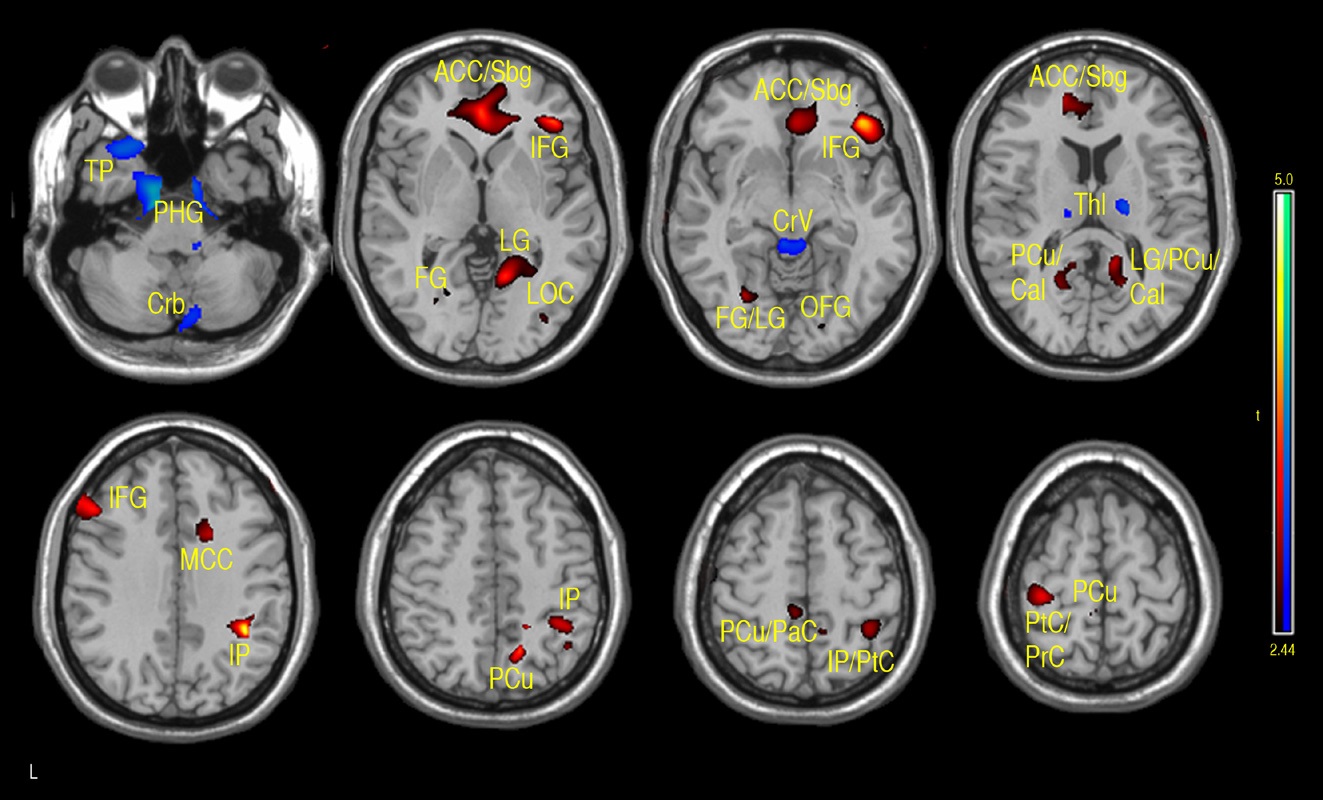
A similar pattern was observed in the correlations between FSIQ and GMD in VBM analyses. Specifically, significant positive correlations were observed in the subgenual/ACC and bilateral inferior frontal gyrus. Additional positive GMD correlations included right parietal lobe, occipital regions, precuneus, post and precentral gyrus (see Fig. 4 and Table 1b). When CBF was adjusted for variations in regional GMD, the subgenual/ACC remained significant as well as the right inferior orbitofrontal (BA 47), right superior temporal regions (IFG, BA 47) and left insula (see Fig. 5 and Table 1c). Small volume correction using BA 25 as the search volume revealed a significant peak activation (FWE
The main regions showing negative correlations between CBF and FSIQ (Table 1a and Fig. 3) were the right mid temporal gryrus (BA 21), inferior occipital cortex (BA 47), and bilateral pre/postcentral gyri (BA 6). VBM analysis also showed negative correlations between GMD and FSIQ in the temporal pole, parahippocampal gyrus and more medial bilateral cerebellar vermis and thalamus (Fig. 4 and Table 1b). When CBF was corrected for GMD, right hemispheric regions in the mid (BA 21/22) and posterior (BA 20/37) inferior temporal regions showed negative correlations between GMD adjusted CBF and FSIQ (Fig. 5 and Table 1c). However, the detected negative associations with FSIQ in CBF, VBM or GMD adjusted CBF analyses did not survive small volume correction.
The findings of the present study support previous reports of decreased global CBF with increased age in this age group (Biagi et al., 2007; Wang et al., 2009). It is known from developmental brain morphological studies that brain development is characterized by increased mylination and overproduction of synaptic density between the ages of two and five years, followed by a decrease in density of synapse due to pruning (Toga, Thompson, & Sowell, 2006). The age range (age 7-17 years) of the participants in our study falls within the developmental period of synaptic pruning (age 3-5 years through puberty); therefore, the observed trend of decreasing CBF with age likely reflects decreased synaptic density during pruning.
[Table 1A.] Activation clusters showing positive and negative associations between CBF and FSIQ
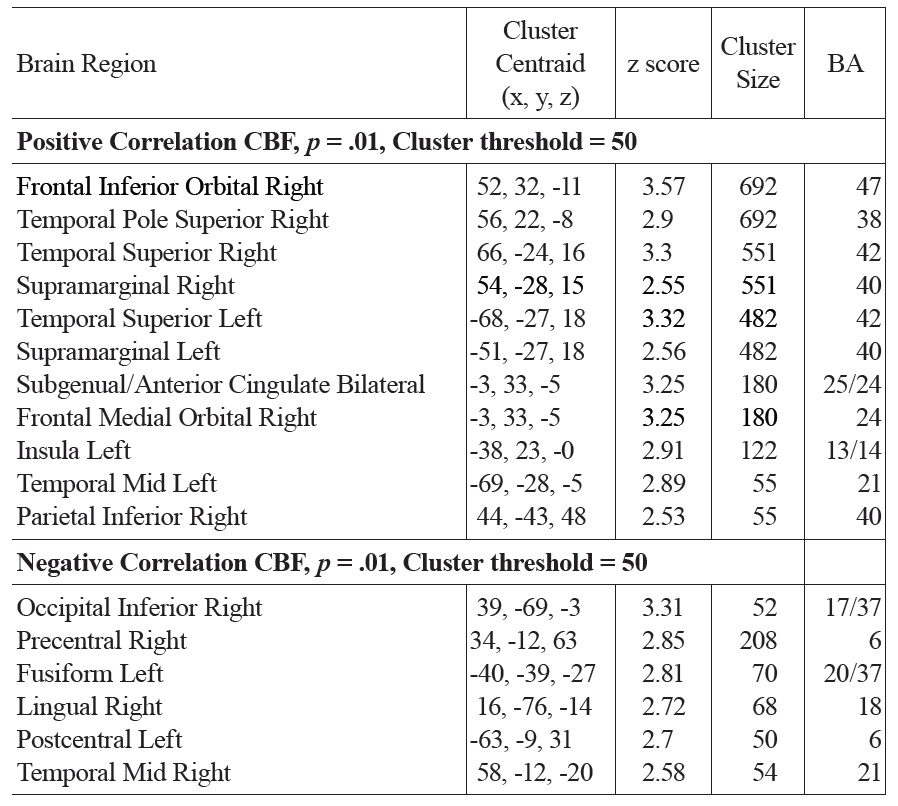
Activation clusters showing positive and negative associations between CBF and FSIQ
[Table 1B.] Activation clusters showing positive and negative associations between GMD and FSIQ
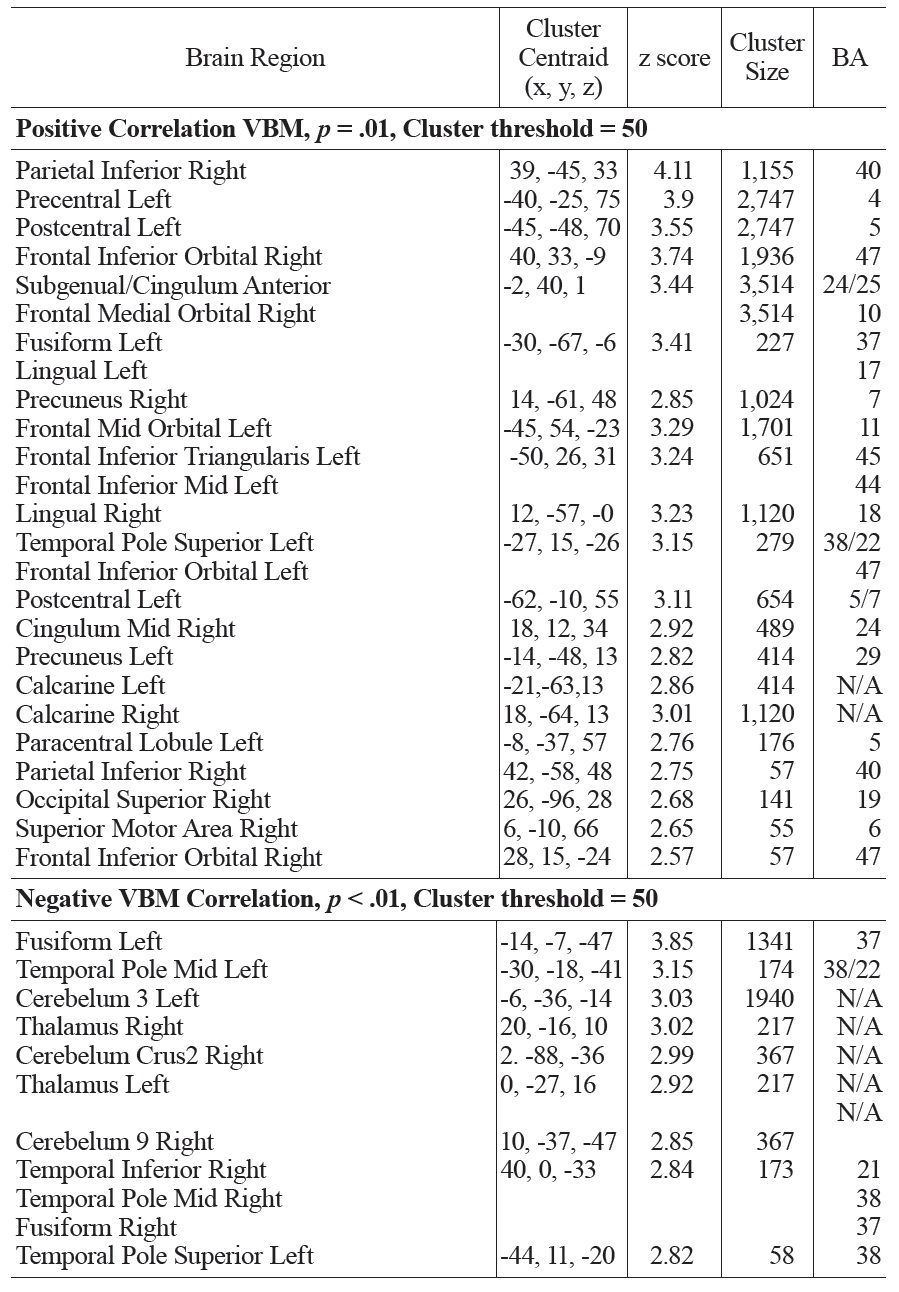
Activation clusters showing positive and negative associations between GMD and FSIQ

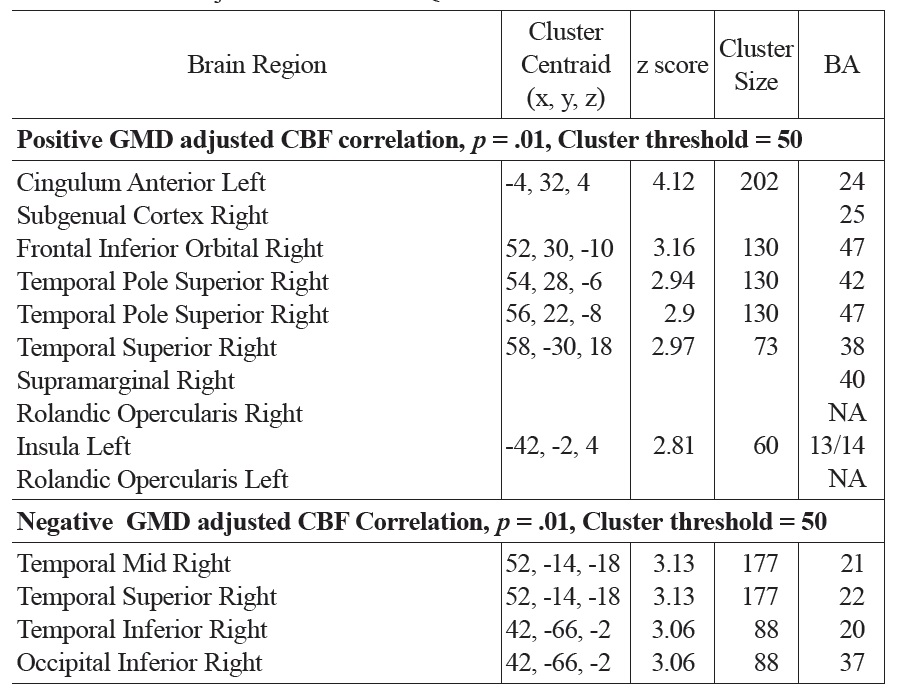
Activation clusters showing positive and negative associations between GMD adjusted CBF and FSIQ
4.2 IQ, cortical volume, and CBF
The present study demonstrates a significant correlation between total brain volume based on VBM analysis and FSIQ in children and adolescents (
In this study, significant positive and negative correlations between FSIQ and cortical volume were similarly observed. The results are consistent with prior studies. A positive correlation was observed in bilateral prefrontal lobes, ACC and parietal lobes. A negative correlation was seen in the anterior temporal lobes, particularly on the left. CBF analyses revealed similar patterns of brain regions with significant correlations with FSIQ. Positive correlations between CBF and FSIQ were observed in the subgenual/ ACC, right orbitofrontal, right inferior parietal, right superior temporal regions as well as left insula. Negative correlations of CBF with FSIQ were mainly observed in occipital and right mid temporal regions. These findings (especially positive correlations) are consistent with the P-FIT model that includes the following, by Brodmann areas (BAs): the dorsolateral prefrontal cortex (BAs 6, 9, 10, 45, 46, 47), the inferior (BAs 39, 40) and superior (BA 7) parietal lobule, the anterior cingulate (BA 32), and regions within the temporal (BAs 21, 37) and occipital (BAs 18, 19) lobes. While there is considerable overlap between the BAs detected in the present study and those of the P-FIT model (e.g. BAs 47, 40, and 7), there are some discrepancies. For example, the subgenual/anterior cingulate correlation was mainly located in BA 24/25 that are more ventral and anterior to BA 32 in the P-FIT model. Previous structural and IQ studies, however, have reported that BA 24 is related to IQ in adults (Colom, Jung, & Haier, 2006; Gong et al., 2005),
The IQ scores used in this study (FSIQ, PIQ and VIQ) are standard measures of intelligence. More specifically, PIQ testing involves block design and matrix reasoning that look at visuospatial function. Activation studies and lesion reports have localized visuospatial function to the parietal lobes (Vossel et al., 2011; Zago & Tzourio-Mazoyer, 2002). On the other hand, VIQ measures semantic knowledge by description of word/object meaning and similarity. This function localizes to the left inferior and middle temporal gyrus and inferior frontal regions (Démonet, Thierry, & Cardebat, 2005). Of course, performance on these tests is strongly influenced by frontal lobe functions, such as attention, concentration, and working memory. Consequently, these regions form the major nodes of the brain’s network of intelligence, as proposed by the P-FIT model (Jung & Haier, 2007).
While the patterns of correlations with IQ were largely consistent in our CBF and VBM analyses, we investigated the effects of cortical thickness on CBF by repeating regression analyses on GMD adjusted CBF data. After adjusting for GMD, positive correlations between CBF and FSIQ were still observed in the subgenual/ACC, right orbitofrontal, superior temporal regions and left insula. Negative correlations between CBF and FSIQ were still observed in the right temporal regions. In particular, the strength of the correlation with subgenual/ACC improved after adjusting GMD and survived small volume correction. The ACC has been associated with attention/vigilance, error detection, anticipation of task, motivation and modulation of emotional responses (Bush, Luu, & Posner, 2000; Casey et al., 1997; Drevets & Raichle, 1998). Increased cortical development and activity in the ACC has been shown to be coupled with increased IQ (Haier, Siegel, Tang, Abel, & Buchsbaum, 1992). The subgenual region is an important node in frontal-subcortical circuits serving a variety of functions such as appetite, sleep, mood and anxiety, memory formation and self-esteem (Miller & Cummings, 2007). Hyperactivity of the subgenual region has been associated with treatment-resistant depression (Mayberg et al., 2005). Higher cortical volume in the subgenual/ACC area, as well as greater regional CBF, may be associated with a general heightened status of attention, vigilance and/or regulation capability that may lead to better performance of IQ test. In the present study, the observed positive correlation between CBF and IQ in subgenual/ACC is not solely driven by the correlation between regional cortical volume and IQ, as it became more significant after adjusting GMD. Thus, hyperperfusion in subgenual/ACC may reflect hyper-metabolism in addition to increased cortical volume. Given the widespread anatomical links between the subgenual/ACC and the prefrontal cortex, insula and subcortical circuits, we hypothesize this region may be a central node of the brain’s network underlying individual differences in intellectual development throughout childhood and adolescence.
IQ is typically thought to increase with age (Wechsler, 1974). However, in our sample, no correlation between age and IQ was obtained. This is somewhat expected given that the IQ measure (WASI) was designed to account for age effects. In addition, there is an uneven distribution of younger subjects compared to adolescents (29 subjects 7-12 years of age, 12 subjects 13-17 years of age) in our sample. There was not enough power in the existing cohort to perform stratified analysis in different age groups. Nevertheless, we attempted to adjust various confounding factors by performing multi-variate regression analysis. An increased sample size, in addition to a more normally distributed sample (age and IQ) may reveal a more robust relationship between IQ and age.
In conclusion, this study reports preliminary findings of CBF changes in typical children and adolescents and their associations with intellectual development. Furthermore, these data indicate that CBF, measured by ASL, is able to delineate regions where CBF is modulated by IQ. By comparison with cerebral morphometry, the present study provides functional evidence supporting the Parieto-Frontal Integration Theory of intelligence. CBF in the subgenual/ACC area demonstrates the highest correlation with IQ, after adjusting for the effect of regional cortical volume. This work represents an important initial step within a larger study examining the relationship between CBF changes and the development of intelligence.