The Aeon Patch is designed by its manufacturer as a unique and novel organic nanoscale patch that mildly stimulates a specific acupuncture point (CV6) to reduce “
Heart Rate Variability (HRV) signal refers to beat-to-beat variation of heart rate (HR) and represents the cyclical changes in HR. As HR is modulated by both parasympathetic and sympathetic inputs of the ANS, HRV can be utilized as an indirect and non-invasive marker of autonomic regulation and control under different physiological conditions (McMillan, 2002). High HRV reflects an ANS that is adaptable and dynamically responsive to change whereas reduced HRV is indicative of an abnormal or restricted ability of the ANS in maintaining homeostasis (McMillan, 2002; Pumprla et al., 2002). Pharmacological studies and spectral analysis of the HRV signal have revealed two clear peaks in its power spectrum: a High Frequency (HF) and a Low Frequency (LF) component. The HF peak which is typically centered on 0.25 Hz (0.15 – 0.4 Hz) arises from the coupling of the respiratory and cardiac cycle and is termed Respiratory Sinus Arrhythmia (RSA). Vagal blockade abolishes this HF peak suggesting that it is parasympathetically mediated. The LF peak, which is typically centered around 0.1 Hz (0.05 – 0.15), arises from blood pressure changes (Mayer-waves) and can be modified by both vagal and sympathetic blockade and therefore reflects both sympathetic and parasympathetic influences (Pumprla et al., 2002). The spectral band 0.003 - 0.05 Hz, known as Very Low Frequency (VLF), is possibly related to the long-term regulatory mechanisms. A better measure of sympathetic modulation is the LF/HF, which is indicative of the balance between sympathetic and parasympathetic activity (sympathovagal balance) with a low frequency bias suggesting sympathetic dominance. The LF/HF is an index that relates the
A number of research studies in recent years have confirmed that higher variability in HR is indicative of a healthy ANS, while reduced variations in the HR is a sign of diseased or pathological state. Hundreds of research articles have been published on applications of HRV signal analysis. These articles have explored the relationships between HRV signal and blood pressure, myocardial infarction, nervous system, cardiac arrhythmia, diabetes, respiration, renal failure, gender, age, drugs, smoking, alcohol consumption, to name a few (Malik, 1996). HRV signal analysis seems to become even more popular in quantitative patient data analysis in the future. In short, HRV signal analysis provides a quantitative marker of the autonomic nervous system as the regulation mechanisms of beat-to-beat variations in the HR originate from the sympathetic and parasympathetic arms of the ANS.
Previous double-blind-placebo-controlled clinical studies in humans have shown that LifeWave patches produce a thermoregulating effect by mild stimulation of the acupuncture points on the body, promoting the parasympathetic nervous system activity. This parasympathetic dominance has a relaxing, stress reducing, or skin cooling effect (Nazeran, 2007; Nazeran et al., 2012). This in turn elicits targeted physiological responses.
To provide quantitative evidence and substantiate the claims that Aeon Patch reduces
The study protocol was reviewed and approved by the National Foundation for Energy Healing (project#10-05-11-17). Participants were asked to keep well-hydrated and avoid taking any medications one day before data collection or drinking any stimulants (i.e. coffee) in the morning before participating in data collection. To assure adequate hydration, water bottles were provided to the subjects prior to the intervention and data collection. The study excluded subjects with cardiovascular disorders, those on 4 or more medications, those who were terminally ill, or had received chemotherapy in the last 12 months, those who had surgery in the previous 12 months, and those with HIV, and pregnant women. Both the investigator and the volunteers were blind to the A and P Patches as they looked exactly the same, were marked as Set 1 and Set 2 by the manufacturer (LifeWave LLC, San Diego, California, USA), and were assigned to subjects in a random fashion by the investigator through the research assistant responsible for data collection. So each subject could have been assigned to wear from either Set 1 or Set 2 first followed by wearing a patch from the other set next. ECG data collection involved using a CleveMed BioRadio 150 (Cleveland Medical Devices Inc, Cleveland, OH, USA) device, and a Dell XPS laptop computer (Dell Inc, Austin, TX, USA). Three disposable Ag/AgCl electrodes were applied to the right wrist (RA), left wrist (LA), and right ankle (RL as reference) after proper cleaning and preparation of the skin at the bioelectrode application sites.
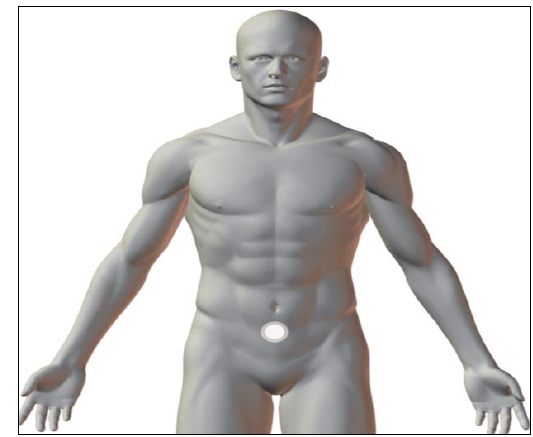
After giving informed consent and filling out a demographic form, 50 well-hydrated volunteers [21 females and 29 males, age: 19 - 79 (33.1 ± 14.5) years, weight: 117 - 334 (177.5 ± 51.5) lbs, height: 5'-6',3'' (5',7'' ± 4'')], participated in ECG data collection under 3 different conditions for a total duration of 15 min (5 min/condition). Condition1: C - while wearing no Patch, Condition 2: P or A - after wearing either the Placebo or the Aeon Patch for 20 min, and Condition 3: A or P - after wearing either the Aeon or the P Patch for 20 min. There was a washout period of 15 min between Conditions 2 and 3. The investigator, research assistant, and volunteers were blind to the A and P Patches as they looked exactly the same, were marked as Set 1 and Set 2 by the manufacturer, and were assigned in a random fashion by the investigator. The subjects were instructed to apply the A or P Patch about 2 inches inferior to the navel (below belly button) on the
ECG data acquired (during 2011 and 2012) from the volunteers were quality assured offline and were recorded in a digital data base. These stored data were then processed to derive the HRV signals by deploying advanced digital signal processing/analysis algorithms, codes, and instructions developed at the Massachusetts Institute of Technology (MIT) and Harvard Medical School, which are available from PhysioNet or PhysioBank website [http://www.physionet.org /physiobank/]. To perform short-term HRV signal analysis, ECG signals from each volunteer were recorded for three 5 min intervals during each condition, while wearing no patch C or wearing either a P or an A Patch for 20 min.
Power spectral analysis of HRV signals provides the basic information on how power within the signal is distributed as a function of frequency. Variations in the HR, occurring at the spectral frequency band of 0.15 - 0.4 Hz, known as HF band, are indicative of parasympathetic (vagal) activity. Variations in the spectral band 0.05 - 0.15 Hz, known as LF band, are linked to the sympathetic modulation, but this component includes some parasympathetic influence (sympathovagal influences). The spectral band 0.003 - 0.05 Hz, known as VLF, is possibly related to the long-term regulatory mechanisms. It is well established that the level of
The spectral components, namely the VLF, LF, HF and LF/HF of the HRV signals, as well as a number of HRV time-domain, frequency-domain and nonlinear dynamics measures were calculated from 5-min ECG recordings under 3 different conditions while wearing no patch or wearing the P or A Patches for 20 min. Kubios HRV – Heart Rate Variability Software Analysis Software developed by the Biosignal and Medical Imaging Group at the University of Eastern Finland was used to calculate the time-domain, frequency-domain (spectral), and nonlinear dynamics features of the HRV signals [http://kubios.uku.fi/]. The power spectral components of the HRV signals were determined in normalized units (n.u.), which represent the relative values of each power component in proportion to the total power minus the
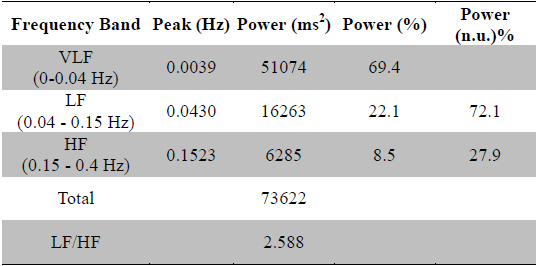
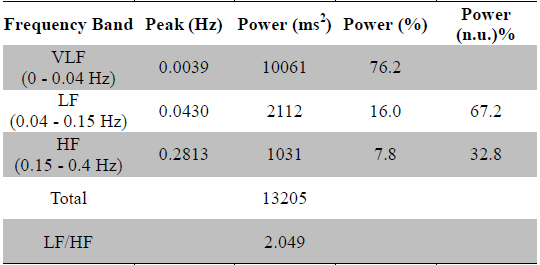
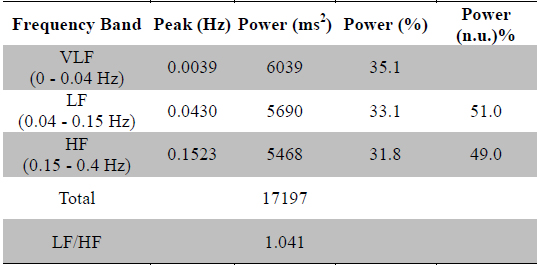
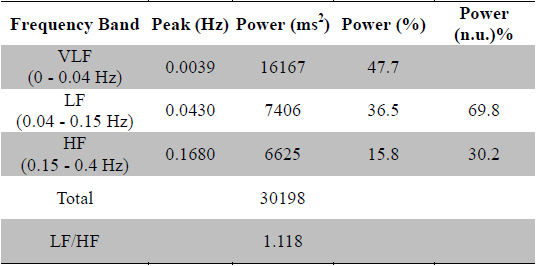
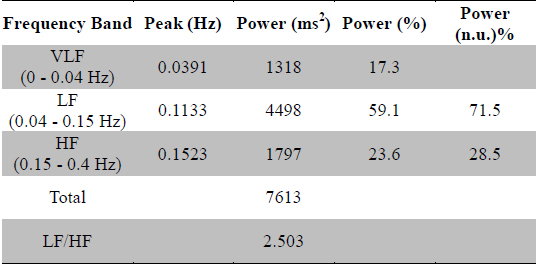
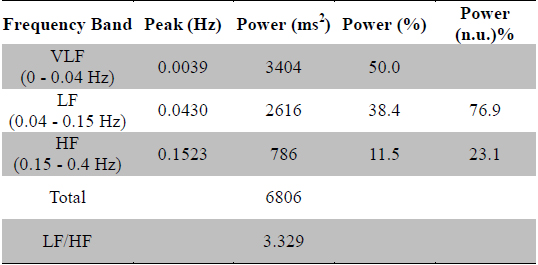
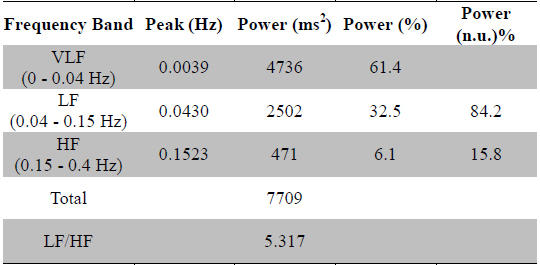
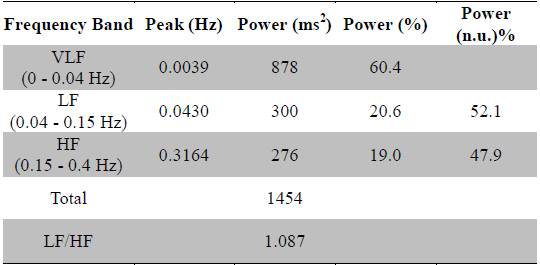
Tables 1a, 1b, and 1c show the results of frequency-domain analysis of 5 min long datasets acquired from a healthy female subject (Age: 27 years old, Weight: 150 lb, Height: 5', 8'') under 3 different conditions: baseline or C, wearing the P Patch for 20 min, and wearing the A Patch for 20 min, respectively as an example. Comprehensive HRV analysis results and graphs for this female subject under these conditions as produced by the Kubios-HRV Analysis Software are available electronically from the author upon making an email request.
[Table 1a.] HRV spectral analysis results for C condition (healthy 27 years old female subject)
HRV spectral analysis results for C condition (healthy 27 years old female subject)
[Table 1b.] HRV spectral analysis results for P condition (healthy 27 years old female subject)

HRV spectral analysis results for P condition (healthy 27 years old female subject)
[Table 1c.] HRV spectral analysis results for A condition (healthy 27 years old female subject)
HRV spectral analysis results for A condition (healthy 27 years old female subject)
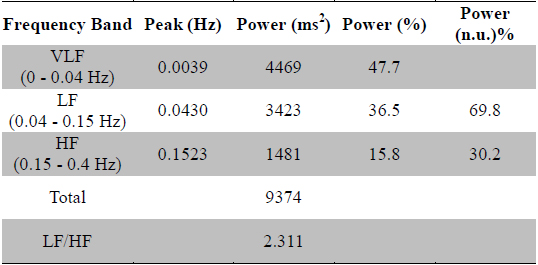
Tables 2a, 2b, and 2c show the results of frequency-domain analysis of 5 min long datasets acquired from a healthy male subject (Age: 25 years old, Weight: 250 lb, Height: 5', 10'') under 3 different conditions: baseline or C, wearing the P Patch for 20 min, and wearing the A Patch for 20 min, respectively as a second example. Comprehensive HRV analysis results and graphs for this male subject under these conditions are available electronically from the author upon making an email request.
[Table 2a.] HRV spectral analysis results for C condition (healthy 25 years old male subject)
HRV spectral analysis results for C condition (healthy 25 years old male subject)
[Table 2b.] HRV spectral analysis results for P condition (healthy 25 years old male subject)
HRV spectral analysis results for P condition (healthy 25 years old male subject)
[Table 2c.] HRV spectral analysis results for A condition (healthy 25 years old male subject)
HRV spectral analysis results for A condition (healthy 25 years old male subject)
Spectral features of the derived HRV signals were used to assess the parasympathetic effect or the deep relaxation response elicited
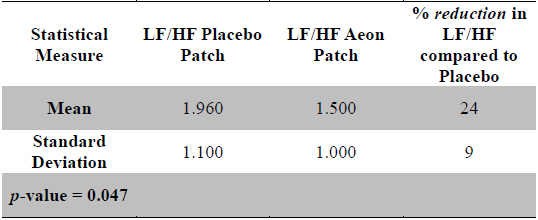
Statistical measures for LF/HF for P and A conditions and % reduction of LF/HF Active: Placebo (n = 30)
Statistical analysis (one-sample inference) was used to compare the LF/HF of the responders under these 3 different conditions. The normalized LF/HF indicative of sympathovagal balance decreased significantly (24% ± 9% after 20 min) in condition A compared to condition P with a
To evaluate the effectiveness of the Aeon Patch in eliciting a deep relaxation response
[Table 4a.] HRV spectral analysis results for C condition (healthy 28 years old male subject)
HRV spectral analysis results for C condition (healthy 28 years old male subject)

HRV spectral analysis results after wearing the Aeon Patch for 1 h (healthy 28 years old male subject)
HRV spectral analysis results after wearing the Aeon Patch for 2 h (healthy 28 years old male subject)
From the spectral analysis of the HRV signals of 5 min recordings of ECG datasets acquired in this study population and the statistical analysis of the results for 50 subjects, the following observations could be made:
1. There was a nearly significant difference (
2. After wearing the Aeon Patch, the majority of the participants (60%) called the responders could achieve stress relief within as early as 20 min. The degree of stress relief or relaxation response in responders due to wearing the Aeon Patch ranged from 2% to 56%. This is indicative of the fact that different individuals relax at different rates under the influence of these patches.
3. There was a consistent
4. There was an
5. There was a
6. There was a large
7. A statistical comparison was performed between the average male and female LF/HF values in all the responders. No statistically significant differences (
Based on these observations it could be concluded that wearing the Aeon Patch for 20 min elicited an enhanced parasympathetic response and could enable the majority of the participants to achieve a reduced stress state with varying degrees. This response could be quantified by a reduction in normalized LF/HF power. The single subject investigation revealed that the effectiveness of Aeon Patch in causing a stress relief increases with time. The statistical results revealed that the Aeon Patch showed a significant effect (