The vessel traffic service (VTS) is being used in the major ports and coastal areas across the world for ensuring the safety and reducing the risk of maritime transport, based on Article 36 of the Maritime Safety Act (20), Article 28 of the Open Ports Rules and Regulations, and the IMO RESOLUTION A.857 [1, 2]. All ships are required to be participating in the VTS system and navigating along the designated routes in the VTS areas. At this time, a VTS operator (VTSO) is assigned to provide the ships with proper information on traffic patterns or relevant traffic situations [3-6]. However, such operating methods might involve errors or mistakes made by individual VTSOs because the current VTS operating system cannot display any information regarding the ships’ routes or related tracks within harbor limits [2, 7-10]. The dead reckoning positions (DRPs) in the current operating system might be reliable at open sea where the sailing courses are mostly straight and rarely change, but are unsuitable for sailing within harbor limits, which witness frequent changes in the course and speed [2, 11-13]. In a previous study, Kim et al. [2, 11] tried to enhance the visibility of the DRPs of ships by locating them on their planned routes. They suggested that the main function of VTS activities should be not only providing traffic information but also predicting the traffic situation of every ship in advance, and that it might happen in the near future. In this study, the DRPs of ships were calculated using the Mercator sailing method and displayed on their planned routes or tracks, based on the data received in real time. The traffic patterns and navigational behaviors of the ships were acquired from the navigational data collected from the automatic identification system (AIS) and analyzed using MATLAB. Geo-referenced navigation and Mercator sailing formulas were used for constructing the sailing routes or passages of the ships. The planned routes were applied to the DRP calculations for increasing the reliability of the DRPs. Two randomly chosen ships were simulated for verifying the reliability of the proposed DRP calculations.
Dead reckoning (DR) is the process of determining and predicting a body’s present and future positions, respectively, by projecting the course and speed of its movement from its known past and present positions, respectively [14, 15]. The position determined through the above process is known as the DRP. The use of DR will vary with the type of system used as the primary plotting method. The electronic charts display and information system allows the display of a ship’s heading projected to a future position.
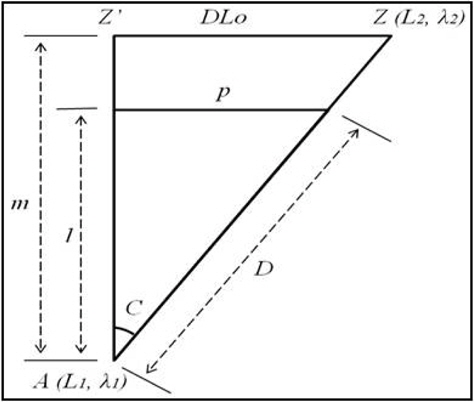
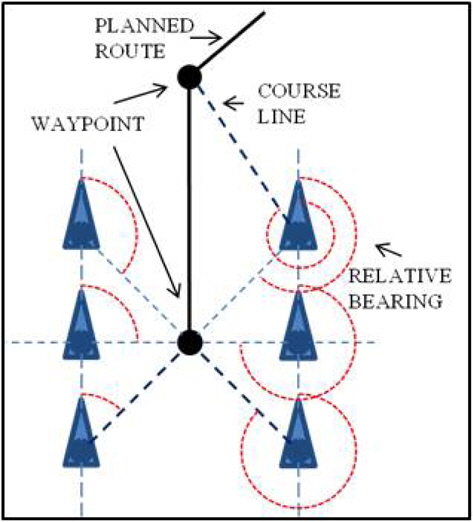
The variables in Figure 1 are defined as follows:
A ship’s DRP can be obtained by using Mercator sailing calculations. If the ship sails from

After solving for course angle using the Mercator sailing formula, the distance can be obtained using the plane sailing formula, as follows:

In these formulas, the given values are

However, the above DRP calculations might be useful only in the open sea where changes in the courses of movement and speeds of ships are rare.
As shown in Figure 2, the above formulas are unreliable when ships are within harbor limits, because of the errors that result from frequent changes in their courses and speeds. Additionally, a ship’s actual positions follow the next waypoint when it deviates from the original planned route because its tracks converge on the next waypoint.
3. Application of Planned Route
3.1 Method of Calculating DRP for Planned Route
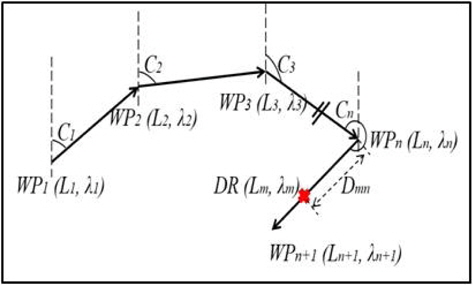
If a ship’s present position is defined as

Meanwhile, the DRP at certain minutes

As shown in Figure 3, the DRP at certain minutes

Using these calculations and concepts, each traffic situation can be prioritized and predicted in advance, with displayed diagrams. This facilitates early identification and prevention of dangerous traffic situations.
As the distance between each pier and the anchorage is usually small owing to the narrowness in the harbor limits, it is possible for a ship that commenced sailing in the harbor limits to have more than one reference waypoint. Therefore, pointing at the correct reference waypoint is extremely important for determining an appropriate planned route, for the purpose of applying the proposed DRP calculations and prediction systems.
As shown in Figure 4, the reference waypoints of a ship are determined once it commences its maneuvering. The procedures for determining the waypoints are as follows:
1) Search and select the nearest waypoint based on the distance between the present position and the waypoint. 2) Calculate the relative bearing with the selected waypoint. 3) Judge as “true” or “false” based on the below processes (θ : Relative bearing with the selected waypoint): a. True: Refer to the nearest waypoint. (000° ≤ θ < 090° or 270° < θ ≤ 360°) b. False: Find the next waypoint (090° ≤ θ ≤ 270°) 4) Apply and create an optimal route.
The development of a plan for a voyage or passage, and the close and continuous monitoring of a ship’s progress and position during the execution of such a plan are important for the safety of life at sea, safety and efficiency of navigation, and protection of the marine environment. All information relevant to the contemplated voyage or passage should be considered, including the following factors [16]:
1) Conditions, states of the vessel, stability and equipment 2) Limitations, permissible draught, and restrictions 3) Special characteristics of the cargo, stowage, and securing on board 4) Provision of a competent and well-rested crew 5) Requirements for up-to-date certificates and documents 6) Appropriate scale, accurate and up-to-date charts, relevant permanent or temporary notices to mariners, and existing radio navigational warnings 7) Accurate sailing directions and lists of lights and radio aids available for navigation 8) Any relevant up-to-date additional information
However, acquiring all the above information is virtually impossible in shore sides or VTS centers. Furthermore, the navigational patterns in the harbor limits are decided by restricted external factors such as local rules and regulations, designated passages, unexpected navigational environments at the port, and other hydrographical, hydrological, and meteorological elements. Therefore, a past ship’s tracking data were used in this study for recreating the planned routes.
The VTSOs receive the ships’ voyage reports that outline their every move, and adjust their traffic situations in advance by providing proper information by means of predicting the ships’ movements, traffic routes, and encountering situations. However, these tasks involve not only heavy workload or stress but also carry the risk of misjudgment by individual VTSOs. Because the DR process is mostly executed based on the situation awareness of an individual VTSO, more accurate routing data are required for predicting the encountering traffic situation in advance [2, 11].
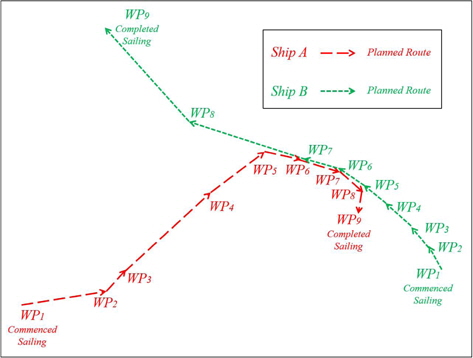
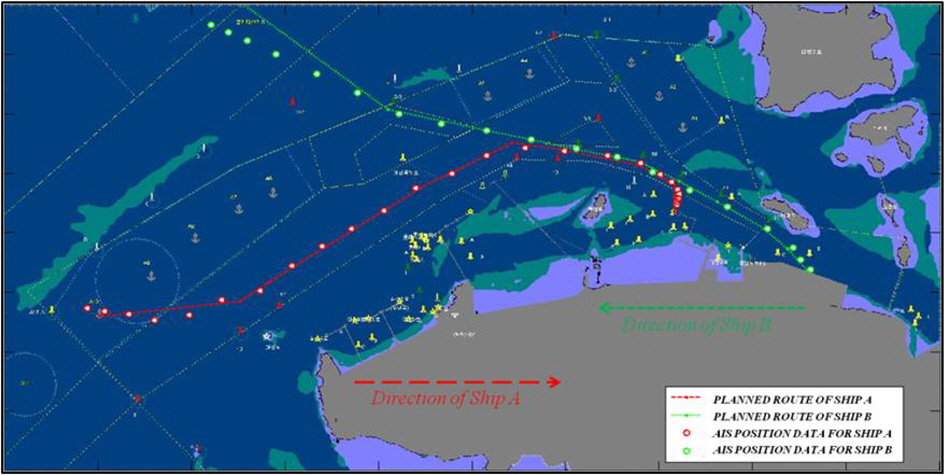
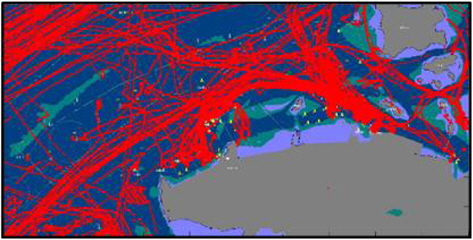
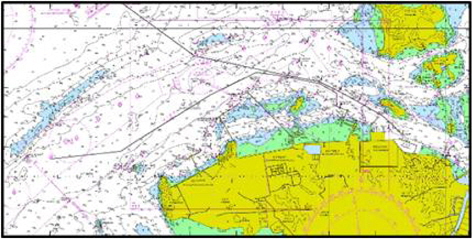
Figure 5 shows the result of the analysis of traffic patterns using the accumulated AIS track data on the Daesan harbor limits during the day. This analysis was conducted for recreating the planned route from the point of commencement of a ship’s sailing to the point of completion within harbor limits. The planned routes designed for two ships, named Ship A and Ship B, can be seen in Figures 6 and 7. The passage planning was conducted based on geo-referenced navigation with the help of qualified ship deck officers and VTSOs.
The position data and dynamic information on the ships A and B were collected from the AIS. These data were plotted on a chart every three minutes, as shown in Figure 8.
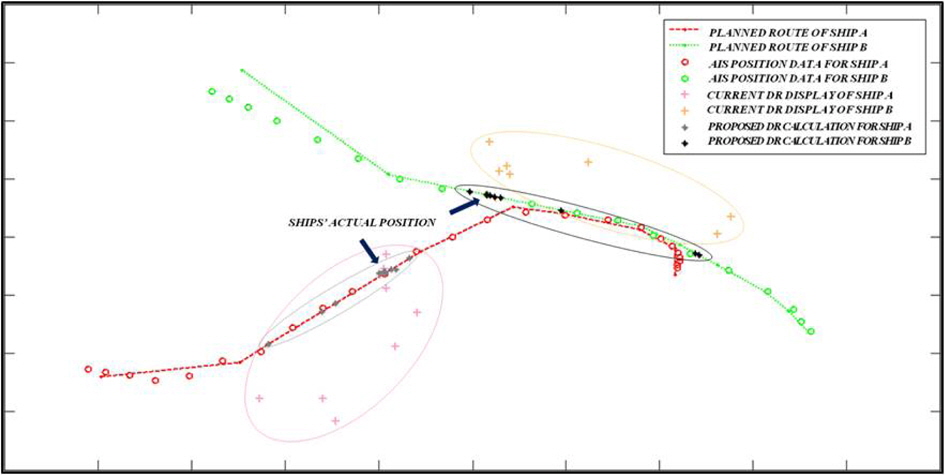
The coordinates of the calculated DRPs were plotted on the chart every three minutes from the time of commencement of the ships’ sailing, based on the track data available for them. The results of the comparisons between the current operating system and the proposed calculation method are shown in Figure 9.
In the proposed calculation method, the DRP coordinates of ships A and B are distributed evenly on the lines of the planned routes. In contrast, huge differences were noticed between the positions before and after the altering courses or changing speeds, determined using traditional DRP calculations. If the ships’ tracks do not deviate from the original planned routes, the DRPs would be located on the rhumb line of the planned routes. The coordinates of the actual target positions were seen to be closer than those obtained from the current system. The proposed DRP calculations can, therefore, reduce the errors of the present system substantially. In the event of the ship deviating from the initial planned routes (as a result of collision-avoidance actions etc.), a new passage or track will be created through waypoint tracing. The newly created course will converge with the original route or the next waypoint because this course will be heading to the next waypoint.
Simulation was performed to validate the proposed DRP calculations and the proposed method. The data were compared with the calculations obtained using traditional method, for the purpose of verifying the proposed method’s reliability. The simulation revealed that recreation of reliable planned routes is one of the most important tasks in the utilizations of DRPs and prediction systems. Through simulation, this study demonstrated that the proposed DRP calculation method is more reliable than the traditional ones. The proposed method is expected to contribute towards improving the ability of the VTSOs and sailors in predicting the multilateral encountering traffic situations in harbor limits. Henceforth, this method needs to be developed further, along with the other available methods for diverse ships, through big data processing of various elements such as planned routes, sizes, types, and traffic patterns of various ships over a time period. Another meaningful area of research would be analyzing the traffic characteristics of ships under similar conditions on marine fields. The accumulated and categorized data can be then applied to other similar types of ships or marine conditions.

![Fundamental concept of mercator sailing formula [6].](http://oak.go.kr/repository/journal/17279/E1FLA5_2014_v14n4_288_f001.jpg)


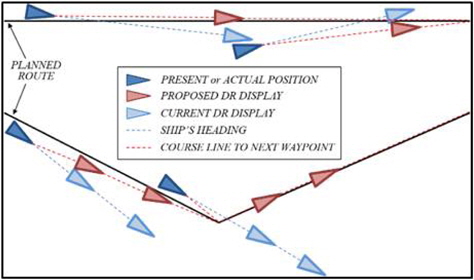


![Proposed method of dead reckoning (DR) position calculation [11, 12].](http://oak.go.kr/repository/journal/17279/E1FLA5_2014_v14n4_288_f003.jpg)