Bulk analysis of environmental samples is one of the most powerful techniques for monitoring undeclared nuclear materials and activities around nuclear facilities. The total amounts and average isotopic compositions of nuclear materials in a whole swipe sample can be estimated from this technique, and can reveal the presence of undeclared nuclear activities.1-4 Environmental samples containing nuclear materials are typically collected with cotton swipes by authorized inspectors from the International Atomic Energy Agency (IAEA) and distributed to the network of analytical laboratories (NWAL). Generally, the analytical procedures for bulk analysis can be divided into three parts: 1) chemical pretreatment for total digestion of the sample, 2) chemical separation for obtaining the pure elements (uranium and plutonium in most cases), and 3) quantification and isotopic measurements based on mass spectrometry or other analytical techniques. The NWAL laboratories have performed this analysis with their own chemical procedures and measurement schemes.5
Recently, various verification processes were performed to obtain reliable results from the new CLASS (Clean Laboratory for Analysis of Safeguards Samples) facility. For the chemical separation, we combined extraction chromatography using a UTEVA and ion exchange resin (AG MP-1) with thermal ionization mass spectrometry (TIMS) to cleanly separate plutonium and uranium isotopes. Several fundamental studies regarding chemical separations,6 redox behavior of plutonium,7 evaluation of uranium process blanks,8 and improved bulk analysis performance using TIMS9 have been reported.
For the simple and rapid analysis of environmental swipe samples, we also used a new multi-collector inductively coupled plasma mass spectrometer (MC-ICP-MS) for bulk analyses. MC-ICP-MS has proven to be a valuable technique for detecting long-lived radionuclides including uranium and plutonium. The technique has excellent detection limits at sub-picogram levels, which is comparable to TIMS.
This paper briefly introduces the results of a study in which suitable analytical procedures were used for a single column system with a UTEVA resin in tandem with MC-ICP-MS measurements. This methodology was developed for bulk analysis by the Korea Atomic Energy Research Institute (KAERI). Based on appropriate mathematical models and data processing (obtained from mass spectrometry) of process blanks, swipe blanks, and simulated swipe samples, corrective processes for estimating the total amounts and isotopic ratios of uranium and plutonium contained in simulated swipe samples are discussed. The total amounts and isotopic ratios were compared with certified values to validate the techniques, and the methodology was compared with the procedure adopted for bulk analysis based on the NWAL quality goals recommended by the IAEA.
Sample preparation
One set of samples consisting of three simulated swipe samples, one swipe blank, and one process blank were prepared. Each simulated swipe sample was independently prepared with a cotton swipe (10×10 cm, Textype, TX 304) containing a certain amount of uranium (NBS U030, ca. 10 ng) and plutonium (REIMEP 16C, ca. 3 pg) standard reference materials with certified isotopic ratios. The samples were identified as follows:
All of the analytical processes were performed in the CLASS facility and complied with the QA/QC system of the KAERI. All chemical processes, such as sample pretreatment, ashing, acid digestion, separation, purification, and reagent preparation were conducted in an ISO Class 5 (Class 100) area. The analytical instruments used for the isotopic measurements were installed in an ISO Class 6 (Class 1,000) area.
Three simulated swipe samples and one open swipe blank were placed in separate quartz crucibles. An additional empty crucible was prepared as a process blank. The crucibles were closed with quartz lids to avoid crosscontamination. Each crucible was covered with a quartz beaker to protect from additional contamination and then placed in a muffle furnace. The ashing process was conducted until the samples were completely decomposed. Sequential acid digestions were carried out with (1) 2 mL of concentrated HNO3 and 0.1 mL of H2O2, (2) 2 mL of concentrated HNO3 (twice), and (3) 2 mL of aqua regia. The decomposed samples were dissolved in 10 mL of 8 M nitric acid (Seastar, all metal impurities less than 10 ppt) followed by filtration to remove the insoluble residue. The resulting ‘mother solution’ was precisely weighed.
A mother solution was divided into three portions for analysis by isotope dilution mass spectrometry (IDMS) (40 wt%), for isotopic measurements (40 wt%) and for archival purposes (20 wt%). The pre-screening solution was prepared by taking an appropriate portion from each archival mother solution (100, 100, and 500 µL of the solution containing the simulated swipe, open swipe blank, and process blank, respectively) and transferring it to a separate PFA vial (Savillex, USA) and diluting with DI water to make 1 mL of solution. The amounts of uranium and plutonium in each mother solution used in the prescreening measurements were estimated by the 238U and 239Pu signal intensities from MC-ICP-MS analysis. 233U (IRMM 040a) and 242Pu (IRMM 085) spike isotopic reference materials were added to the solution so that IDMS could be used. The spike quantities were determined by careful weighing of the spiked solutions.
A modified chemical separation scheme for MC-ICPMS was adopted; it used a single column system with UTEVA resin (Eichrom, 100-150 mesh). UTEVA column was preconditioned with 8 M HNO3 . After conditioning the column with 2 mL of 8 M HNO3 and 20 µL of 30 wt% H2O2 , the sample solutions from chemical pre-treatment steps were loaded onto the column. The container with the sample solution was rinsed with 2 mL of 8 M HNO3 and the rinse was loaded onto the column as well. The plutonium isotopes were eluted through the column into a conical PFA vial with Pu eluent (2 mL of 8 M HNO3 /0.02 M ascorbic acid/0.02 M NH2 OH·HCl) followed by washing with 0.5 mL of 9 M HCl and 0.5 mL of 5 M HCl/ 0.05 M oxalic acid, respectively. Finally, the uranium isotopes were eluted with 2 mL of 0.01 M HCl solution. To eliminate the excess complexing agents in the Pu eluted solution, 100 µL of H2O2 (30%, Sigma-Aldrich) was added to the solution, which was then completely dried at 140°C and then re-dissolved in 1 mL of 3% HNO3 .
MC-ICP-MS (Neptune Plus, Thermo Scientific) equipped with nine Faraday collectors and five ion counters was used for the isotopic measurements. The ion counters consisted of three secondary electron multipliers (SEMs) and two compact discrete dynodes (CDDs). The instrument was operated in the low mass resolution mode (m/∆m = 400). A desolvation system (Aridus II, CETAC), consisting of a membrane desolvator and a spray chamber coupled with a PFA nebulizer with a nominal uptake rate of 100 µL/min, was attached to the MC-ICP-MS to improve signal sensitivity and to reduce oxide formation. The nebulized aerosol of each sample was introduced continuously into the spray chamber heated at 110 ℃. The argon gas swept the solvent vapor into the porous wall of the heated membrane desolvator. The tuning windows for controlling the torch position, the amount of instrumental gas, and the ion lenses were routinely adjusted to optimize and stabilize the sensitivity and the ion beam intensity, respectively.
>
Isotopic measurements and quantification with MCICP-MS
The isotopic ratios of uranium and plutonium were determined by simultaneous measurements using MC-ICPMS. The cup configurations are shown in Table 1. For the isotopic measurements for uranium, unspiked solutions obtained from the chemical separation were additionally diluted with 3% nitric acid to prepare a 100 ppt solution. For mass bias corrections, analyses of the uranium standard (U030) were performed at the beginning and end of each batch of samples. Additional analyses of the uranium standard (U030) were performed every three consecutive sample analyses. The same mass bias corrections were done for the plutonium analysis using the plutonium standard (IRMM 290A1). For each sample, the peak intensities were measured 30 times and the average peak intensities with their uncertainties for each uranium (or plutonium) isotope were calculated. The 3% nitric acid solutions were analyzed using the same method as that used for the sample analyses and was subtracted from the sample peak intensities.
[Table 1.] Cup configurations used for the simultaneous measurement of U and Pu isotopes
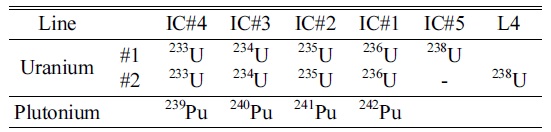
Cup configurations used for the simultaneous measurement of U and Pu isotopes
We determined the uranium isotopic ratios from the isotopic measurements and the amounts of uranium in the sample and process blanks. The measured isotopic ratio was obtained by combining the isotopic ratios of a sample and a process blank as follows:
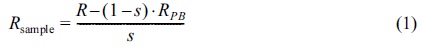
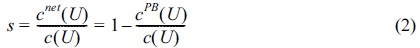
where Rmeas is the measured isotopic ratio, Rsample and RPB are the isotopic ratios of the sample (or swipe blank) and the process blank, respectively, s is the contribution factor, cnet (U) is the net amount of uranium in the sample solution, and cPB (U) and c(U) are the amounts of uranium in the process blank and sample solutions, respectively. The same procedure was applied to calculate the plutonium isotopic ratio.
As noted above, the amounts of uranium and plutonium contained in each sample were determined by IDMS using 233U (IRMM 040a) and 242Pu (IRMM 085) spike isotopic reference materials. Uranium was analyzed by IDMS as follows. Faraday cups were used to determine the intensities of 233U and 238U, and SEMs were used to measure the intensity of 235U. The same cup configurations were used for analyzing plutonium by IDMS to determine the plutonium isotopic ratio. The mathematical equations used for uranium and plutonium quantification have been reported elsewhere.10 The net amount of 238U (

The total amounts of 238U and U (i.e., all uranium isotopes) in a sample mother solution were determined using Equations 4 and 5:

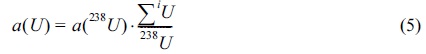
where,
The same mathematical model was used for the analysis of plutonium.
>
Evaluation of uranium and plutonium backgrounds in the process blank
As part of the validation processes, we regularly estimated the amounts of uranium and plutonium backgrounds in the process blank and investigated their effects on the correct mass determination and the blank level during bulk analysis. Generally, the uranium backgrounds in a process blank are good indicators not only of the cleanliness of the experimental environment, analytical instruments, chemical reagents, and other labware used in the analytical procedures, but also of cross-contamination during the whole analytical procedure. Since the CLASS facility was established, the uranium and plutonium contents of process blank samples have been controlled to ca. 20 pg for uranium and < 0.05 pg for plutonium.11 Similar values for uranium (19.12 ± 0.12 pg) and plutonium (0.0220 ± 0.0016 pg) were estimated in this study, indicating that the overall analytical procedures and the experimental environments for bulk analysis were well controlled. Negligibly low amounts of uranium and plutonium were observed in the process blank.
>
Evaluation of uranium backgrounds in a swipe blank
Generally, environmental swipe samples contain a cotton swipe as well as the nuclear materials, including uranium and plutonium. Therefore, highly accurate and precise estimations of the total amount and isotopic ratios of uranium and plutonium in a swipe blank are required to determine the net amounts of uranium and plutonium in a swipe sample. The cotton swipes used in this study were obtained from the SAL (Safeguards Analytical Laboratory) of the IAEA for more consistent analytical results.
The isotopic ratios of uranium isotopes determined in the swipe blank are summarized in Table 2. The estimated amount of uranium background in the blank was 3.91 ± 0.05 ng.
[Table 2.] Uranium isotopic ratios of the swipe blank (SB, measured values)
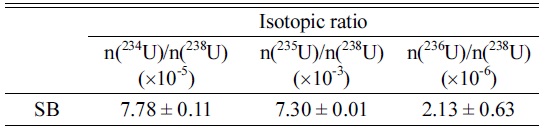
Uranium isotopic ratios of the swipe blank (SB, measured values)
>
Evaluation of uranium and plutonium in the simulated samples
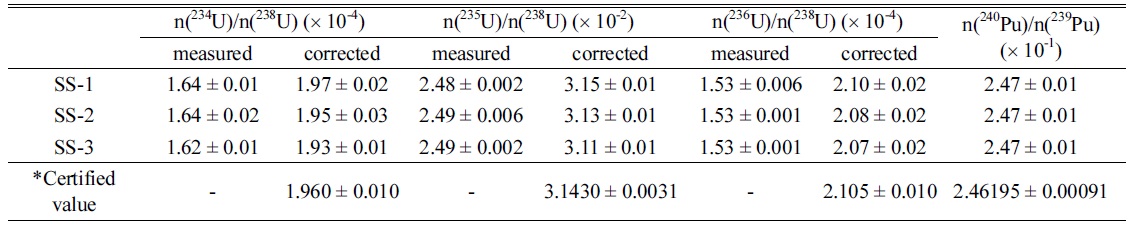
The results of the bulk analysis for quantity and isotopic ratios of the simulated environmental swipe samples are summarized in Tables 3 and 4. For the bulk analysis of environmental swipe samples, analytical results including the quantity and isotopic ratios of uranium and plutonium in the sample should be reported without correcting for the contribution of the swipe blank, because a blank swipe is lso considered a sample. However, for self-evaluation purposes, the results were corrected by simply subtracting the amount of the open swipe blank from the measured amount of each swipe sample. The accuracies of the amounts of uranium in each simulated swipe sample were 4.4, 4.2, and 8.8% for SS-1, SS-2, and SS-3, respectively, at the 95% confidence interval compared with the expected value that was the initial mass determined by weighing the uranium standard material. These accuracies satisfy the quality goals (recommended by the IAEA) for the uranium total mass, i.e., ≤ 40% for uranium at levels 10 ng/sample. We did not apply this correction when estimating the amount of plutonium, because of the negligible amount of plutonium in the swipe blank. The accuracy of the amount of plutonium in each simulated swipe sample was 11.0, 6.0, and 5.3% for SS-1, SS-2, and SS-3, respectively, at the 95% confidence interval. This also satisfies the quality goals for plutonium total mass, i.e., ≤ 20% for plutonium at levels 1 pg/sample.
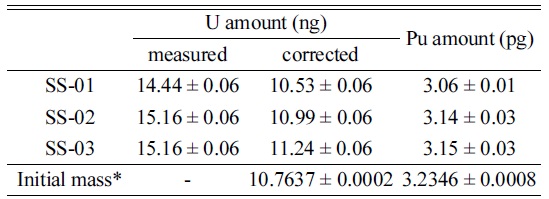
Amount of uranium (measured, corrected, and initial mass) and plutonium (measured and initial mass)

Isotopic ratios of uranium (measured, corrected, and certified) and plutonium (measured and certified)
Similar corrections were applied for the isotopic ratio analysis of uranium in the simulated swipe samples. In this case, the corrected isotopic ratios of uranium in each simulated sample were calculated based on Equations 1 and 2 by replacing
Through the evaluation of uranium and plutonium backgrounds in the process blank during a bulk analysis, we confirmed that the overall analytical procedures and experimental environments for the bulk analysis were well controlled. The analytical results for the isotopic ratios and the amount of nuclear materials in the simulated environmental samples as determined by MC-ICP-MS were in good agreement with the certified values. The accuracies of the total amounts (U and Pu) and isotopic ratios (234U/238U, 235U/238U, 236U/238U, and 240Pu/239Pu) in three different swipe samples met the quality goals for the analysis of bulk environmental samples recommended by the IAEA. We believe that our laboratory can produce reliable results for the bulk analysis of environmental swipe samples performed in the new CLASS clean facility using the MC-ICP-MS technique described herein.