Carbon-based nanomaterials, such as carbon nanotubes (CNTs) and graphenes, are of interest for chemical and materials engineering communities because of their excellent electrical and thermal conductivities, as well as mechanical properties. From the report of Novoselov,
Due to the weak van der Waals interaction between interspaced layers of graphites, the stacked layers of graphite can be easily intercalated by chemical treatment [17]. The use of strong oxidants such as KClO4 and KMnO4 allow graphites to oxidize and exfoliate their unit layers [18]. Graphene can be introduced by the reduction of the oxidized graphite layers, called reduced graphite oxide (rGO), which may be formed in thermal or chemical conditions [19,20]. Mechanical peeling, chemical vapor deposition, and epitaxial growth are well known as other useful methods to prepare graphenes [1,21-24]. However, chemical treatment such as oxidation and reduction can be a better method commercially for the cheap and bulk production of graphenes.
Prior to the preparation of reduced graphite oxides (rGOs) in chemical processes, graphites should be treated with a strong oxidant to make them graphite oxides (GOs) [25,26]. The properties of as-prepared GOs are dependent on the chemical treatments, as well as the pristine graphites. Finally, rGOs are made by the reduction of GOs, which have the oxidized groups deoxygenated chemically and/or thermally [27-29]. The properties of rGOs are related significantly to the structural defects, which are mainly made during graphite oxidation. Therefore, it is another important issue for graphene researches to recover the defects of rGOs during the reduction process.
In this work, we have treated pristine graphites with strong oxidation conditions to make GOs, and subsequently reduced them to make graphenes (as called “reduced graphite oxide”, rGOs). We used various processes for oxidation such as chemical or thermal treatment, and the combination of chemical and thermal treatments, as well as consideration of treatment sequence. A series of as-prepared rGOs were investigated structurally, thermally, and electrically.
All chemicals were reagent grade and used without further purification. GOs were prepared by the Staudenmaier method [25]; Graphite powders were oxidized by HNO3 (60%, Junsei Chemical Co.), H2SO4 (95%, Junsei Chemical Co.) and KClO3 (99.5%, Kanto chemical Co.). 5 g of graphite powders were added into the mixture of H2SO4 (90 ml) and HNO3 (45 ml) in an ice bath. KClO3 (50 g) was further added to the solution while stirring. The reaction mixture was allowed to reach room temperature and stirred for 5 days. After reaction completion , the resulting GOs were repeatedly filtered and washed with distilled water until the pH reached ~6.5.
As-prepared GOs were dried at 80℃ in a vacuum oven for 1 day. The GOs were chemically or thermally treated to prepare the reduced graphite oxides (rGOs). To prepare the reduced graphite oxide (rGO-C), which was reduced chemically, 100 mg of GO powders was loaded in 100 ml of distilled water. This aqueous GO dispersion was sonicated to become homogeneous. 1 ml of hydrazine hydrate (Sigma Aldrich Co.) was then added in the dispersion and heated at 100℃ for 24 h. As-prepared rGO-C was copiously washed with water and methanol, and dried under air flow. To prepare thermally-reduced GOs (rGO-T), GOs were thermally treated at 1,000℃ for 5 min. under Ar flow.
The other two rGO samples were prepared by combining both reduction methods as described in the above; chemically- and thermally-reduced graphite oxide (rGO-CT), and thermally- and chemically-reduced graphite oxide (rGO-TC).
Powder X-ray diffractions (XRD, PANalytical X’pert Pro MPD) were measured at 40 kV, which was equipped with a CuKααradiation (λ = 0.154 nm). The microstructures of as-prepared GOs and rGOs were characterized by field-emission scanning electron microscope (FE-SEM, Quanta FEG model), which was operated at 25 kV. X-ray photoelectron spectroscopy (XPS) data were collected by VG Scientific Escalab 250. Suvey and high-resolution spectra were obtained at resolutions of 1 and 0.05eV, respectively. Nitrogen adsorption measurements were performed at 77 K on ASAP2420 (Micromeritics, USA). The samples were out-gassed at 3 mTorr and 150℃ for 20 h prior to analysis. Thermogravimetric analysis (TGA) was conducted under nitrogen flow using a thermal analyzer (TGA-N-1000, Scinco). Raman spectra were taken at an excitation wavelength of 514 nm (operated at 40 mW) on a dispersive Raman spectroscopy (LabRAM HR UV/Vis/NIR, Horiba Jobin Yvon), which was equipped with Ar-ion CW laser. Nano-Secondary Ion Mass Spectroscopy (SIMS) mapping was conducted by CAMECA Nano-SIMS 50 ion microprobe (France). Nano-SIMS provides the capability recording five atomic mass images together simultaneously with a high spatial resolution of 50 nm, and can compare elemental distributions in the same position of the sample [30]. Cs+ ion was used for primary beam, and the impact energy and the current on sample were 16 keV and 0.4 pA, respectively. The raster size was 50 um × 50 um and 25 um × 25 um in all images, respectively. Samples were also simultaneously imaged by using the secondary ions (12C- and 16O-) that were detected by an electron multiplier. Sheet resistances of sample films were analyzed by using a Loresta GP resistivity meter (MCP-T610, Mitsubishi Chemical Co., Japan) connected with a four-pin probe. The inter-spacing between pins is 5 mm and the pin diameter is 2 mm. The spring pressure of pins is 240 g/pin.
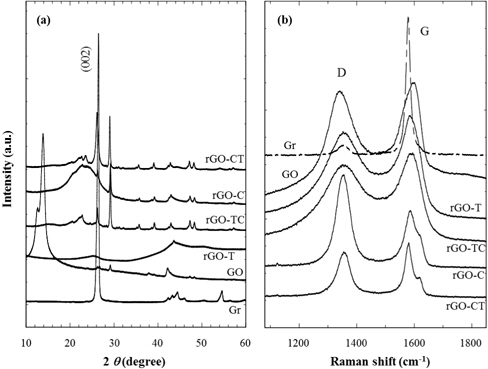
Prior to preparation of reduced graphite oxide (rGO), pristine graphite should be chemically treated to make the graphite oxide (GO). The reduction of as-prepared GO to rGO was achieved by thermal or chemical treatments. Fig. 1(a) and 1(b) show XRD and Raman results of graphite and its chemical analogs. As shown in Fig. 1(a), the intense (002) diffraction peak, which represents the interlayered spacing (d = 0.337 nm) of graphite, was distinctly found at 2 θ = 26.4°. It corresponds to the characteristic XRD diffraction of crystalline graphites. While the characteristic (002) diffraction of graphite disappears during strong oxidation treatment, new intense diffraction at 2 θ = 14.0° appears on the as-prepared GOs. This low-angled diffraction indicates that the inter-spacing (d = 0.632 nm) between unit layers of GOs are considerably expanded by the oxidized groups of GOs. In addition, XRD patterns of rGOs are compared in Fig. 1(a); rGOs were prepared by thermal, chemical reductions, and consecutive treatment of both thermal and chemical reductions. No characteristic diffraction was found in rGO-T, caused by the exfoliation of the stacked layers.
Meanwhile, the other reduced graphite oxides (rGO-C, CT, and TC) including chemical reduction showed the diffractions at 2 θ = 26.4° and 29.1°. The regeneration of the characteristic diffraction peak at 2 θ = 26.4° indicates that sheet layers of rGOs have restacked up by van der Waals forces during chemical reductions. The high-angled diffraction at 2 θ = 29.1° represents that some rGO sheets are stacked more densely than the original stacks of graphite during this chemical treatment. This result also shows that thermal reduction is a better method than chemical reduction to exfoliate the unit layers of graphite stacks. If electrical properties and structural perfection are not accounted for, it is the most effective to reduce the graphite oxide thermally.
The structural changes of GO and rGO, modified from graphite, were also analyzed by the Raman spectra of Fig. 1(b). Graphite (Gr) showed a strong G band of 1,580 cm−1 and a weak D band of 1,340 cm−1, in which the D band was caused by sp2 hybrid bond defects in the graphite plane [31]. The increased D band indicates that GO and rGOs have significant defects on their surfaces, which have been generated during the chemical oxidation of pristine graphites. In addition, these structural defects scarcely recovered through the reduction process as considering that Raman spectra of rGOs were not much different from that of GO.
The ID/IG ratio (Table 1), useful for the estimate of defects quantity, showed that the high ID/IG value of GO was due to the increase of surface defects compared to that of Gr. The ID/IG ratio of rGO-T, lower than that of GO, shows that although the effect was very slight, the thermal reduction was effective to recover the GO defects. The chemical reduction was also effective in the removal of the oxidized groups, such as -COOH and -OH, but did not contribute to the healing of structural defects considering the similar ID/IG values of rGO-TC, C, and CT as GO.

Intensity ratio of D- and G-bands obtained from the Raman spectra of graphite (Gr), graphite oxide (GO) and reduced graphite oxides (rGOs).
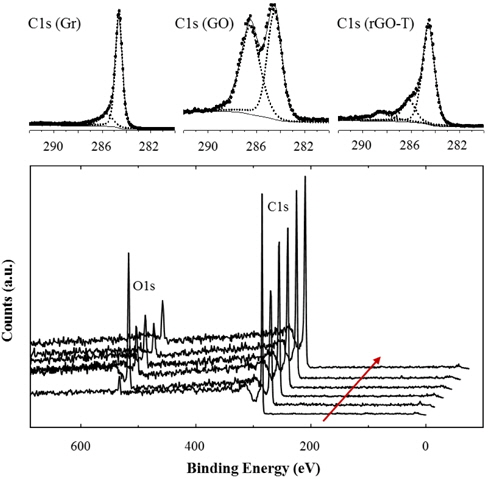
Figure 2 compares XPS results of various rGOs with graphite (Gr) and graphite oxide (GO). Although the XPS peaks were not normalized, the O1s peak sharply increased after oxidation treatment. This provides evidence that oxidized groups, such as -OH and -COOH, were introduced during the oxidation process. These oxidized groups may be introduced on the fringes of GO defects because the chemical reaction is generally active on the defect edges and particle boundaries. We will discuss this topic further in latter sections.
A small O1s peak of the pristine graphite was generated by the trace amount of oxygen and water adsorbed in the graphite. Various reduction processes like thermal and/or chemical methods further treated the GOs. Thus, O1s peaks considerably decreased in the rGOs, due to the significant removal of the oxidized groups on GOs. However, the higher amount of residual oxygen was identified from rGOs rather than pristine graphite. XPS peaks were deconvoluted to analyze and compare C1s peaks. C1s binding energy of rGO-T was analyzed in Fig. 2. Strong and weak peak elements were isolated from C1s (Gr) peak, whereas the higher additional peak elements were found in C1s(GO) and C1s(rGO); C-C peak at 284.6 eV, -C-O peak at 286.2 eV, and -O-C=O at 289.5 eV. The peak element of the oxidized carbon at C1s (GO) was comparably isolated from that of unoxidized carbon. This peak element of the oxidized carbon considerably decreased in rGOs. The deconvolution of C1s peaks on the other rGOs was analyzed similarly to the results of rGO-T. Similar to XRD and Raman results in the above, XPS analysis supports the relative change of oxidized groups, depending on the oxidation and reduction.
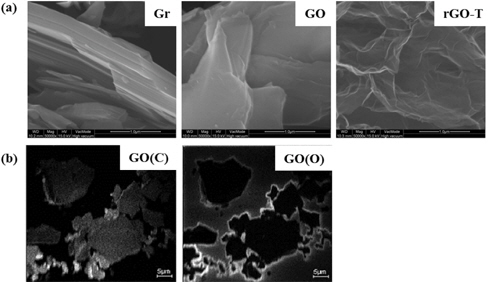
Microscopic morphologies of GO and rGOs are shown in Fig. 3(a). In addition, carbon and oxygen distributions of GO are compared by nano-SIMS mapping analysis in Fig. 3(b). The typical stacks of many layers were identified from graphite image (Gr). These layered stacks are maintained in the as-prepared GO after oxidation, but the boundaries of the stacks were significantly jagged.
Although rGOs treated in are somewhat distinguished from XRD results, their microstructures were similar to one another in FE-SEM images. rGO-T is shown in Fig. 3. Analysis of nano-SIMS mapping shows that the oxidized groups were modified, generally on the edges of GO sheets during oxidation treatment. The specific atom (carbon or oxygen) was probed in the bright region of nano-SIMS mapping; carbon atoms were evenly distributed through the entire GO sheet (GO(C)), but the oxygen atom was crowded on the sheet edges (GO(O)). This result was due to the higher reactivity of the structural edges, broken or defected particles as described in the above. Thus, graphites are oxidized easily on their structural edges during the oxidation process.
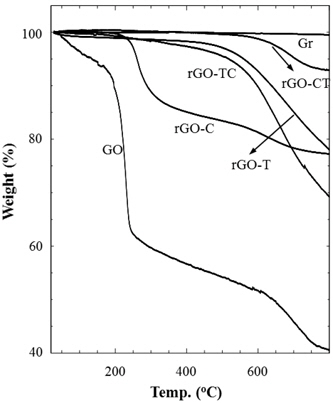
Thermal stabilities of graphite and their chemical analogs were investigated by thermogravimetric analysis (TGA) as shown in Fig. 4. Pristine graphite (Gr) was very stable in the entire temperature range. As compared to the graphite, GO considerably decomposed from the early stage along with the increase of temperature; residual water was gradually removed up to 200℃ and the abrupt decrease of weight at 200℃ was due to the elimination of oxidized groups. In the temperature region after 250℃, the gradual weight loss may be due to the carbon-carbon bond breaking, propagated from defects on GO sheets. rGOs reduced by chemical and/or thermal treatments of GO exhibited better thermal stabilities than GO. However, each rGO sample showed a slightly different behavior in thermal decomposition. rGO-CT looked similar to graphite on thermograms, but rGO-T amounts, TC, and C thermally decomposed. In addition, rGO-C left the final residue of the similar amount as rGO-TC and T, but the thermal decomposition of rGO-C began at the earlier stage rather than rGO-TC and T. The difference of thermal stability may be caused by the structural stability and reduction of rGOs. The ID/IG ratio (Table 1) supports that rGO-C has thermally decomposed from the lower temperature because the structural defect of rGOC was relatively serious compared to rGO-TC and T. However, the improved thermal stability of rGO-CT, which had a similar ID/IG ratio to rGO-C, might result from the high extent of reduction. Although not mentioned in the above XPS analysis, we have found from the deconvolution of the C1s peak that the amount of oxidized carbon of rGO-CT was lower than those of the other rGOs. This may be evidence that the micro-morphology of rGO depends on reduction process.
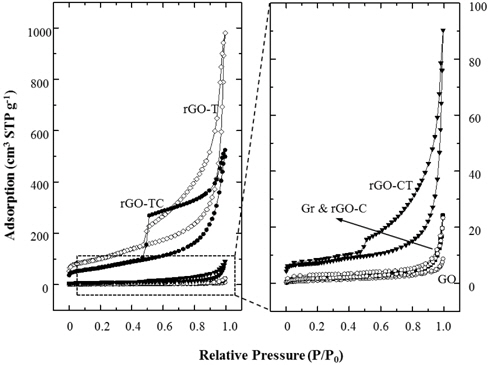
Figure 5 shows the nitrogen adsorption isotherms of graphite and their chemical analogs. Compared to the adsorptions at the relative pressure of 0.05 or less, the specific surface areas of Gr, GO and rGO-C did not change. The isotherms of Gr, GO, and rGO-C exhibited typical nonporous characteristics in the entire relative pressure range (P/P0). However, rGO-T, TC, and CT showed hysteresis under desorption of 0.4 ~ 0.5 (P/P0). Here, isotherm and hysteresis of rGO-CT were relatively smaller than those of rGO-T and TC. These hysteresis behaviors were caused by mesopores and macropores between rGO sheets. The pores were estimated to be in the form of a typical gourd bottle with a small entrance and a large internal diameter.
The meso- and macropores were generated by the exfoliation of GOs during oxidation and removal of the oxidized groups of the GOs during subsequent reduction. GOs with high amounts of oxidized groups were exfoliated and very soluble in water. These isolated GO sheets could stack with one another randomly and wrinkled. Then the irregular pores of rGOs were generated from the random and wrinkled GO stacks during reduction process. Nonporous characteristics of rGO-C indicate that the chemical reduction was quite effective to remove the oxidized groups from GOs, but less effective on structural exfoliation. On the comparison of the BET (Brunauer, Emmett & Teller) surface area in Table 2, the value of rGO-C was measured to be comparable to those of graphite and GO.

BET Surface Area (m2 /g) of graphite (Gr), graphite oxide (GO) and reduced graphite oxides (rGOs).
These results showed agreement with the XRD analysis. As compared to rGO-T and TC, the adsorption isotherm of rGO-CT was measured to be very low. BET surface area of rGO-CT was as low as 10 times that of rGO-TC in Table 2. As a result, the structural properties of rGOs were closely dependent on the selection of reduction methods and the treatment sequence.
Table 3 presents the sheet resistances of rGO thin films prepared in this work. The increase of film thickness caused the decrease of optical transmittance. The improvement of ohmic contact between rGO sheets, resulting improves the electrical conductivity. The sheet resistance (Ω/sq) of rGO (C) was 106 order in transmittances of 80%, 105 order in 70%, and finally, 104 order in 60%. Meanwhile, the sheet resistances showed a difference of the comparison between the other films with the same transmittance. The sheet resistance of rGO-T was too high to measure the value in all the transmittance. The conductivity of rGO-TC improved compared to rGO-T. In addition, the resistance of rGO-CT was similar to those of rGO-TC. These may be explained from the micro-morphological change of rGOs.
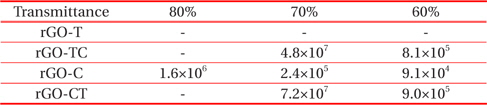
Sheet resistance (Ω/sq) of graphite (Gr), graphite oxide (GO) and reduced graphite oxides (rGOs).
As mentioned above, the surface structures of rGO-T were damaged seriously in the thermal reduction, and its conductivity was, as a result, worse. The improved conductivities of rGOs including the chemical reduction process might be due to the improvement of structural contact between rGO sheets. This was further supported by XRD and adsorption isotherm results.
Reduced graphite oxides (rGOs) were prepared by chemical oxidation of graphites and subsequent reductions. Graphite oxides (GOs) were reduced easily by thermal or chemical reduction methods. However, the selection of reduction processes lead to a slight difference in the structural characteristics of as-prepared rGOs. Thermal reduction somewhat mitigated the surface damage of rGOs, whereas chemical reduction was not effective in the recovery of the defects generated during the chemical oxidation of graphites. X-ray diffraction results demonstrated that interlayer exfoliation of rGO sheets was favorable on rGO-T obtained from thermal reduction. The oxidized groups on graphites were modified mainly on the boundaries of the GO sheets. In addition, TGA analysis showed the structural change of as-prepared rGOs, depending on reduction methods, could make a difference on the thermal stability.