검색 전체 메뉴
PDF
맨 위로
OA 학술지
Multi-Frame Face Classification with Decision-Level Fusion based on Photon-Counting Linear Discriminant Analysis
  • 비영리 CC BY-NC
  • 비영리 CC BY-NC
ABSTRACT
Multi-Frame Face Classification with Decision-Level Fusion based on Photon-Counting Linear Discriminant Analysis
KEYWORD
Decision-level fusion , Data fusion , Face classification , Face recognition , Photon-counting , Linear discriminant analysis
  • 1. Introduction

    Face classification has many applications in security monitoring and intelligent surveillance, as well as robot vision, image and video retrieval, and human-machine interfaces [1-3]. However, it is challenging to classify a facial image acquired in an uncontrolled setting, such as those captured at long distances. Unexpected blurring and noise may occur, in addition to conventional distortions caused by pose, illumination, and expression changes. To address these issues, various classifiers have been developed based on statistical analysis, including Fisher linear discriminant analysis (LDA) combined with principal component analysis (PCA) [4], (often referred to as “Fisherfaces”), as well as the “Eigenfaces” method, which uses only PCA [1]. Typically, the number of training images is much less than the number of pixels. Thus, the Fisher LDA requires a dimensionality reduction such as PCA in order to avoid the singularity problem, often referred to as the “small sample size problem.” However, photoncounting (PC) LDA does not suffer the singularity problem associated with a small sample size [5]. Originally, PC-LDA had been developed to train grayscale images and classify a photonlimited image obtained under low illumination. However, it has been shown that PC-LDA is also suitable for classifying grayscale images, which can be obtained by a visible camera [6].

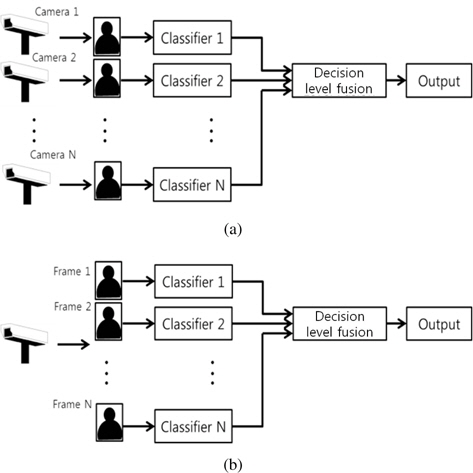
    Decision-level fusion is a high-level data fusion technique [7, 8]. It aims to increase classification accuracy by combining multiple outputs from multiple data sets. Compared to single frames, multi-frames contain additional information acquired from varying spatial or temporal settings, as illustrated in Figure 1. Various fusion rules such as maximum, averaging, and majority-voting rules have been studied in the literature [9, 10]. Bayesian estimation and Dempster-Shafer evidential reasoning are often adopted for decision-level fusion [11]. In [12], preliminary results are provided for multi-frame recognition with several data sets.

    In this paper, multi-frame decision-level fusion with PC-LDA is discussed. Decision-level fusion involves three stages: score normalization, score validation, and score combination. After the scores are normalized, candidate scores are selected using a screening process (score validation). Subsequently, the scores representing the classes are combined to render a final decision using a fusion rule (score combination). The validation stage screens out “bad” scores that can degrade classification performance. The maximum, averaging, and majority voting fusion rules are investigated in the experiments. Three facial image datasets (ORL, AR, Yale) [13-15] are employed to verify the effectiveness of the proposed decision-level fusion scheme.

    The remainder of the paper is organized as follows. PC-LDA is discussed in Section 2. Section 3 describes decision-level fusion. The experimental results are presented in Section 4. The conclusion follows in Section 5.

    2. Photon Counting LDA

    This section briefly describes PC-LDA. PC-LDA realizes the Fisher criterion using the Poisson distribution, which characterizes the semi-classical photo-detection model [16]. A PC vector y is a random feature vector corresponding to a normalized image vector x. Thus, the dimensions of x and y are the same value, which is the number of pixels d; yi is the i-th component of y, and it follows the independent Poisson distribution with the parameter Npxi, that is, yi ∼ Poisson(Npxi). It is noted that xi is the normalized intensity at a pixel i such that , and Np indicates the total number of average photo-counts because the following equation is valid: .

    The between-class covariance measures the separation of classes as

    image

    where the class-conditional mean and the mean vectors are derived as µy|j = Npµx|j and µy = Npµx, respectively; j indicates a class, and superscript t denotes a matrix transpose. The within-class covariance matrix measures the concentration of members in the same class as

    image

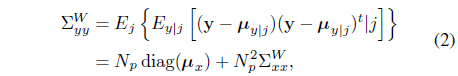
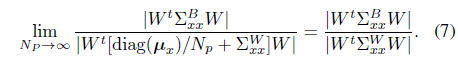
    where diag(·) denotes a diagonal matrix. Thus, the following Fisher criterion can be derived:

    image

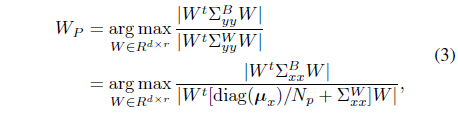
    where the column vectors of WP are equivalent to the eigenvectors of corresponding to the non-zero eigenvalues. It is noted that is non-singular because of the non-zero components of µx .

    The class decision can be made by maximizing a score function, as follows:

    image

    where C is the number of classes. The normalized correlation is adopted as a score function:

    image

    The photo-counting vector yu of an unlabeled object is required for class decisions, as depicted in Eq. (5). Alternatively, yu can be estimated with the intensity image vector xu. Because the minimum mean-squared error (MMSE) estimation is the conditional mean [17], a point estimation of yui becomes E(yui|xui) = Npxui, where yui and xui are the i-th component of yu and xu, respectively. Thus, Eq. (5) is equivalent to the following score function:

    image

    The mean-squared (MS) error is the same as the variance of yui, which is Npxui. The MS error increases as Np increases; however, the PC-LDA converges to the Fisher LDA as Np goes to the infinite as

    image

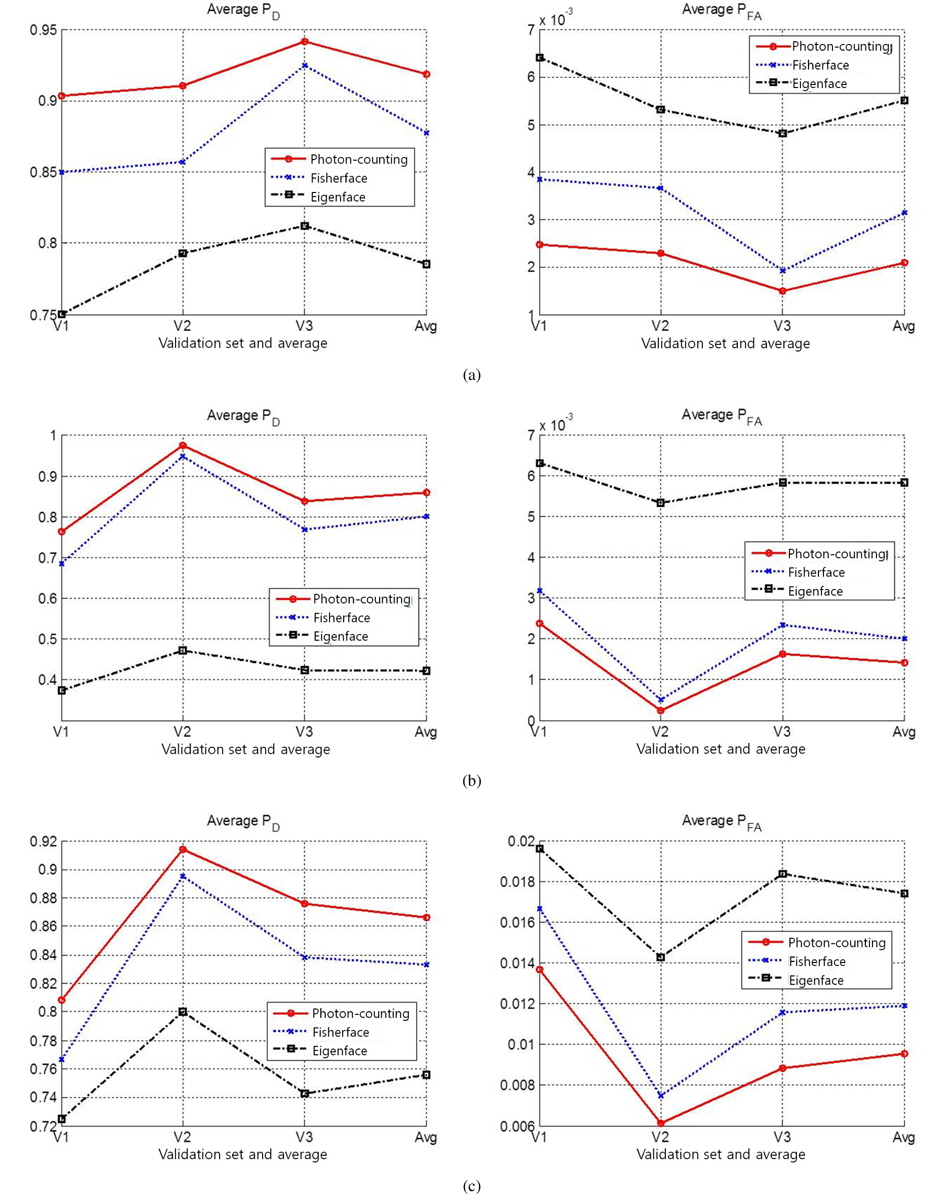
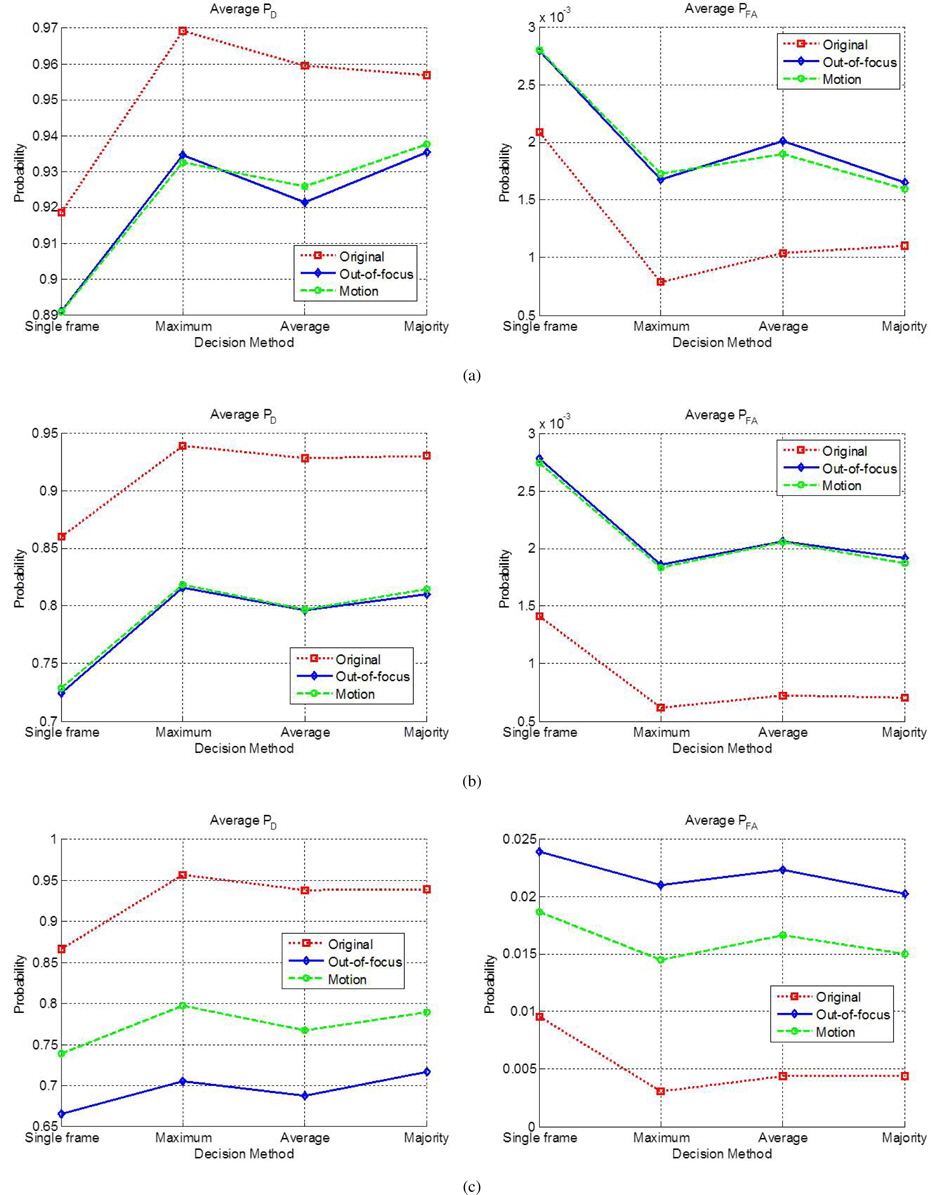
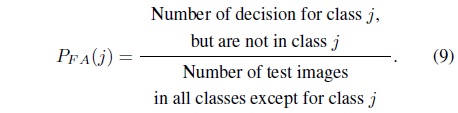
    Two performance measures are calculated to evaluate the performance of the classifiers. One is the probability of correct decisions (PD), and the other is the probability of false alarms (PFA) [6]:

    image
    image

    3. Decision-Level Fusion

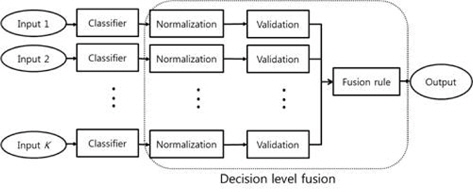
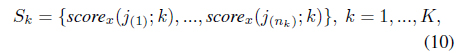
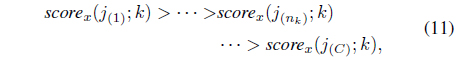
    Decision-level fusion is composed of three stages: score normalization, validation, and fusion rule processes; these are illustrated in Figure 2. The scores must be normalized if they are presented in different metric forms. The candidate scores are selected during the validation process. Finally, they are combined to create a new score, using a fusion rule. For the score validation, a score set Sk is composed of nk scores selected from the output scores of a frame k as follows:

    image
    image

    where K is the total number of frames. S1,. . . ,SK score sets are then reassigned to new sets as follows:

    image

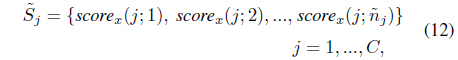
    where is the number of scores for class j from all K frames. Therefore, and are held between the sets Sk and . The following three fusion rules are adopted to compute the final score for class j:

    image
    image
    image

    where Eqs. (13)-(15) represent maximum, averaging, and majority voting rules, respectively.

    4. Experimental and Simulation Results

    This section describes two types of experiments. The first involves the verification of PC-LDA with a single frame. In the second experiment, decision-level fusion is tested with artificially degraded test images.

       4.1 Face Classification

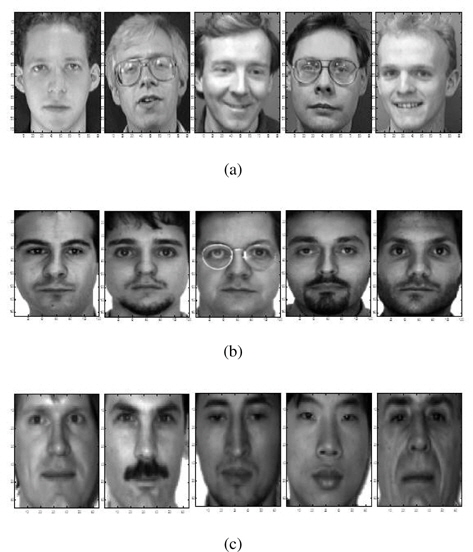
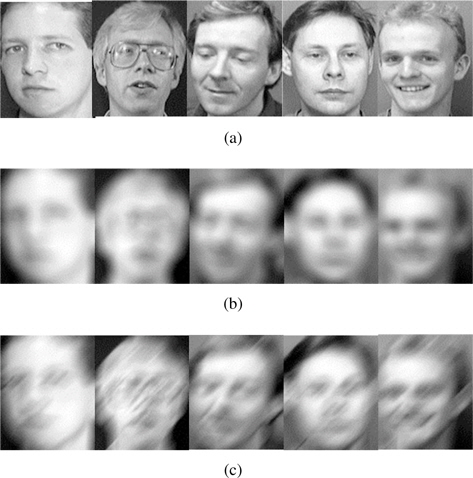
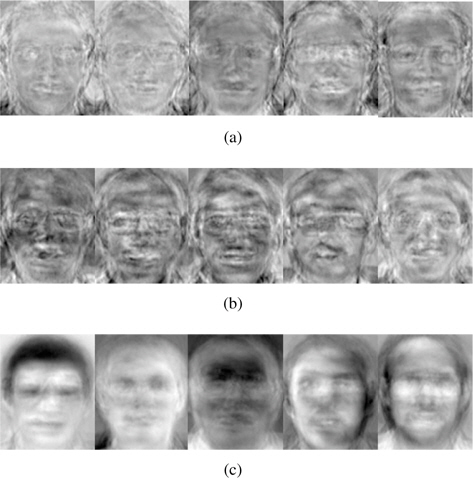
    Three facial image datasets were used for the performance evaluation: ORL [13], AR, [14], and Yale [1]. The MATLAB format was utilized for the Yale database [15]. Figure 3 shows the sample images of five classes from three datasets. The datasets contain 40, 100, and 15 classes, respectively; these classes respectively contain 10, 26, and 11 images. The dataset image sizes are 92 × 112, 120 × 165, and 64 × 64 pixels, respectively. Each database was divided into three validation sets, as shown in Table 1. For the single-frame experiment, each validation set was trained and all other validation sets were tested. For example, when three images (image indexes 1–3) in set V1 of the ORL dataset were trained, the other seven images (image indexes 4–10) were tested. Figures 4 represents the five column vectors of the PC-LDA face, Fisherface, and Eigenface projection matrices, respectively, in the image scale; three images from set V1 of the ORL dataset were trained to produce these results. As illustrated in the figures, the PC-LDA face presents the optimal structural diversity among the three classifiers, although the Eigen face method is more dependent on the intensity distribution, compared to the other methods. Figure 5 shows the average probability of detection (PD) and average probability of a false alarm (PFA) when each validation set is trained and other images are tested as a single frame. The results are compared with the Fisherface and Eigenface methods.

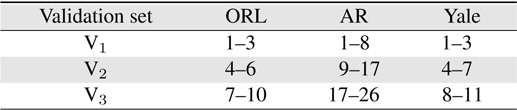
    [Table 1.] Image index in validation sets

    label

    Image index in validation sets

       4.2 Decision-Level Fusion

    For the decision-level fusion experiment, test images were blurred by out-of-focus and motion blurring point-spread functions, to simulate long-distance acquisitions. Out-of-focus images were rendered by applying circular averaging with an 8 pixel radius. Heavy motion blurring was rendered by a filter approximating the linear motion of a camera for a distance of 20 pixels, with an angle of 45 in a counter-clockwise direction [6]. Figure 6 shows the sample test images from ORL after blur rendering.

    It was assumed that one pair of test images in the validation set was obtained by multiple sensors; thus, the total number of frames (K) was set to two. For example, if the number of test images was seven in the single-frame experiment, the number of test pairs for the multi-frame fusion was 21 (= 7C2). Figure 7 shows the average PD and PFA for the ORL, AR, and YALE datasets. The maximum rule produced the optimal results for the original images; however, the majority rule produced the optimal results when the images were degraded with the blurring functions.

    5. Conclusions

    This study investigated the effectiveness of a decision-level fusion system with multi-frame facial images. Three decision-level fusion schemes were investigated, following the score normalization and validation processes. Two types of blurring point-spread functions were applied to the test images, in order to simulate harsh conditions. The results indicated that the proposed data fusion scheme improved the classification performance significantly.

참고문헌
  • 1. Belhumeur P. N., Hespanha J. P., Kriegman D. 1997 “Eigenfaces vs. Fisherfaces: recognition using class specific linear projection,” [IEEE Transactions on Pattern Analysis and Machine Intelligence] Vol.19 P.711-720 google cross ref
  • 2. Etemad K., Chellappa R. 1997 “Discriminant analysis for recognition of human face images,” [Journal of the Optical Society of America A] Vol.14 P.1724-1733 google cross ref
  • 3. Jain A. K., Ross A., Prabhakar S. 2004 “An introduction to biometric recognition,” [IEEE Transactions on Circuits and Systems for Video Technology] Vol.14 P.4-20 google cross ref
  • 4. Duda R. O., Hart P. E., Stork D. G. 2001 Pattern Classification google
  • 5. Yeom S., Javidi B., Watson E. 2007 “Three-dimensional distortion-tolerant object recognition using photoncounting integral imaging,” [Optics Express] Vol.15 P.1513-1533 google cross ref
  • 6. Yeom S. 2012 “Photon-counting linear discriminant analysis for face recognition at a distance,” [International Journal of Fuzzy Logic and Intelligent Systems] Vol.12 P.250-255 google cross ref
  • 7. Jimenez L. O., Morales-Morell A., Creus A. 1999 “Classification of hyperdimensional data based on feature and decision fusion approaches using projection pursuit, majority voting, and neural networks,” [IEEE Transactions on Geoscience and Remote Sensing] Vol.37 P.1360-1366 google cross ref
  • 8. Canavan S., Johnson B., Reale M., Zhang Y., Yin L., Sullins J. August 23-26, 2010 “Evaluation of multi-frame fusion based face classification under shadow,” [Proceedings of the 20th International Conference on Pattern Recognition] P.1265-1268 google
  • 9. Sadeghi M., Samiei M., Kittler J. 2010 “Fusion of PCA-based and LDA-based similarity measures for face verification,” [EURASIP Journal on Advances in Signal Processing] Vol.2010 P.647597 google
  • 10. Yanwei P., Nenghai Y., Rong Z., Jiawei R., Zhengkai L. October 24-27, 2004 “Fusion of SVD and LDA for face recognition,” [Proceedings of the International Conference on Image Processing] P.1417-1420 google
  • 11. Freedman D. D. 1994 “Overview of decision level fusion techniques for identification and their application,” [Proceedings of the American Control Conference] P.1299-1303 google
  • 12. Yeom S. 2014 “Decision-level fusion approach to face recognition with multiple cameras,” [SPIE Proceedings] Vol.9120 P.91200G google
  • 13. Samaria F. S., Harter A. C. December 5-7, 1994 “Parameterisation of a stochastic model for human face identification,” [Proceedings of the 2nd IEEE Workshop on Applications of Computer Vision] P.138-142 google
  • 14. Martinez A. M., Kak A. C. 2001 “PCA versus LDA,” [IEEE Transactions on Pattern Analysis and Machine Intelligence] Vol.23 P.228-233 google cross ref
  • 15. Georghiades A. S., Belhumeur P. N., Kriegman D. 2001 “From few to many: illumination cone models for face recognition under variable lighting and pose,” [IEEE Transactions on Pattern Analysis and Machine Intelligence] Vol.23 P.643-660 google cross ref
  • 16. Goodman J. W. 1985 Statistical Optics google
  • 17. Papoulis A. 1991 Probability, Random Variables, and Stochastic Processes google
OAK XML 통계
이미지 / 테이블
  • [ Figure 1. ]  Configurations of varying (a) spatial setting, (b) temporal setting.
    Configurations of varying (a) spatial setting, (b) temporal setting.
  • [ ] 
  • [ ] 
  • [ ] 
  • [ ] 
  • [ ] 
  • [ ] 
  • [ ] 
  • [ ] 
  • [ ] 
  • [ ] 
  • [ ] 
  • [ Figure 2. ]  Block diagram showing decision-level fusion.
    Block diagram showing decision-level fusion.
  • [ ] 
  • [ ] 
  • [ ] 
  • [ ] 
  • [ Figure 3. ]  Sample images from (a) ORL, (b) AR, (c) Yale.
    Sample images from (a) ORL, (b) AR, (c) Yale.
  • [ Figure 4. ]  (a) Photon-counting linear discriminant analysis face, (b) Fisherface, (c) Eigenface.
    (a) Photon-counting linear discriminant analysis face, (b) Fisherface, (c) Eigenface.
  • [ Figure 5. ]  Single frame results of PD and PFA: (a) ORL, (b) AR, (c) YALE.
    Single frame results of PD and PFA: (a) ORL, (b) AR, (c) YALE.
  • [ Table 1. ]  Image index in validation sets
    Image index in validation sets
  • [ Figure 6. ]  Sample test images from ORL: (a) original, (b) out-of-focus blurring, (c) motion blurring.
    Sample test images from ORL: (a) original, (b) out-of-focus blurring, (c) motion blurring.
  • [ Figure 7. ]  Decision-level fusion results of PD and PFA: (a) ORL, (b) AR, (c) YALE.
    Decision-level fusion results of PD and PFA: (a) ORL, (b) AR, (c) YALE.
(우)06579 서울시 서초구 반포대로 201(반포동)
Tel. 02-537-6389 | Fax. 02-590-0571 | 문의 : oak2014@korea.kr
Copyright(c) National Library of Korea. All rights reserved.